iBankCoin
Home / Uncategorized (page 5)

Uncategorized

Reality Check: Falling TLT (Rising Yields), Means What For Stock Prices?

I get a little tired of the myth that rising interest rates is bearish. Sure, periods of time it can be, but eventually the cash flooding out of treasuries goes somewhere. Also, rising interest rates mean there is a BID for CASH, so people are willing to start BORROWING. If people don’t want to borrow, interest rates don’t magically start going up. The interest rates go up on demand to bring cash up front and borrow.. Hence, this should be bullish if anything. Granted, the market behaves based off of ideas that were formed hundreds of years ago in economic textbooks. Sometimes falling bonds and rising yield has been bearish for stocks, but the long long term correlation and current trend seems to say rising yield is correlated with rising stock prices.

TLT going up means falling yield, rising bond prices. TLT going down means Rising yield falling bond prices.

TLT to SPY

correlation tracker

TLTnegativecorrelation

Sometimes you have to shut your economic textbooks, and look at reality.

Comments »

Update

A little late on this update since I’ve been intently watching aapl 445 weeklys putting forth the sideways screw, but I closed remaining weekly SPY put options at 0.25 as they were expiring today had opportunity to get out at about twice that but volume pocket below so I waited and sold at the higher low on 1m chart.

Recap: Bought at .05 sold half at .35, 1/3rd of total position at .60, and 1/3rd at .25.

Still holding last half of the June07 from $0.75 after selling half at 1.61.

Still own DECEMBER SPY puts @ $154 strike from $4.30. But this one differs in that it is more to preserve my capital and allow me to press my longs (that I expect to outperform the market) a bit harder in the meantime if the market turns and I’m busy taking off individual positions I get bearish more quickly. I plan on selling with plenty of time left to prevent theta decay.

Was right about market finding a temporary bottom, wrong about it lifting AAPL. Will likely scratch out for a loss or break even soon.

At some point I gotta get back to picking individual names to be bearish on rather than these SPY hedges. It does work just fine as long as the individual stock and option plays outperform the market in up and down markets, but the alternative of finding individual bearish names that break down to a greater than the market and can outperform in both conditions is much more ideal if you can get it. Maybe LNKD below $170.

I tried one bearish name early today in ASTX. Not perfect but should get the job done more than the SPY should we roll over, and maybe even if we go sideways.

Was tempted to take a bit of my JUNE FXY off today and put it back into UUP while keeping the longer term September FXY on. But the yen is still so oversold and showing early signs of breaking out of a wedge at least on a daily time frame. The Euro and Dollar have yet to clearly identify a direction. The euro has two potential outcomes. One is the upwards trend channel, the other is a head and shoulders breakdown. The dollar looks more like a breakout then not to me, but UUP still needs to clear $23. Both are consolidated pretty tight and ready to move and dollar is hinting slightly at higher and euro lower, but it isn’t clear yet.

GLD needs to close above $135 in the next 2 trading days or I am out of it as well as FCX. It also must not break below the lows before then or I am out.

That’s all I have to say for now. If I get a chance I will talk a bit more about correlations and managing portfolio volatility for greater long term growth.

5/28: When Dow was up near the highs again, this time I grabbed some TRV and LNKD puts. I will be getting rid of a lot of puts if we close this week at new all time highs. Good spot to manage risk to concerned about day-to-day run above new highs. On longer term basis anything in the 15500-16000 level in the dow looks like strength to sell into. I expect a pullback at some point. If this is a secular run starting I will have plenty of time to get back in above the long term megaphon/broadening pattern.

Comments »

FEAR – False Evidence Appearing Real

There are 3 appropriate acronyms for the word FEAR. F.E.A.R.
Fail Early And Often (good advice for gaining experience and learning quickly, and learning how to manage it… but not a good “mantra” to drill into your subconscious mind.)
Then there is the legitimate kind. (F&* Everything…. And RUN!)

And finally “False Evidence Appearing Real”…

The reason I prepare with the charts and such is so I have a good enough read and enough knowledge of the situation to consider MULTIPLE outcomes.

In the most recent case, I was fully prepared to begin shorting at dow 15500-16000 and started actively hedging via short GLD before the first drop, long the dollar (UUP) and long the Yen (FXY). But once 15500 hit which happened to line up with the euphoria in the news that Bernanke would keep QE going, I jumped into action and grabbed some weekly 164 puts. This is what I was looking at this Monday.
dia monday

And I had previously posted this longer term chart…

$indu

Also, “Luv2Gambool” had a great post on the market topping that provided me with a bit more conviction.

I had began adding puts to attempt to call a top from last Friday. Yesterday was my first attempt at weekly options which was an aggressive play. I was surprised to get the fill at 0.05 for 164 puts on the SPY. I put in the order then I brought up the charts and before I could even see where we were, the puts filled. I was getting ready to edit the prior order to .10 to make sure they go through because I saw how the 15500+ range was a great spot to get short and I wanted in immediately. It wouldn’t go through because the trade executed. So I went to put in another order only to find the bid was already above .10. I ended up not putting in a second order on the weeklys, but it’s okay because I sold half at .35 and today sold half of the remaining half at 0.60 as well as half of the puts the first week of JUNE. I then added an AAPL call. WHY suddenly go from expecting a 10% correction to making a bullish in a leveraged name with a leveraged CALL option?

Sentiment. F.E.A.R. It was a lot of “FALSE EVIDENCE APPEARING REAL” Nikkei down 7% reminded me a lot of the Lehman bankruptcy that caused capitulation bottom. Everyone was suddenly so fearful. I also have to tell you, with options, much less weekly options, you can go from neutral to super bearish in your portfolio very quickly when you have a gap lower like this. And I wanted to at least lean closer to neutral after a move downwards… If not bullish. But that was after long periods of a 2 year wreckage this is near the highs. I don’t know, maybe Japan had their “1987” type event. Interestingly enough, it was the 1987 event and talks of manipulating the dollar 50% lower that shifted capital TO Japan leading up to 1989 Nikkei bubble in the first place. Well now there is a “1987 event” 1000+ point down day in Asia…. Does that mean capital could shift back into the US and form a bubble? Of course. Regardless, there is a lot of domestic and foreign capital that got out of the Nikkei and Asia names. There is a lot of capital moving around. That means the potential for big moves. For the time being there still is the possibility that we retest, breakdown, and correct. Or we could have already bottomed. I would keep a close eye on yesterday’s LOW and more importantly yesterday’s CLOSE. It is at this point that I may add some puts with more time on them since we could very well chop around here if this is the worst of the flushout for the next few days. I see a tight range followed by a break. My bias on a more reasonable time frame that isn’t so fickle about shifting around every couple days is short until we break and close above yesterday’s high. My longs have been done with a HALF position size.

Note:I also added GLD calls of all names! 130.75 is where I give up on it. If the lows give GOLD sees a quick drop to 1200. But we are oversold here so I think it will possibly retest the breakdown point before that happens.
I also added FCX calls. Both July dated. I was going to wait until GLD hit 1200 before I added FCX, but I like GLD’s spot. That big pivot move off it’s low makes me bullish as long as we clear GLD 135 in a few trading days (and stay above the low) I will stay in the name. The stop is just below the low until we start moving above 135. Then I raise the stop based on it’s 3 day low. Eventually I loosen the stop if the move is working. Ultimately for now I am looking for at least 140 to the upside.
Also added the VIX exposure (VXX July Calls) as we retested yesterday’s low and successfully filled the gap. Nice inverse head and shoudlers setting up in the VIX too. Lots of moves today

Comments »

Just Some Winship Right Here

Just showing everyone I know a thing or two.

Weekend Ideas Should Be Compiled Here

hattery says:

I’ve overachieved in an overextended market during a historically not so bullish time, overbought RSI on weekly and daily extended into upper Bollinger band and overbought slow stochastics near the upper trend channel and resistance coming up on longer term pattern.
The strongest bull markets don’t give you a chance to buy much of a dip very often, but this is a little bit extreme. Protection is my play… But if I had to initiate some new positions.
Gear up for war with ERJ, KAMN, RGR, maybe TASR and the civil disorder with SWHC.

If you want the high debt equity, low quick ratio BK plays with high short float and low float…

CSTR,ALJ,CSUN,ROYL,BIOF and why not SOL too with solar going apesht.
Low float momentum names with EPS growth of 25+% MELI,VOXX, BBG,SWC,ZAZA

And ACTV and FSLR into the volume pocket
But mostly UUP and a small position in puts on Monday.

———————

BOOM! Take a look at those plays. Just taking a look at some of the gains from Friday’s close. Th

ERJ around 2.5%

KAMN 1.3%

RGR has yet to leave the station. TASR only one down 1% or so but I did say “maybe” by it. SWHC so far is break even.

CSTR up 3.2%

ALJ up about 6%

CSUN up near 90% from Friday’s close to today’s peak

ROYL up near 8%

BIOF up 15% today

SOL up around 35%

BBG up over 10% (although option addict had that name pegged like 10% earlier than me)

SWC nice 5%

ZAZA near 6%

Just in case anyone listened.. you’re welcome!

And in case anyone bought options in those names, you can send me a christmas card. haha

As for the “hedging” it allowed me to hang onto names like BIDU and FSLR and other plays a bit longer, rather than selling.

If you have acquired enough skills you should be able to outperform the market. However, there is always the chance that a liquidation takes just about everything down. Can you produce huge gains on down days? Certainly. But it’s a lot more difficult to account for the rare “flashcrash” type of events and get back to where you would be than it is to make up for a few minor losses because of a few puts you buy. Afterall insurance is cheap right now.

I am still long the dollar and the yen. The “Island bottom” in the Euro is a bit concerning for the time being. I do not feel comfortable aggressively adding to an already reasonably sized position in any currency at this point of time. I will let it come in to add while also keeping an eye on the technical breakout point of $23 on the UUP.

Unfortunately GOLD never worked off it’s oversold position enough for me to be comfortable with shorting it on the way down to it’s retest of the recent low and silver’s break. Those type of plays are great because you can make two profitable bets while hedging slightly as there is a slight positive correlation between gold and the S&P.

So when no real great shorts are setting up except the hard to borrow type or type where option spreads are insane, I am left just playing for alpha, betting that my longs will outperform the market and grabbing some puts on the SPY to preserve my gains without selling and protect myself from a drawdown.

My account still is climbing as I continue to park some of my gains from other plays into mostly longer dated hedges (puts in SPY, calls in UUP,FXY), and some just go back into other plays.

Why pay so much for premium I won’t use? Because if I don’t, I am betting aggressively on my timing and on “not being wrong”. I can do that with individual plays if the setup is right, but not in timing tops and hedging which is a more gradual process.

Timing the top is extremely difficult and I don’t expect to hit this out of the park. Just protect against on possible outcome. (I do have a small position in the more aggressive puts the first week of JUNE as well, but). If it moves against me, I want to protect myself with a large percentage of my position intact. The more time value you have, the more people pay for “potential” even for options far out of the money. So the chance of losing 50% of your premium or 100% are greatly reduced from your short term options, even though the returns will be less as well. Since the idea is to “protect capital” so I can focus on “making and earning capital” with the rest, hedges are generally played more as cautionary plays.


Comments »

hedge

Grabbing some spy puts at close as I am overexposed to the long side (or at least more than I would like to be) and don’t really want to sell a lot of anything I am in.

Up a lot from BIDU and fslr today thanks to optionaddict which gave me more of a need to raise cash. Opted for spy puts instead.

Comments »

Alternate Consideration for the Euro

6e

One always has to be flexible when trading. I was expecting with the break on the dollar we would see a more aggressive follow through. I reduced some of my earlier positions long dollar and short the euro for a modest gain but will still hold the remaining for the long term. There is still the possibility that we are in the early part of an uptrend. Personally I think we are perhaps just going to be flagging higher before we make a lower high and ultimately breakdown. Long term I remain bearish on the Euro, but long term can be a bit longer than anyone would like to see.

I shifted some capital into the beaten down YEN for a speculative play. I’ve been just using options on currency ETFs for now.

More on the Yen play later.

Comments »

At Some Point…. Something Has To Give… (Historical look from 1900-2013)

The last market to break above it’s very long term resistance on a trend channel was gold and it went parabolic. Before that it was maybe banks and real estate, but ultimately the big one was tech/biotech/the nasdaq.

http://stocktradinginvestments.com/wp-content/uploads/2013/05/parabolic.jpg

A break above say 16,000 in the dow basically could either put dow into a secular bull or perhaps even “parabolic territory”. I just don’t see dow going parabolic. Basically, if the DOW went parabolic it isn’t exactly like we are talking “growth” names here. It is the DOW and it’s pushing the ranges where it might start moving like the tech bubble here. If it does, I will start to actually believe the crazy people talking about hyperinflation because that becomes at least a possibility with those types of moves. Otherwise, it could just be capital everywhere around the world fleeing bonds, gold and all assets to get into stocks probably the most likely.  Even so, the idea of the market going parabolic to new extreme highs over the next few years just doesn’t seem right to me. Such a large percentage of the world’s capital is held in the US already that expecting a repeat of the 1980-2000 style run for any other reason seems somewhat farfetched, but not as much as hyperinflation in an economy that is the world reserve currency.

So as the title suggests, at some point, something has to give.

Now we have to try to identify WHEN and what price.

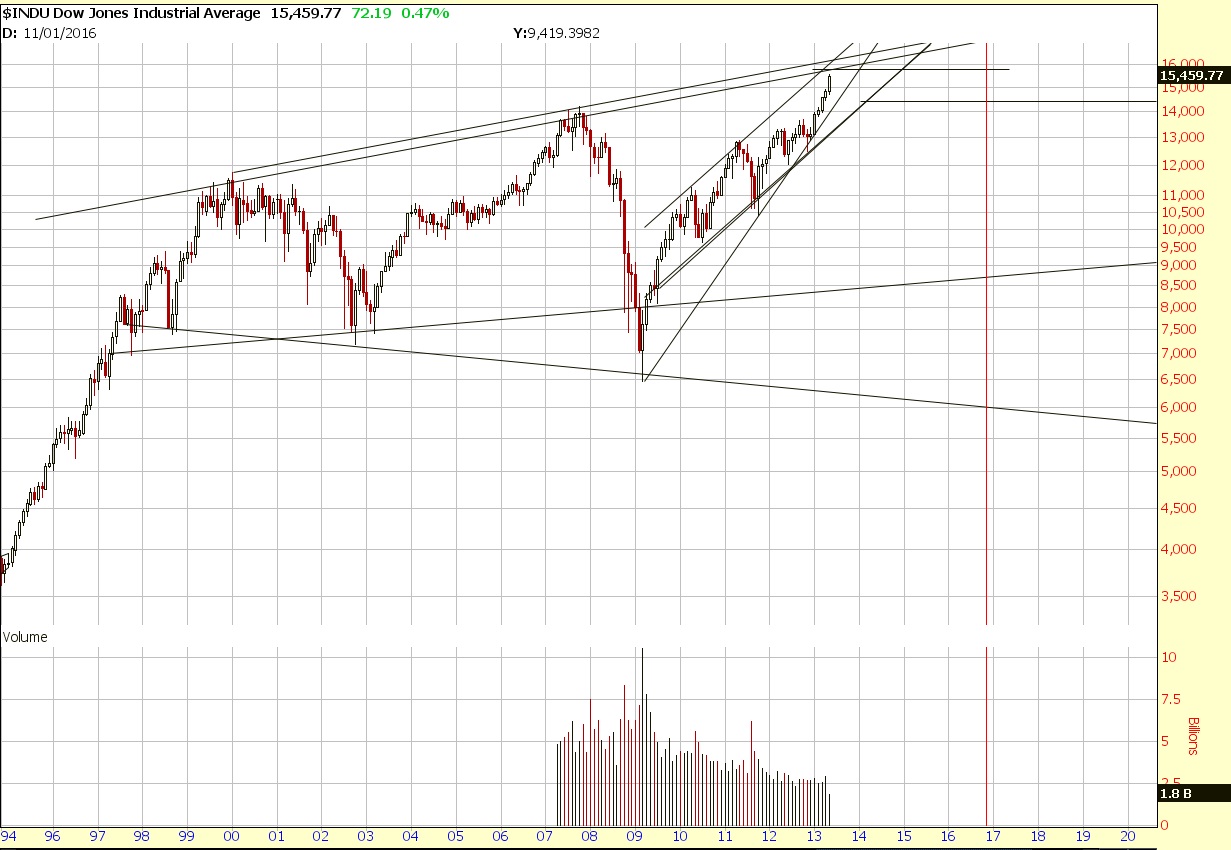
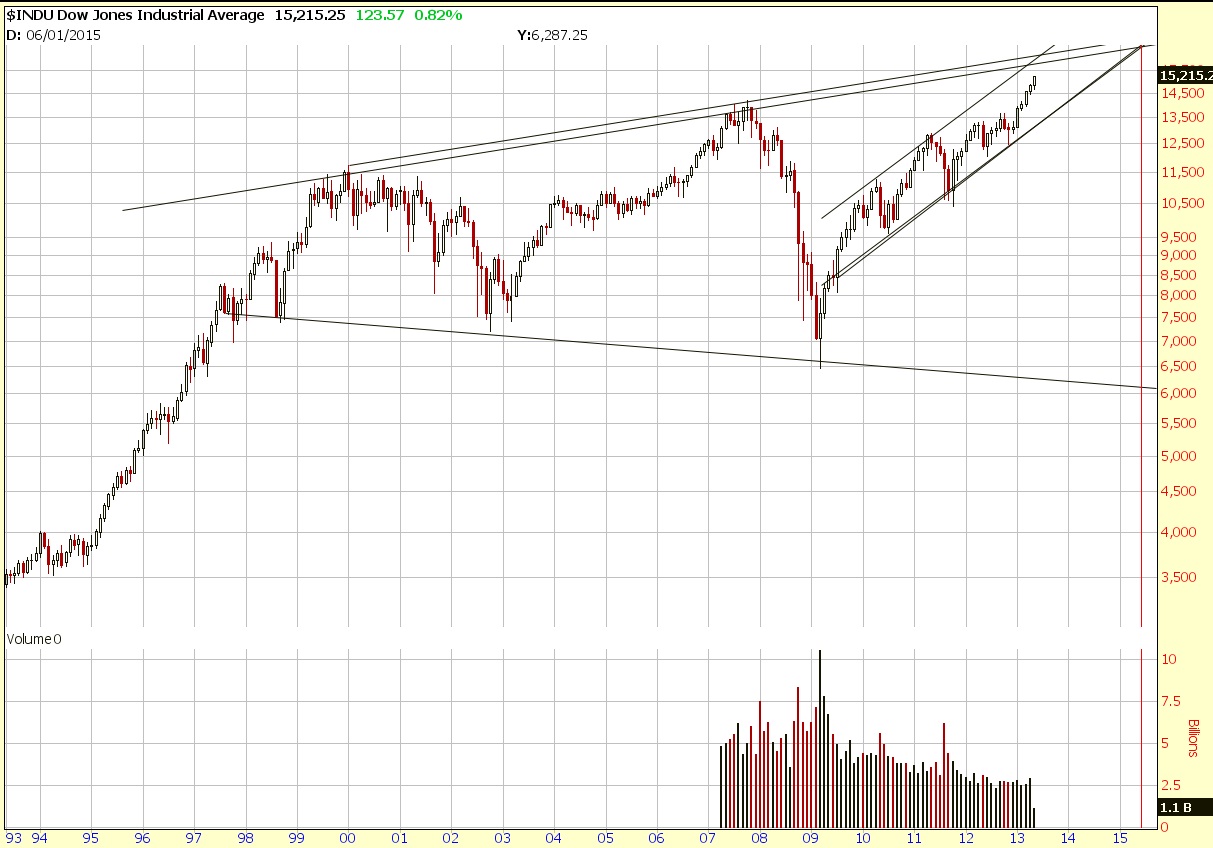
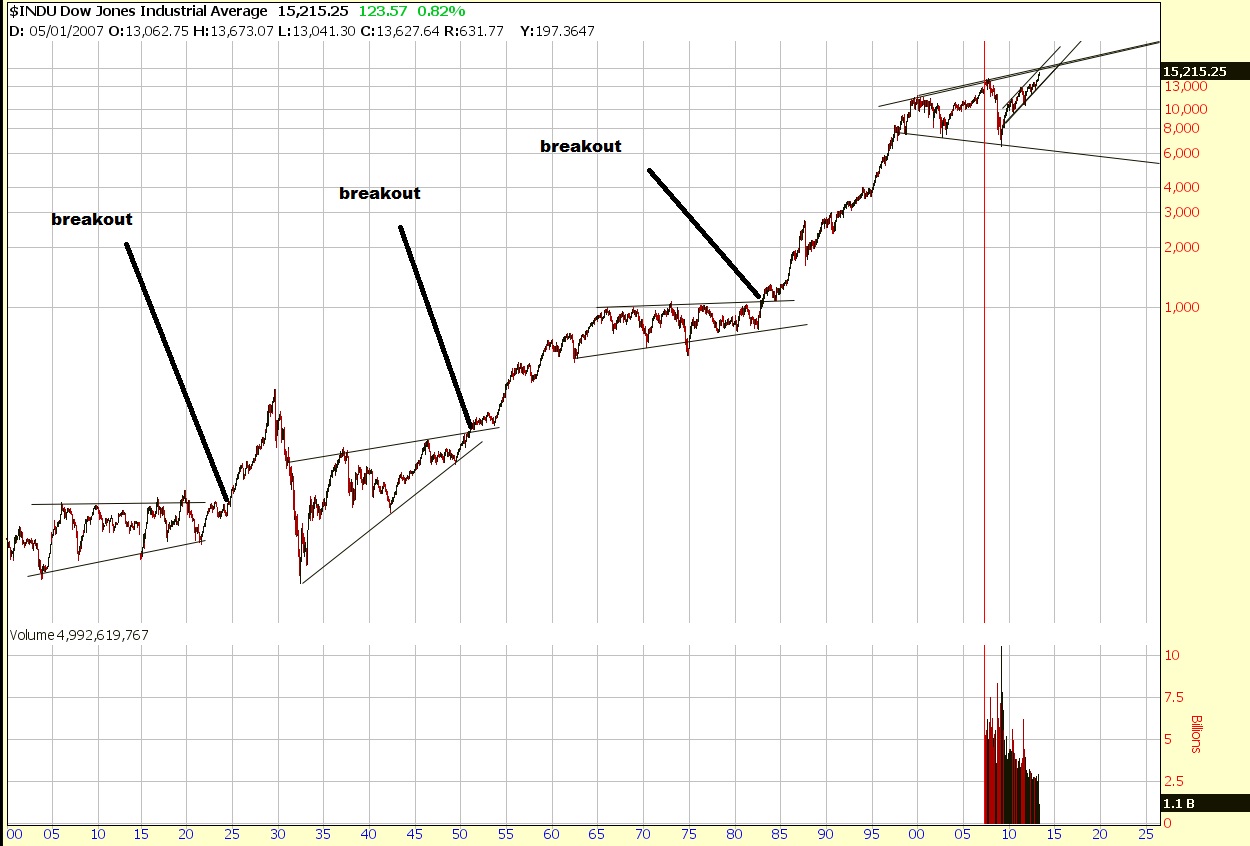
I believe we are in a broadening pattern on the very long term chart. I still remain open to the possibility of a long term secular bull market, and it’s possible a breakout would be all that is. However, if it happens I just think we still will make a higher low before we just go ripping through resistance.

Finding a reference point for markets making all time highs is not easy at all time highs so I had to go to the 20 year chart.
dow

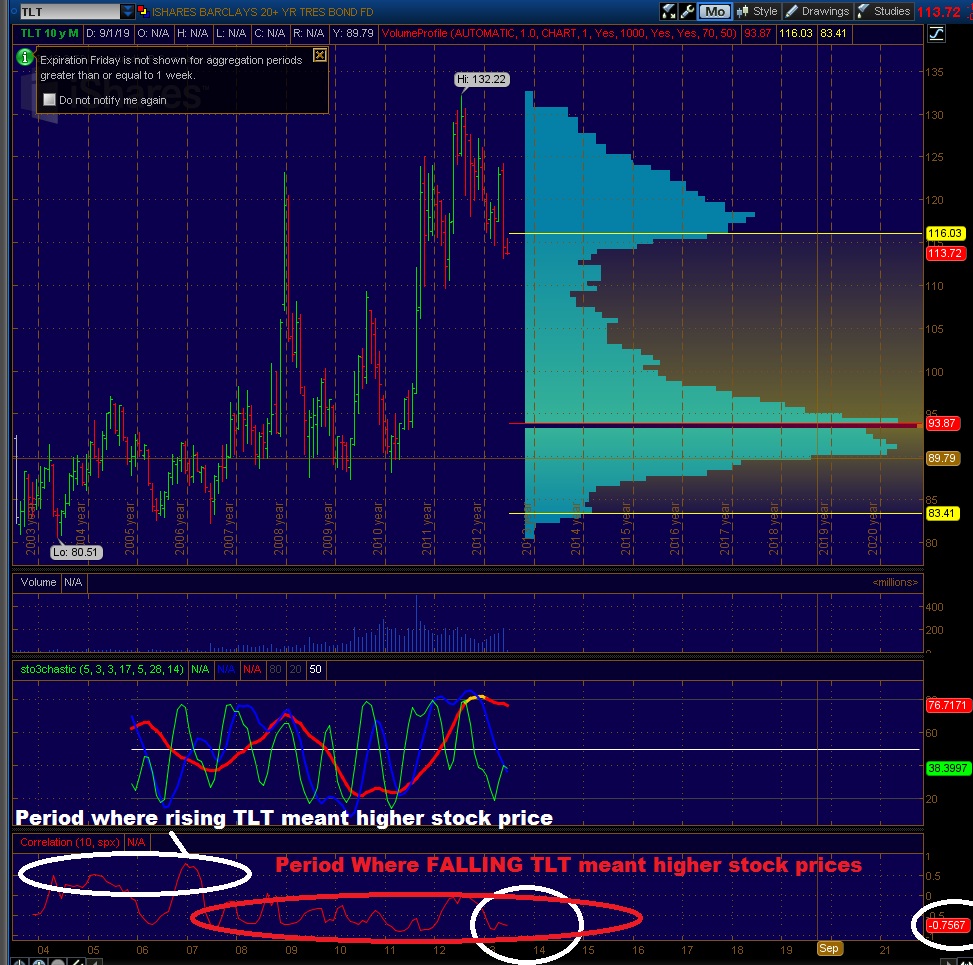
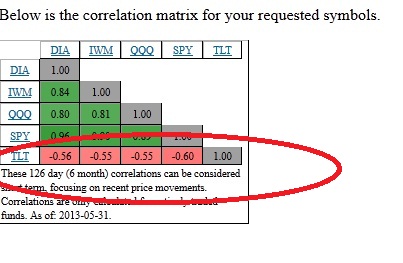
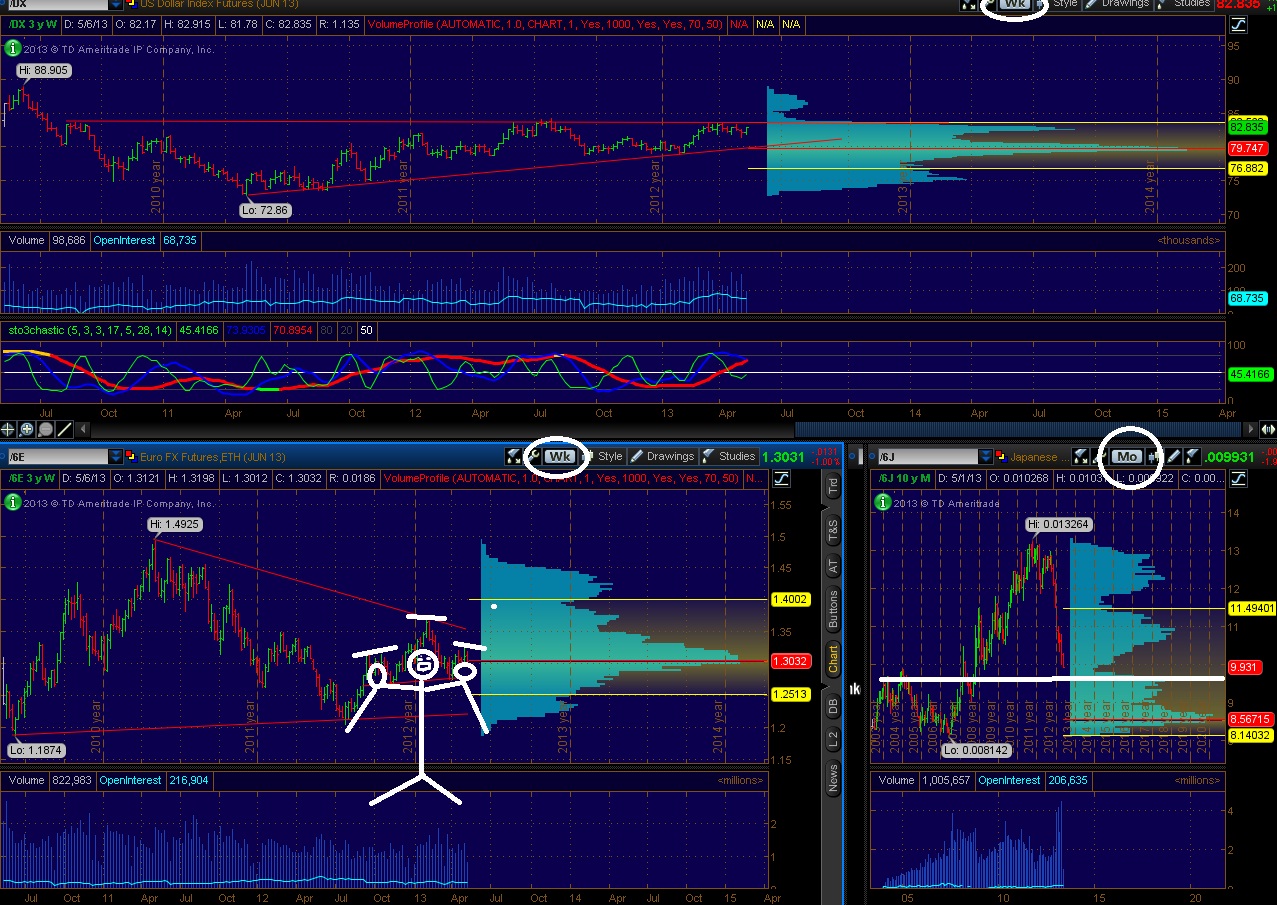
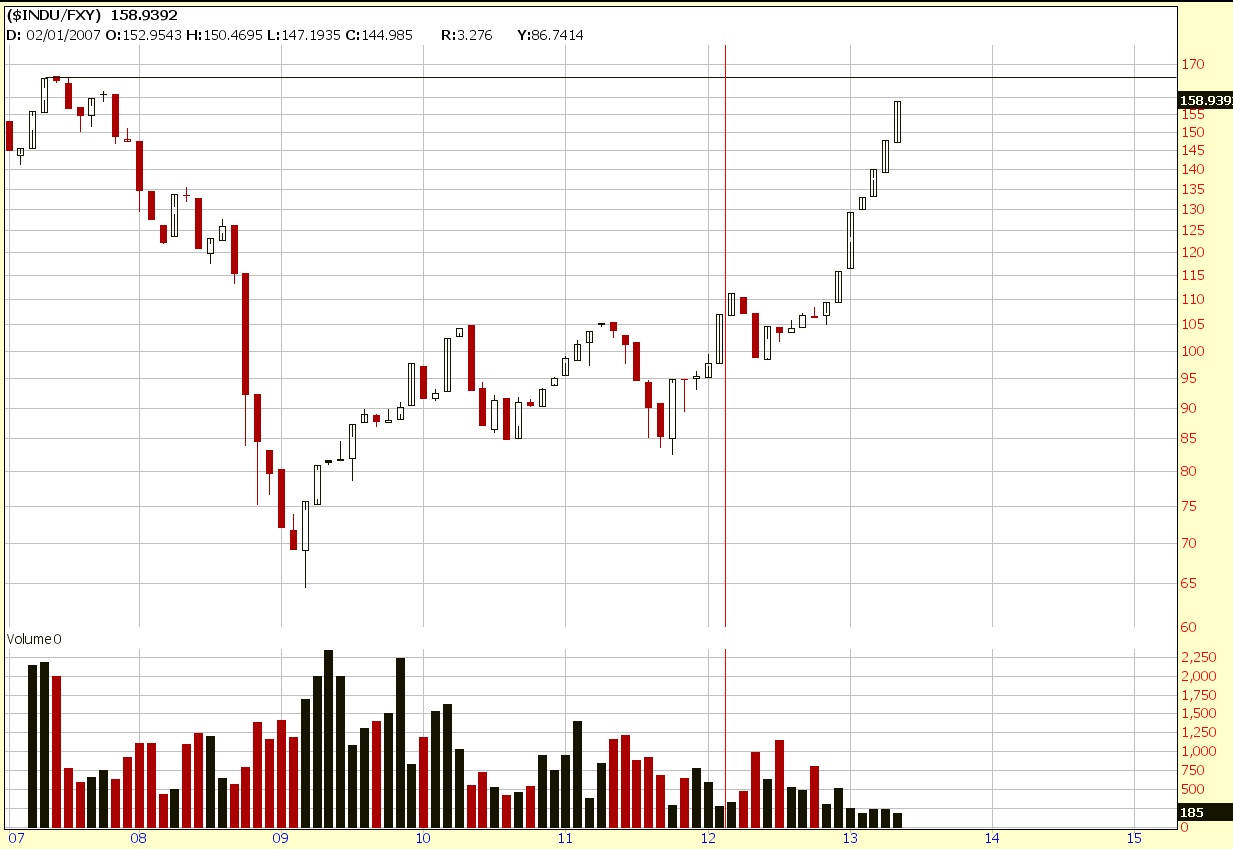
The only other way I could come up with a reference point was the dow to yen chart, which shows we still have not hit all time highs priced in YEN.  So it’s possible the capital shifts have reached it’s extremes once we touch the previous high level of 2007.
dowyen

There are plenty of instances when market was in a sideways range for quite some time before it made the major secular bull run type of move.
1)early 1900s Before roaring 1920s bull market.
2)1931-1950 before the 1950-1965 Bull Market
3)1965-mid 1980s before the 1980s and 1990s run interupted by the 1987 crash.
4)(late 1990s) 2000-???
100yr dow
I think it’s a bit premature to start calling for a secular bull run although I will absolutely not dismiss that possibility.

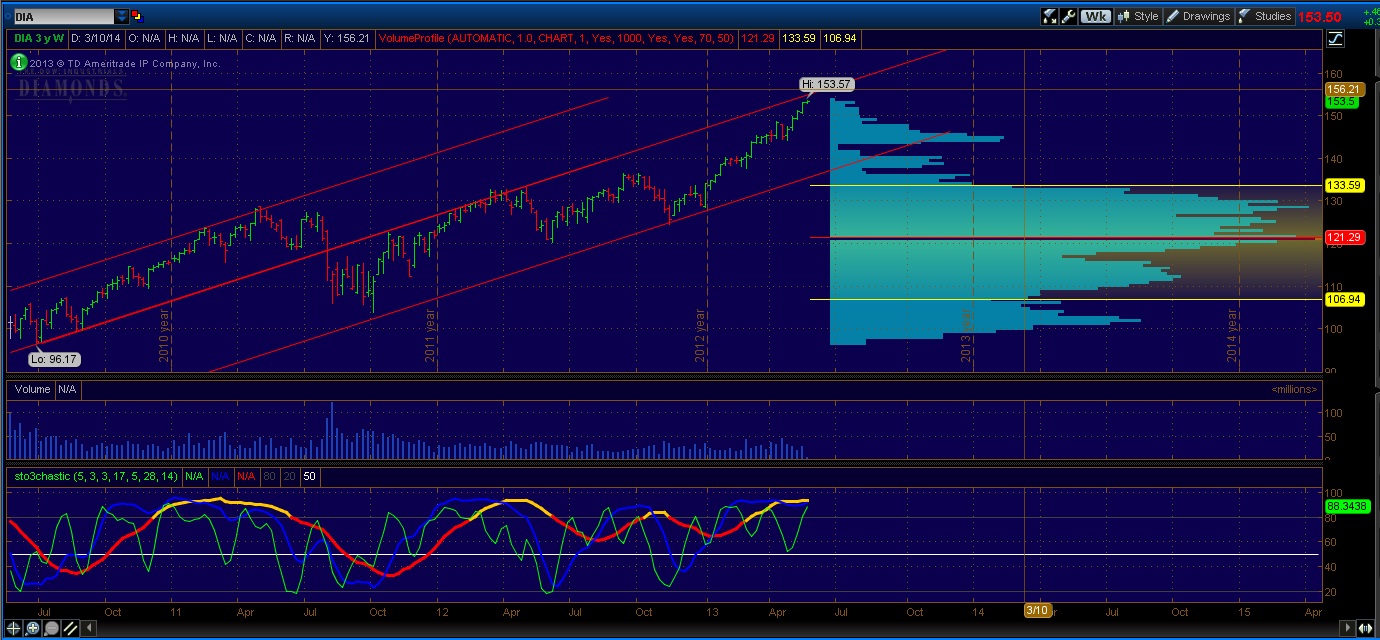
Unfortunately what is concerning is that this pattern is not the same as the others, rather than ascending lows, we see lower lows. A broadening formation (we also still have an outside chance to form a long continuation diamond bottom or a diamond top) typically is a reversal pattern at least on the daily and weekly charts. If the market is fractal than even though we really have no history of such a pattern, it should still have relevance. However, it’s still possible for there to be broadening formation breakouts. Nevertheless, at least a pull back to 14500 after perhaps a run to 15800 is a strong possibility. If we are to go higher, the capital is going to have to come from the bond holders and from Europe.

Just working a bit on historical moves a bit. In historical context just how “frothy” is this rally at this point? And just how much of a pull back would be “normal”. In every instance of the sideways move there were very large moves higher AND lower within the consolidation.

The following are roughly the peak to trough declines rounded to nearest 5%
1901-1904 45% decline in dow.
1906-1907 50% decline in dow.
1909-1914 50% decline in dow.
1916-1917 40% decline in dow.
1919-1921 40% decline in dow.

*1929-1932 90% decline in the dow.*
1937-1942 50% decline.
1966-1970 40% decline.
1973-1974 45% decline.

**1976-1982 Stagflation… Inflation adjusted decline?
1987-1987 40% decline.

2000-2002 40% decline.
2007-2009 55% decline.

*Around the 1929 crash the dollar rose trough to peak by around 50%. I look at it as a 50% move on top of a 50% rise in the dollar rather than a 90% move.

In terms of actual rallies there are two options. ONE is that we are entering a secular bull market, and the other that we are just nearing a top of a CYCLE. If it is a CYCLE top I think we see a “typical” 40% decline or so. Given the pattern it could be over 50% like 2008. But how much higher do we go before a pull back in that case? How much higher do we go if we enter a secular bull?

We are currently up 135% from the trough. Leading up until the following peaks there were bigger rallies. 1906, 1987, 1929,1937,1966,2000. That’s it.

In other words, leading to the 1906 peak and 1937 peak were the only non secular bull market runs of this magnitude. Moves 100% but under 135% are the following starting with the least leading up to the peak 1932(minor peak from absolute bottom),1916,1946.

There are 6 other rallies in the 50-100% range that I recorded.


historical run


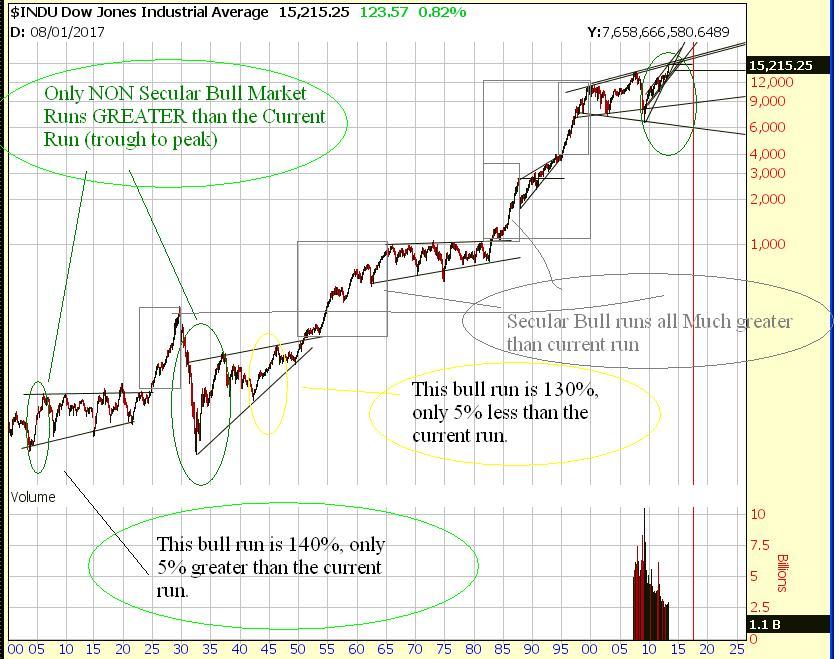
Secular bull markets As such in that sense the decline could be relatively “normal” at 50%

A secular Bull emerged from 1920-1929, OR Even 1908-1929

1920 low-1929 peak=64 to 358 =460% return  1908-1929 peak= 53 to 358 575% return

A secular bull emerged from 1942 into 1966 OR 1932-1966

1942 low to 1966 peak 92 to 1001.10 =990% return 1932 low – 1966 peak = 40.6 to 1001.10=2365% return

A secular bull emerged from 1982-2000 OR 1974-2000 Or 1974-1987

1982 low -2000 peak=1425% return. 1974 low – 2000 peak=1960% return. 1974 low – 1987 peak= 380% return

From “breakout” point (This has YET to happen)

1924-1929 104 to 386.1  A 271.25% Gain

1951-1966 235 to 1001.1 A 326% Gain

1983 to 2000 1100 to 11750.25 A 968.20% Gain

(ALTERNATE: 1983 to 1987 1100 to 2746.70 A 149.70% Gain)

(1995 to 2000 4000 to 11750.25 A 193.76% Gain)

Finally, we can look at Bull Market cycles within the sideways consolidation type of moves between the major secular bull markets.

1930 52%
1972 66%
1919 68%
1976 80%
1909 90%
2007 97%
1932 100%
1916 107%
1946 130%
1906 141%
1937 294%
   
1987 150%
2013 135%

I put the current 2013 amount from trough at the bottom as it has yet to establish a peak and the 1987 amount separately as it is more of a secular run before a crash which continued and kind of in it’s own category.

For the time being I am not convinced one way or another whether this is a major secular run just in it’s infant stages, or a sideways consolidation in it’s “mature” phases.

Until we clearly break the broadening pattern, I am starting to get increasingly cautious heading near the edges of the aforementioned pattern.

As mentioned before, I am getting bullish the dollar as a hedge to allow me to stay long. However, I am inclined to even start to reduce my long exposure more aggressively and/or go out and get some shorts and bearish bets should we cross into the 15500-16000 range. If we trade down it could be a vicious downtrend possibly even a 60-65% decline to new lower lows.

Comments »

Currency Shifting

currency shifting
The dollar on a weekly chart is in an ascending triangle and may breakout at some point. It is at a good spot above considerable support. The euro on the other hand is making a head and shoulders while the Yen remains in freefall mode starting another major leg down.

Looks as if the dollar is bullish from technical perspective. And that gives me a bit of caution on the market. Meanwhile a lot of individual stocks are still looking bullish.

The conclusion? As you take profits from winning gains in stocks, consider using the dollar to hedge. I have been doing so and now with today’s move it seems as if it may pay off.

p.s. Also be aware that the FXE (euro) is about to make a deathcross with further declines (10 week MA below 40 week MA).

fxe dc

Full disclosure: I am currently long the dollar and short the euro at the time of creating this post.

With gold likely staying put for awhile, I believe the best way to hedge is now by short dollar, or long euro. UUP calls and FXE puts is one way you can do it. I am looking for a move over the next few weeks. After that we may see if it’s just a quick breakdown or only the beginning.

Comments »

Longer Term View On Gold

Okay, with the “I Told You So’s” out of the way, it’s time to take a longer term look at $GOLD and explain some things so you might learn. Maybe you didn’t see this coming and weren’t prepared for the possibility, it’s okay. Experience can be gained so you can understand better next time.

Gold Monthly chart below.

pullbackGLD

Looks like we are simply correcting to the longer term trend. The 1250 area is about where we broke out of the price channel and went parabolic to the upside. Then we went into bear market territory from there. Formed a double top after over a year of no real progress and now we have broken down. Longer term trend remains intact on a monthly chart. However, we could pull back below 1000 at some point in the future and really flush everyone out claiming “broken trend” before it reverses.

The volume profile tells you where transactions take place. The price of ANYTHING is ONLY when the demands/requests of a buyer and seller meet. The high volume spikes occurring during certain prices is a sign that lots of buyers and sellers met there, and therefore, there is a market at those levels. Minimal volume areas or “volume pockets” mean there is not much of a market there, and prices likely will gravitate to an area where maximum transaction can take place. Should there be more buying demand than selling demand, the price will generally quickly gravitate to the next highest major “market-zone” If there are more selling demand than buying demand, the price will generally quickly gravitate to the next lowest major “market zone”.

That’s not to say transaction might not pick up somewhere near the area and that past buyers or sellers might quickly adjust NEAR that area, however in general it is simply fundamentals of supply and demand that drive price. Observation of past “markets” may not always tell you the future, but it provides a good understanding of what is likely in order to manage and understand the risks.

This is just one tool to add to the toolbook to determine when the given market is a “buy the dip” type of market or “sell the breakdown”.

I correctly identified that gold was a sell the breakdown market, and avoid buying the dip as it had no legs to stand on below it’s support level around the 1520-1570 range. This is not an “I told you so” but a “how I told you” for those wishing to learn that my call was not “magic”. Of course, if I sold you on that idea, it might be better marketing for some $2000 subscription or whatever, but I am not here to sell you anything.

You can see from the channel down support why I don’t have a problem with anyone buying the dip here. Channel trendline support in oversold conditions. I may speculate from time to time with some capital, but I prefer to wait until the longer term trend or longer term support indicates action before making any major changes.

Personally I have no plans to add a long term position in gold until we go below 1250, or unless some other setup occurs that convinces me otherwise.

I’m more interested in WHY this gold flushout is occurring now and what that means for everything else. This kind of forced liquidation can spillover into other markets. I think the Fly made a great point there and we certainly see at a minimum at least that occurring today.

The margin liquidation and forced selling in any market can cause a demand for cash. That demand may have to be met by raising cash from other markets. The other markets that are sold may trigger further downside pressure. Eventually there is an excess amount of cash on the side and those waiting to buy the blood strike with force, then the money on the side can then chase higher. When that happens though is anyone’s guess.

I also think that gold is not about inflation, but about currency alternatives free from government mismanagement of the money supply. When government’s ability to raise revenue and pay the bond holders, and/or fears of them inflating the currency (a side effect of gold going up with inflation not inflation being the cause), gold is the alternative.

A shift away from gold may be a signal that confidence is returning either into the Euro (I doubt it) or the Dollar (more likely) or some other government currency. Whatever caused smart money to move out of currency and into gold has moved into whatever currency they think is the strongest going forward. I suspect that is very bullish for the dollar. That probably goes well with a volatile market and/or a market decline as well.

These are likely to be very trying times ahead for people with a position (so everyone) as we can see early warnings of high volatility and major capital shifts. Bitcoins was just a microcosm of the overall market sentiment shifting. Then Gold followed. Gold is a major market. It isn’t anywhere near the debt markets, but what is? Anyways, It should be a wakeup call to those that think the stock market can’t do the same thing.

Having multiple asset classes and extra cash with a few short term speculative positions as well as long term positions is a great way to diversify over multiple timeframes and multiple asset classes. Someone long gold from $800 who holds through the storm and rides this all out and doesn’t sell may eventually in a few years come away very well just as the person who speculates and grabs some puts. Both may be right even if at a given moment the positions may be opposed. This is just one way to protect yourself even though at times you may have multiple long positions. But if you protect yourself right, you profit.


Comments »

Yellow Metal Off a Cliff – I Told You This Might Happen

In my Post I warned you of Gold’s demise that is happening.

Quote:”…which is why we must watch the 1520 level or so in gold, if that gives way, there is a lot of danger below.”

The warning was a warning of a lack of support. Meaning if it fell, we would go down quickly. But even I was surprised by how quickly it occurred.

Fortunate are those who heeded my warnings.

Well, I also warned about 2 levels of support below that it would test quickly. Both of them had a lot of high volume in those areas making them a prime candidate for support/resistance zones.

The first being somewhere around the 1400 area. Yes, we are there. Stay tuned, this may hold. However, if it does not, we do have another volume pocket/GAP to the next level

The next is $1200. I expect this to hold. Finally just above $950, should this be gold Armageddon.

Gold is a market like many other commodities. Forced liquidation can happen.

If you have puts I hope you would take profits sometime today. But I think this is good news for the gold market long term. The weak longs must be shook out for bull market to resume. Sometimes that shakeout must be very violent such as the ’87 crash being the most extreme example.

No I am not some hypocrite like I was long Bitcoins and now I am saying face after a 75% decline by saying it’s a “shakeout for crybabies” like the Norm McDonald sounding character, Max(imum) “boom boom” Keiser. I am not a permabull or bear in anything. Markets always rotate and never go straight up forever. I got this exactly right. The structural damage is indeed severe, but right now I look at this as nothing more than a panic. While bitcoins will be shut down by the government someday, and gold can be seized by the government (along with your Cyprus bank accounts), Gold at least represents an international medium of exchange that can be used. If the government mismanages the money supply, globally currencies may shift. The fundamentals behind gold are no different. Nor were they when gold declined from 1980 until 2000 by something like 90% adjusted for inflation. In my view, you must understand where money is moving and WHETHER OR NOT THERE ARE/WILL BE BUYERS at a given level to be able to accurately measure risk and reward.

I am not trying to call the bottom right here, but I applaud the people bold enough to step in and do so. It certainly is a very oversold market right now. There is certainly support around these levels as well, it’s the levels below I am concerned about.

Right now the risks are pretty neutral in terms of about a $200 volume pocket upwards and downwards. The momentum is down but we are oversold. However, as we decline as I write, that is becoming more favorable to the upside. If you want to tell me you can predict where it goes next be my guest.

I personally sold the last of my GLD puts here with /GC at 1365. Good luck to those who still have a position either way.

Comments »