iBankCoin
Home / options

options

Trading System: Cliff Notes

Rules:

1)Own no more than 20 *active* option positions

2)Own no more than 40 option positions total.

3)1% position size per option with 5 possible exceptions.

4)Those 5 exceptions may all be 2%. max 2 may be 3% and max 1 may be 4% positions.

5)Target max 50% of stock positions ~5 positions of 10% or less.

6)10% income position that is always on except sold to avoid margin.

7)Remaining capital with 1-5% in asset allocation options. (commodities, currency/cash, stocks/short VXX, bonds/income) plus possible 2% hedge.

8)Only take a trade where reward is 3 times the risk or more.

9)Monitor breadth to add more when it’s oversold or when it makes a strong breadth thrust off of oversold, add normally when it’s not overbought, and add proportional to rate of selling or slower when it’s overbought or trending down from overbought (until oversold signal).

*A position that falls 75% below it’s original value you basically write off as a loss.

Watchlist:

-Watchlist is developed through OABOT’s top 400 and manually filtered from there to usually 20-60 names.

-Import watchlist into a spreadsheet with suggested stops and targets and current price

-Reward/risk will automatically update once it’s in the watchlist.

-Trading rules for entry that must follow the above portfolio rules and also an entry checklist which should also be using triggers.

Management:

1)As stocks are bought, input the stop, target, entry price into spreadsheet.

2)Since many of you are already trading, don’t worry about importing a large list of current holdings… just update the next trade until you phase out the old trades.

3)Stock must be below stop 5-10 minutes before trading close to trigger a sell.

4)Stock above target has a separate rules of waiting for the candle to close below prior candle low or failing to close above prior candle high Sell before the following candle’s close.

5)Which timeframe you use when stock is above target depends on condition but in general: With investments you may use monthly or weekly chart. With stock trades and options that have more than a week remaining til expiry you use daily chart. on options expiry week you might use a 1hr or 4hr chart. 1 day before options expiry you may use a 30 minute chart. On options expiry day you may use a 5m chart.

6)Generally update and check spreadsheet every hour. Also monitor watchlist stocks for purchase. On options expiry day check them every 10-15 minutes. One trick with that is if the stock is higher than the last time you checked, you don’t have to look at a chart.


Comments »

Equity Curve Of Risk – How Risk Influences Expecations

In the last post I discussed how I used a system and position sizing simulator to look at the ENDING equity of thousands of traders trading a theoretical system. I mentioned I would be showing sample equity curves at a given amount of risk by pulling up a random trader. It’s a lot easier on the spreadsheet to get a better sense as you can just press the F9 key to recalculate the random iterations and thus instantly bring up an entirely new random equity curve with all the same settings. You can go through several examples in a short amount of time. It is a bit more time consuming to create new JPEG images of each of them and then post them here so I will only be showing a few.

To further illustrate the type of “risk” you are taking by a particular strategy I provide just one random “trader’s” equity curve of each of them. Understand that results may not be entirely typical but pay attention to the % drawdowns to get a broad sense of the type of risk you may look at and endure.

Please note: The actual expectations of the system you use will drastically impact the type of volatility you see with every 1% change in risk. These sample equity curves are only made with the trading system with an expectation of a 20% chance of each of a 50% loss, 50% gain, no change, 100% loss and 150% gain.

1% risk

1p risk

2% risk

2p risk

5% risk

5p risk

As you increase risk, the results become more polarized and more extreme, so I will provide a few examples for those at the supposed “optimal” risk percentage of 14% risk

14d2 14d 14.2 14

The phenomenal results of a few skew the results of the rest. The drawdowns are insane as you see 70% and 80% drawdowns.

Can you stand 80 trades of being down steadily as your account drives lower to HALF of what it started with? Most people can not and would capitulate so even putting 5% of your capital into this “system” becomes problematic. Granted multiple bets with a lower correlation that adds up to 5% or even more may be actually “lower risk” than 5%. Granted, you can potentially use strategies that actually profit from market overall volatility such as allocation models and rebalancing and modern portfolio theory and hedging and pairs trades and such, you can put in some income and weight a lot of your portfolio with stock that have more of a slow and steady drift upwards that 70% of the time actually provides more stability and increased liquidity that can comba the negative effects of account volatility. Granted, a MORE profitable system can allow you to risk quite a bit more without the same drawdown expectations…. But even so, we are talking about a winning system where even at 1/3rd of what some quants would suggest to be “optimal” over a finite amount of time the returns are very likely to be terrible over a significant period of time.

Can you see why long term capital management went bust now as they did not test their assumptions while taking only a small sliver of time in the past by which to evaluate their “expected risk”?

I could get into how uncertain the world is and how your estimated “edge” within a system is also not a certainty which is still an assumption that this model must make to provide results, but at least can be recalculated with different sets of expectations. But I hope that this post has been educational enough for you to make at a minimum slight, productive adjustments to your way of thinking, if nothing else.

Don’t blow up like LTCM… Test all of even your most basic assumptions… Evaluate your risk in as many ways as you can. Understand risk and how to manage it. Control your destiny rather than being a victim of your own emotional compulsions to sell at the worst point of time and capitulate just before your system takes off because your system is too volatile. Understand the dynamic nature of reality and how increasingly large leverage and risk may be increasingly more volatile while also being more vulnerable to small changes in the conditions by which you based your assumptions. Understand the need to be well capitalized and that fees aren’t factored in and more negatively impact the volatile systems that have an increased probability of drawing down significantly from the starting point. Constantly seek to let the facts guide your conclusions, and seek productive improvement on the way you look at things. Then risk can serve you, rather than you “getting Serrrrrrved” by risk.


Comments »

hattery buy ERX calls

BOT ERX APR calls. It has strong support with it resting near it’s strongest price level of support measured by volume profile, with it’s weakest resistance above with a big volume pocket should things heat up. Individually, there are a few bearish looking chart patterns in energy. Those who wish to hedge may look at a BP put.

Since I am buying AT support… If we aren’t higher by  end of day Thursday, I will probably sell on Monday(no trading Friday).

Good job for those that followed along with the SLV trade. Comments timestamped.

Since the method I have discussed looks to reduce positions into oversold conditions, In order to keep up with returns of a roaring bull market that we have been in, occasionally I will make a few option trades with a small portion of the portfolio.

I’ve read the following stats:

* In hyperinflations (rises of some hundreds of percentage points each year) no one is able to beat buy-and-hold for a year or longer.
* In monster bull markets (annual advances of 25-50%) less than 1% of the market participants beat buy-and-hold.
* In powerful bull markets (annual rises about +20%) only about 1-3% of all market timers beat buy-and-hold.
* In average bull markets (annual rise about +15%) about 3-5% of all market participants are able to beat buy-and-hold
* In weak bull markets (annual advance about +10%) about 10% of all market participants are able to beat buy-and-hold.
* In sideways markets (+/- 5% per year) 20-50% of all market participants are able to beat buy-and-hold.
* In bear markets (losses of 10-20% or more per year) 80% or more of all market participants beat buy-and-hold.

I believe “market timers” refers to those that hold a % of cash trying to pick the top.

So this is why I felt that I must amend the strategy a bit. If the vix drops below a level, (say 20), I think it’s time to use a bit of capital in leveraged options when the timing is right to make sure we can make an effort to keep up with the market. Particularly when the M&A arbitrage premium has gotten squeezed out much more than it has before. It makes a bit more sense to me to try to play commodity related names like silver and gold, and perhaps other names that have a more mild correlation. If we are able to merely break even in strong bull markets with less cash once oversold, it is a win since we will have more cash and be able to more aggressively buy the oversold conditions
Although we certainly could hold here in Gold and Silver, the precious metals market is very vulnerable right now and so I am going to refrain from buying the dip in precious metals and may even go so far as to selling a bounce in gold from 1630 up to 1645. We appear to potentially have broken longer term trend-line support in gold, depending on how strictly you draw your line. With a forgiving trend-line, we still hold above 1600. Volume pocket below.

Gold remains bullish over the long term (measured in years). It may be biding it’s time before a longer term move up over the next few years, but give it some time as for now it is neutral to bearish over the intermediate term(measured in month), even though it could swing higher here (measured in days). I would say Gold will trend lower in April and perhaps find support in May, and perhaps retest the breakdown in June.

Comments »

Hi, Ho Silver! Buy Alert, SLV Weeklys and APR expiration

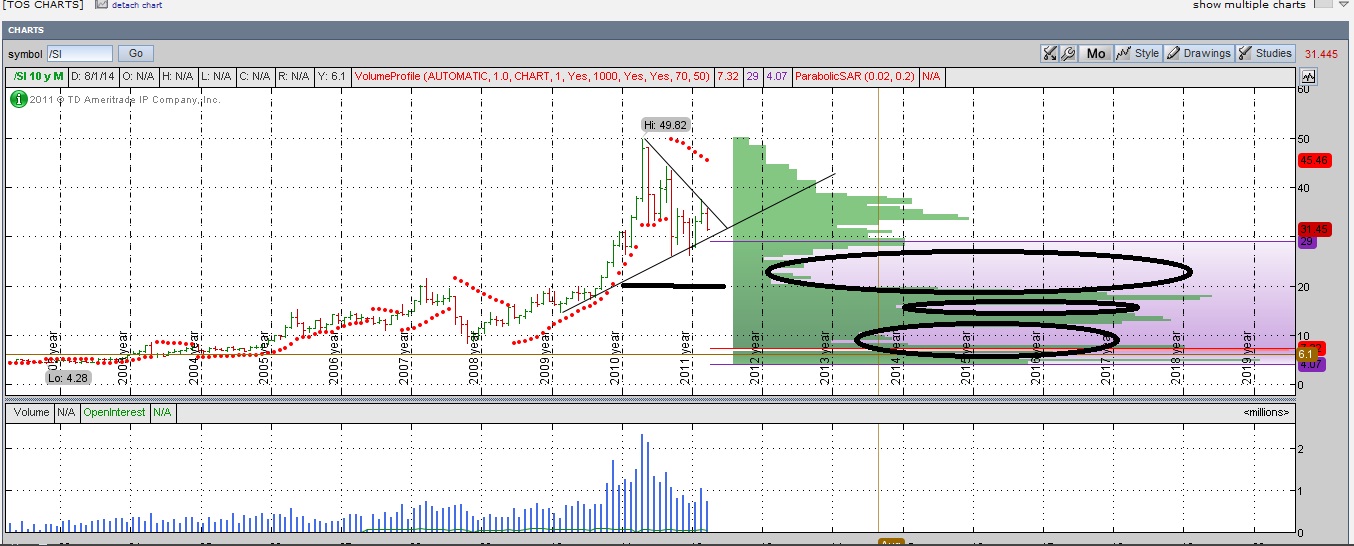
Silver dipped below 31.50 so I bought calls because I feel it is on the verge of doing something soon. A long term chart shows silver coiled up here. Since it is a long term pattern a daily close below support would not be that significant, but a monthly close would be. As we approach the end of the month, I decided to play the dip by buying in anticipation of a bounce.

Do not confuse this with a long term play as below support there lurks danger.

1)I think bulls will defend this month and try to keep gold above 30.50. If they defend successfully, we could rally strongly here.

2)If they fail to defend (as it looks like we are headed for if we do not get a change in trend) I suspect they still attempt a short lived rally right here or in a day or two before we trade lower to close out the month. The downside move in the short term, likely has played out or is close to it (unless we are on the verge of a long er term breakdown.).

3)Worst case scenario for weekly calls is we dip below 30.50 and rally to close the day just above it to give a signal that we will likely see new highs in the future or near it to give really a lack of a clear signal.

4)I bought calls instead of SLV because I feel that we potentially could crash very hard in a very short amount of time if/when we breakdown and I wanted to limit exposure. A lot of the buyers that want to buy for the time being have done so leading up until the peak (and the peak of gold)

5)In hindsight, I am having buyers remorse a bit. Not that I regret buying but I bought weekly calls in addition to april calls. I should have probably only bought the APR calls because then I still have enough time left come first trading day of April to determine if the bulls defended successfully or not, and to get out of the trade with still some premium, and I can still sell a short term bounce if I nail the bottom here. APR calls probably offer the most flexibility. If you are after stability per dollar risked, you need to buy longer term calls s there always is a healthy time premium if trade goes against you. This way, your percentage loss is less, even though your percentage gain is limited. I am not aggressively loading up on calls here, just a few extra calls beyond what I would have to replace the underlying if I were to buy SLV here.

I will reevaluate come April 1st for potentially rolling options to a longer term hold, or playing the downside with longer term puts.

A little bit backwards technical analysis is done here as the downside target was  around 31.50-32 in silver and we are at these levels and typically that is a signal to get out of any bearish bet. I did use some GLD and SLV puts as a hedge but I took off the trade earlier this week. Bulkowski’s research (in his book Encyclopedia of Chart Patterns
) on technical analysis gave me an interesting idea of flipping it on it’s head. A lot of stocks might breakdown an average of 20% with a particular pattern but then they on average, once the trend reverse I believe every pattern would end up higher than the breakdown point. So either accumulating a position as it breaks down or buying if it reaches the downside target actually MAY be a good decision, although it generally lacks the clear need of support and where to sell making it difficult to manage. So I rarely plan on doing this, but the move is coiled up and near support so it is manageable and makes sense to me. I also like the idea of buying a business or commodity at a LOWER price as a result of technical analysis even for a dip buy, but the clear problem in many cases is management of the trade.

Personally, in the grand scheme of things I prefer a monthly close below 30.50. The reason is, a breakdown lasting until most of 2012  (August is est. time frame for end of the move with possibility it spills over into early 2013 not outside the range of possibilities) would be excellent for managing my trades. Even though I am hoping for a dip in stocks before I get too aggressive with my cash hoard, with the VIX low I am content to place a small amount of capital in options and play the upside. But while doing so, I feel exposed, and if I could hedge with some SLV or GLD puts every now and then it would allow me to get more aggressive. Additionally, I feel a strong correction in 2012 will be helpful as it will flush a lot of buyers out, work off the overbought levels and set the stage for a run up in gold over the next several years, because nations around the world are in trouble and all the money in bonds has to go somewhere, especially when every bond printed is also a dollar that pays interest and accumulates more debt as a result. The higher interest rates will result in higher debt payments when the DEBT is rolled. FYI Spain and Portugal will roll their debt in 2012 here. It is not just Europe, but JAPAN has a very poor debt to GDP scenario as well and the US has lots of unfunded liabilities, although debt to GDP is not as bad as other parts of the world. I don’t know who started the idea that higher interest rates were “bearish”. This is sometimes true perhaps, but when Japan has lowered interest rates for decades as their stock market declined, or the lowering interest rates during 1929-1932 (yes they hiked it at one point then immediately started easing. Whitney Tilson and others have shown that stocks tend to be more bullish with rising interest rates. Robert Prechter, and others showed how major depressions and declines happened during periods of falling interest rates. Rising interest rates means MONEY is in demand and people are willing to pay up for it, and are not willing to  accept low yields with money on sidelines while there are so many other places to put the money.

Well I am getting off on a tangent now like I do too easily, but for now there is a ton of speculative excess still in gold and silver markets that could potentially be squeezed out even though a significant part of that move has happened. If we rocket higher from here instead, in the long run, I think silver and gold will top out sooner, and crash harder for longer, and be less predictable. A healthy correction would be favorable in my opinion. I may be getting a tad overzealous here and it may be more prudent to wait until April 2nd to place a trade in precious metals when we know whether or not we hold monthly support here around 30.50


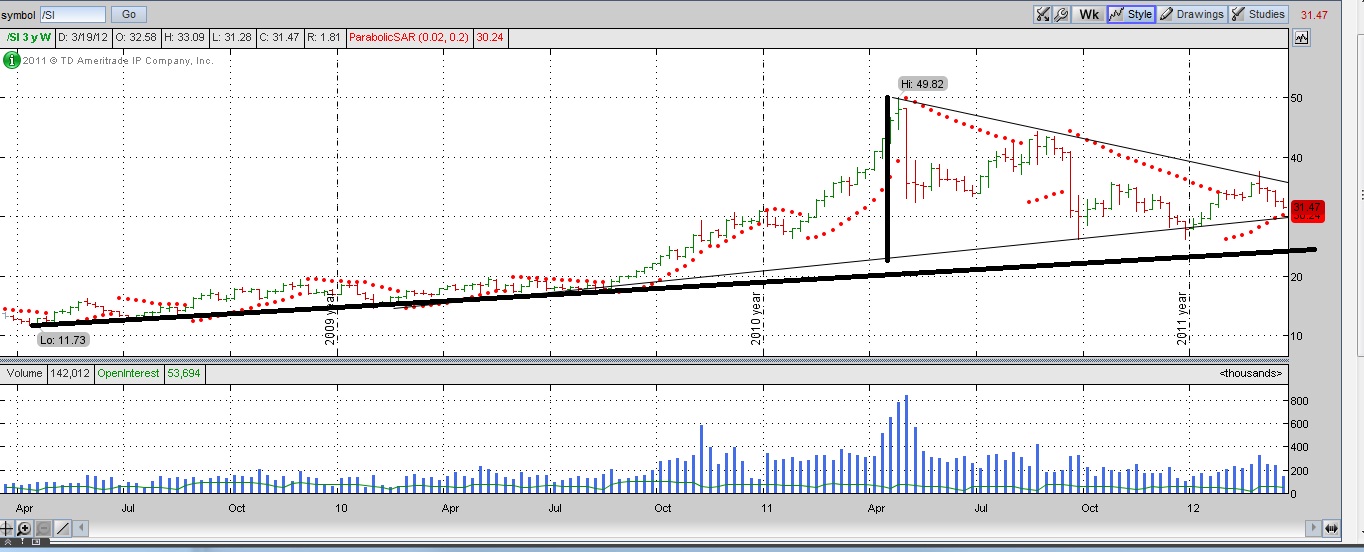
If we break down, the initial breakdown of the longer term chart gives a target is around 25. secondary target could even be as low as 15. but I suspect we will set up another pattern by then if we breakdown
If we hold, initial pattern doesn’t face resistance until nearly 35 with huge upside if we break resistance from there, which I suspect will happen (IF we hold the monthly level significantly above 30.50).
I would say this month is pretty much do or die for the bears on whether or not we will see a deeper, healthy correction this year.

Comments »