The last market to break above it’s very long term resistance on a trend channel was gold and it went parabolic. Before that it was maybe banks and real estate, but ultimately the big one was tech/biotech/the nasdaq.

A break above say 16,000 in the dow basically could either put dow into a secular bull or perhaps even “parabolic territory”. I just don’t see dow going parabolic. Basically, if the DOW went parabolic it isn’t exactly like we are talking “growth” names here. It is the DOW and it’s pushing the ranges where it might start moving like the tech bubble here. If it does, I will start to actually believe the crazy people talking about hyperinflation because that becomes at least a possibility with those types of moves. Otherwise, it could just be capital everywhere around the world fleeing bonds, gold and all assets to get into stocks probably the most likely. Even so, the idea of the market going parabolic to new extreme highs over the next few years just doesn’t seem right to me. Such a large percentage of the world’s capital is held in the US already that expecting a repeat of the 1980-2000 style run for any other reason seems somewhat farfetched, but not as much as hyperinflation in an economy that is the world reserve currency.
So as the title suggests, at some point, something has to give.
Now we have to try to identify WHEN and what price.
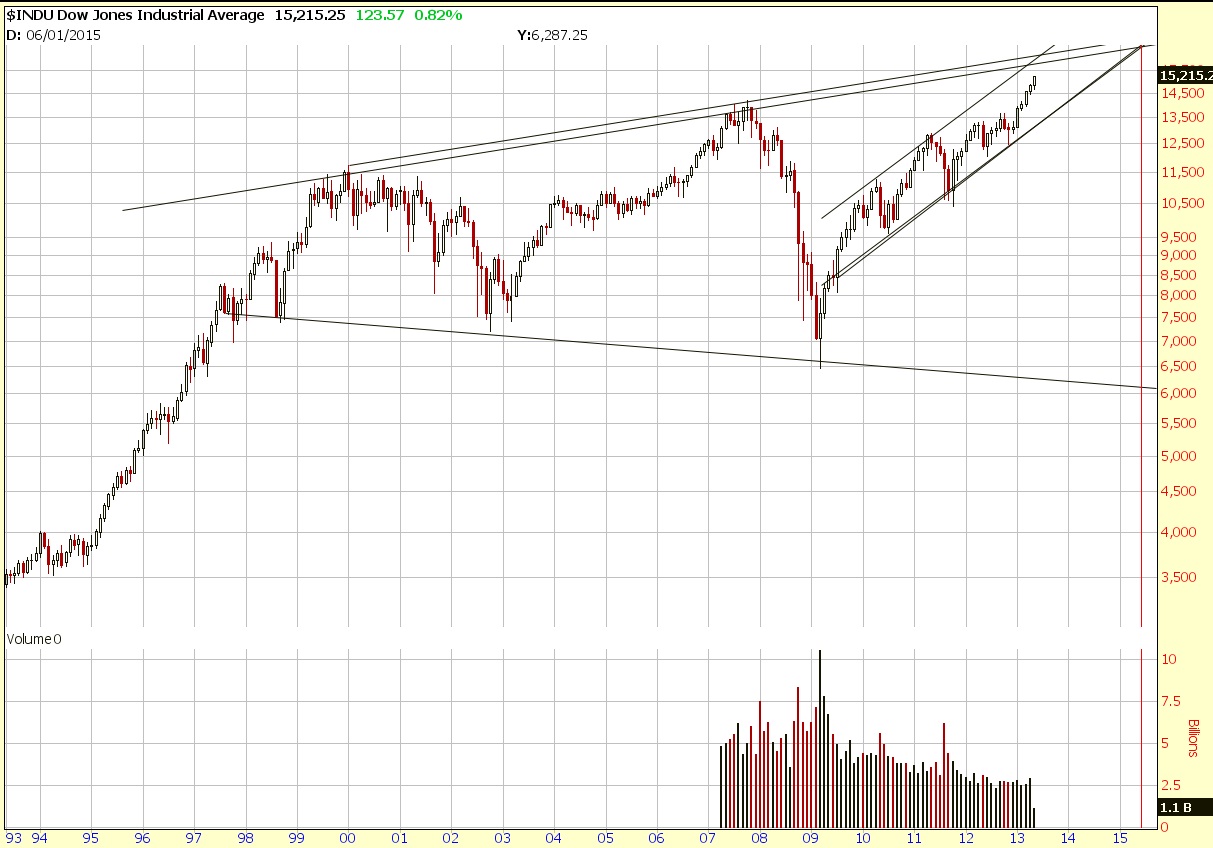
I believe we are in a broadening pattern on the very long term chart. I still remain open to the possibility of a long term secular bull market, and it’s possible a breakout would be all that is. However, if it happens I just think we still will make a higher low before we just go ripping through resistance.
Finding a reference point for markets making all time highs is not easy at all time highs so I had to go to the 20 year chart.
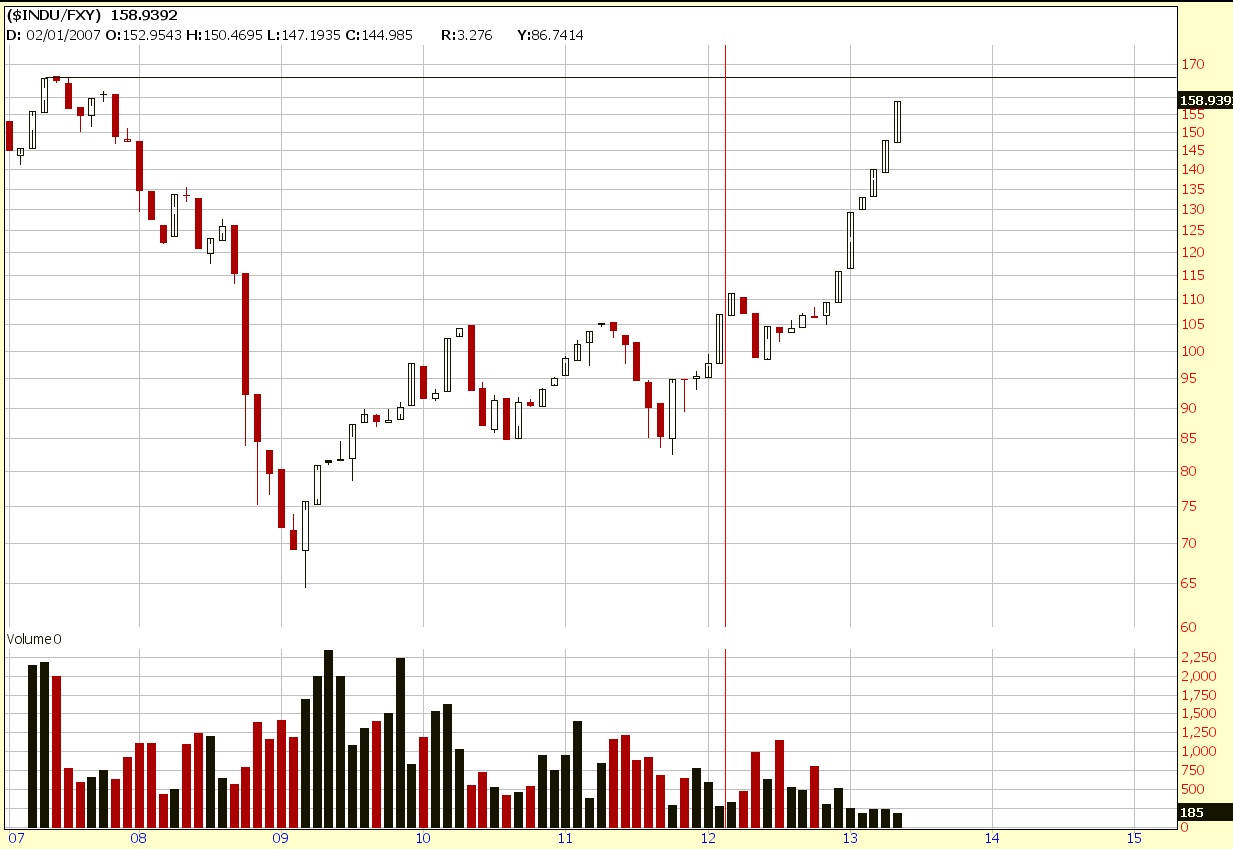
The only other way I could come up with a reference point was the dow to yen chart, which shows we still have not hit all time highs priced in YEN. So it’s possible the capital shifts have reached it’s extremes once we touch the previous high level of 2007.
There are plenty of instances when market was in a sideways range for quite some time before it made the major secular bull run type of move.
1)early 1900s Before roaring 1920s bull market.
2)1931-1950 before the 1950-1965 Bull Market
3)1965-mid 1980s before the 1980s and 1990s run interupted by the 1987 crash.
4)(late 1990s) 2000-???
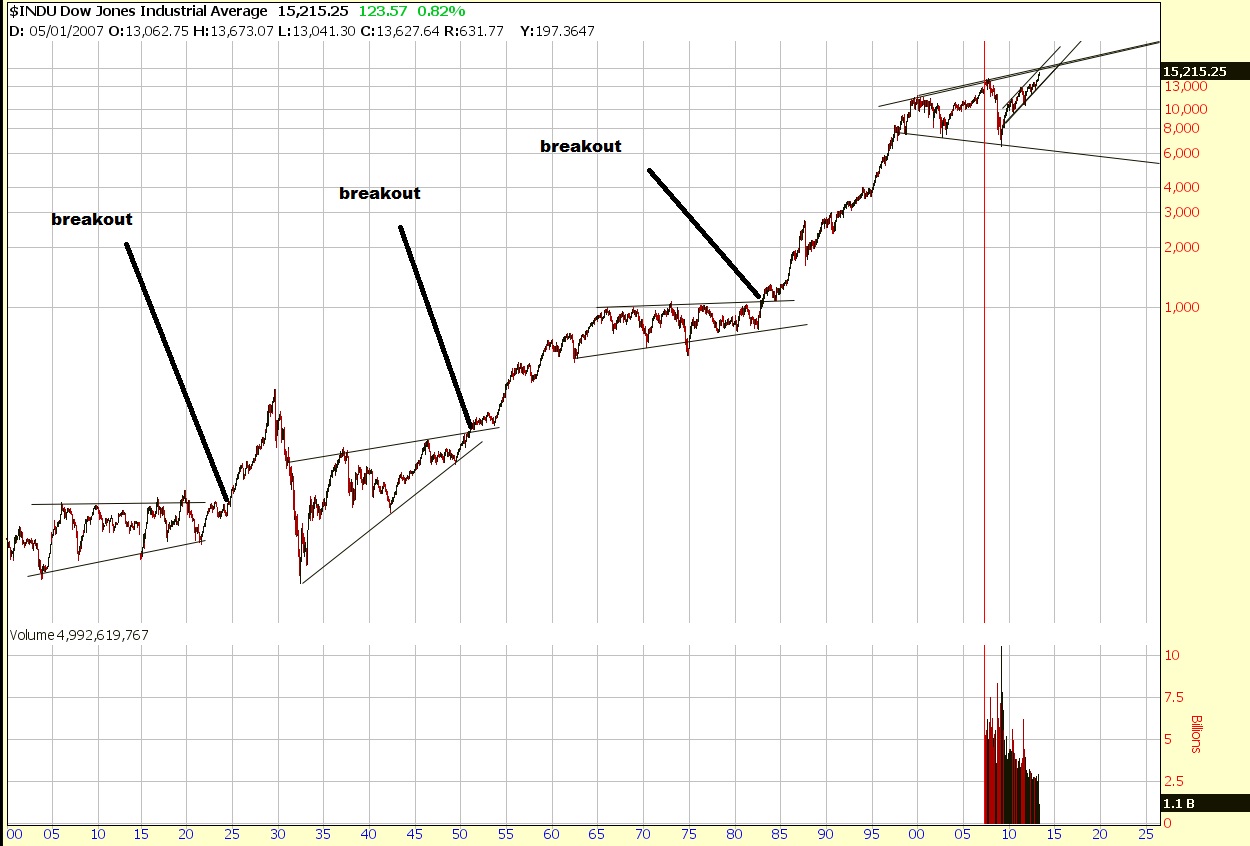
I think it’s a bit premature to start calling for a secular bull run although I will absolutely not dismiss that possibility.
Unfortunately what is concerning is that this pattern is not the same as the others, rather than ascending lows, we see lower lows. A broadening formation (we also still have an outside chance to form a long continuation diamond bottom or a diamond top) typically is a reversal pattern at least on the daily and weekly charts. If the market is fractal than even though we really have no history of such a pattern, it should still have relevance. However, it’s still possible for there to be broadening formation breakouts. Nevertheless, at least a pull back to 14500 after perhaps a run to 15800 is a strong possibility. If we are to go higher, the capital is going to have to come from the bond holders and from Europe.
Just working a bit on historical moves a bit. In historical context just how “frothy” is this rally at this point? And just how much of a pull back would be “normal”. In every instance of the sideways move there were very large moves higher AND lower within the consolidation.
The following are roughly the peak to trough declines rounded to nearest 5%
1901-1904 45% decline in dow.
1906-1907 50% decline in dow.
1909-1914 50% decline in dow.
1916-1917 40% decline in dow.
1919-1921 40% decline in dow.
*1929-1932 90% decline in the dow.*
1937-1942 50% decline.
1966-1970 40% decline.
1973-1974 45% decline.
**1976-1982 Stagflation… Inflation adjusted decline?
1987-1987 40% decline.
2000-2002 40% decline.
2007-2009 55% decline.
*Around the 1929 crash the dollar rose trough to peak by around 50%. I look at it as a 50% move on top of a 50% rise in the dollar rather than a 90% move.
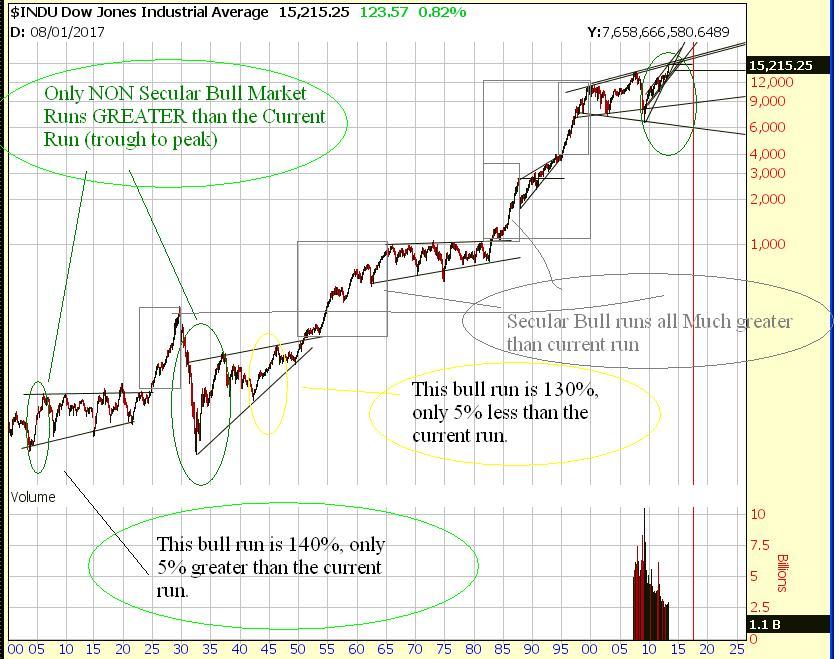
In terms of actual rallies there are two options. ONE is that we are entering a secular bull market, and the other that we are just nearing a top of a CYCLE. If it is a CYCLE top I think we see a “typical” 40% decline or so. Given the pattern it could be over 50% like 2008. But how much higher do we go before a pull back in that case? How much higher do we go if we enter a secular bull?
We are currently up 135% from the trough. Leading up until the following peaks there were bigger rallies. 1906, 1987, 1929,1937,1966,2000. That’s it.
In other words, leading to the 1906 peak and 1937 peak were the only non secular bull market runs of this magnitude. Moves 100% but under 135% are the following starting with the least leading up to the peak 1932(minor peak from absolute bottom),1916,1946.
There are 6 other rallies in the 50-100% range that I recorded.
Secular bull markets As such in that sense the decline could be relatively “normal” at 50%
A secular Bull emerged from 1920-1929, OR Even 1908-1929
1920 low-1929 peak=64 to 358 =460% return 1908-1929 peak= 53 to 358 575% return
A secular bull emerged from 1942 into 1966 OR 1932-1966
1942 low to 1966 peak 92 to 1001.10 =990% return 1932 low – 1966 peak = 40.6 to 1001.10=2365% return
A secular bull emerged from 1982-2000 OR 1974-2000 Or 1974-1987
1982 low -2000 peak=1425% return. 1974 low – 2000 peak=1960% return. 1974 low – 1987 peak= 380% return
From “breakout” point (This has YET to happen)
1924-1929 104 to 386.1 A 271.25% Gain
1951-1966 235 to 1001.1 A 326% Gain
1983 to 2000 1100 to 11750.25 A 968.20% Gain
(ALTERNATE: 1983 to 1987 1100 to 2746.70 A 149.70% Gain)
(1995 to 2000 4000 to 11750.25 A 193.76% Gain)
Finally, we can look at Bull Market cycles within the sideways consolidation type of moves between the major secular bull markets.
| 1930 | 52% |
| 1972 | 66% |
| 1919 | 68% |
| 1976 | 80% |
| 1909 | 90% |
| 2007 | 97% |
| 1932 | 100% |
| 1916 | 107% |
| 1946 | 130% |
| 1906 | 141% |
| 1937 | 294% |
| 1987 | 150% |
| 2013 | 135% |
I put the current 2013 amount from trough at the bottom as it has yet to establish a peak and the 1987 amount separately as it is more of a secular run before a crash which continued and kind of in it’s own category.
For the time being I am not convinced one way or another whether this is a major secular run just in it’s infant stages, or a sideways consolidation in it’s “mature” phases.
Until we clearly break the broadening pattern, I am starting to get increasingly cautious heading near the edges of the aforementioned pattern.
As mentioned before, I am getting bullish the dollar as a hedge to allow me to stay long. However, I am inclined to even start to reduce my long exposure more aggressively and/or go out and get some shorts and bearish bets should we cross into the 15500-16000 range. If we trade down it could be a vicious downtrend possibly even a 60-65% decline to new lower lows.
If you enjoy the content at iBankCoin, please follow us on Twitter


Excellent work, thank you for taking the time to write this.
Thanks for reading. I was going to do the research myself anyways, so might as well share it.
Secular bull brewing. Investor sentiment says it all.
Love this piece. Well done.