iBankCoin
Home / Trend Following Strategy

Trend Following Strategy

‘Tis the seasonals

There are various themes that can put the “wind at your sail” so to speak.
There’s fundamentals suggesting a stock worth more than the price.
There’s technicals suggesting a good setup to manage risk and also an increased likelihood of a big directional move in your favor.
There’s the general business cycle timing and the sector rotation into specific areas that go with it.
Then there’s the broad view of the sector setting up with the fundamentals and technicals (in the right part of the cycle)
And then there are seasonals for the sector as well as the individual security.

Tech sector rotation
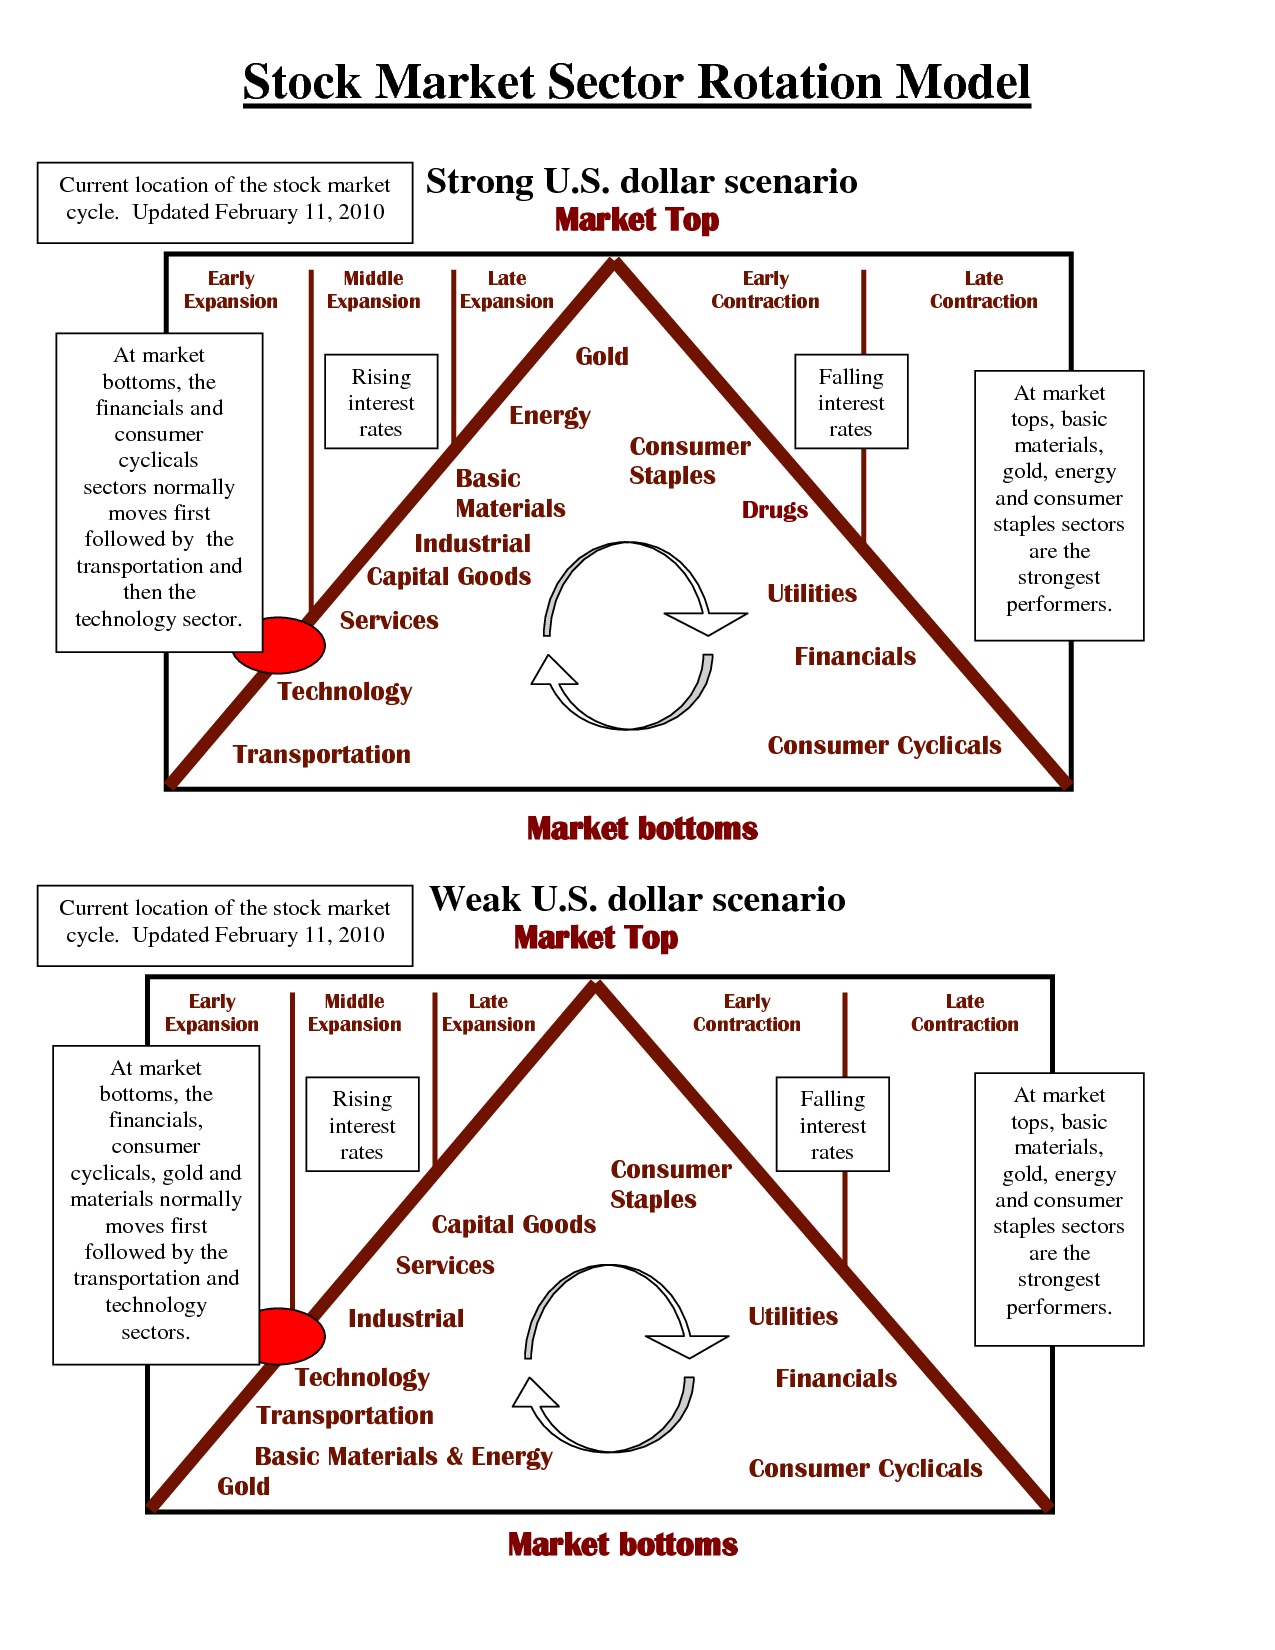
rotation2
Tech Seasonal

Not great, but offers a reasonable window for a nice swing into the July spike plus after the dip still swings up again into August offering a nice uptrend
ALTR seasonal
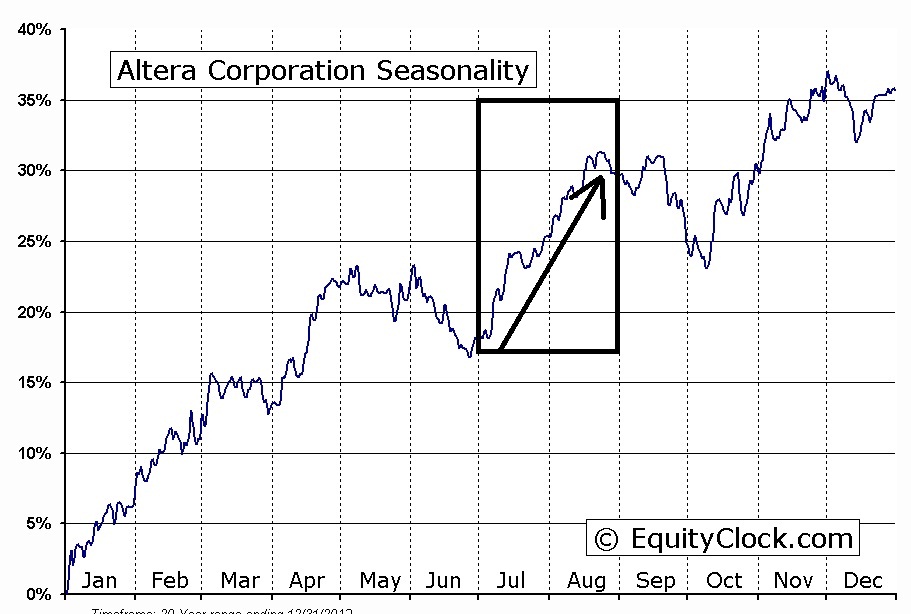
altr

Tech sector fundamentals
ALTR fundamentals

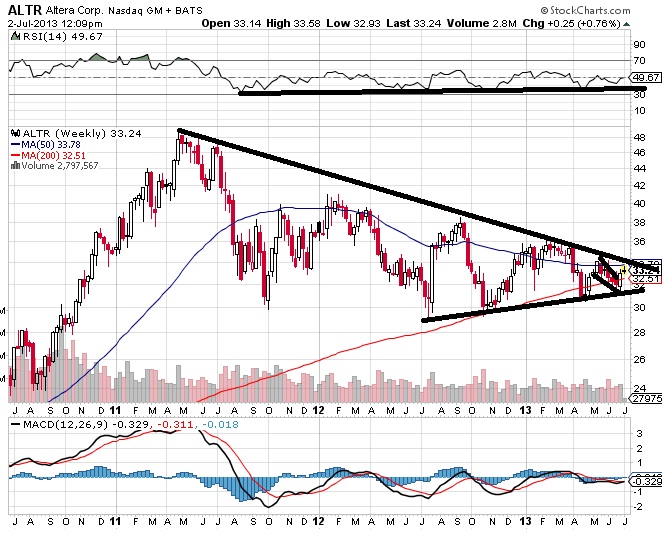
ALTR technicalsaltr1

altr2

The consolidation was all on lower volume, the pattern has tightened up considerably, the RSI made higher lows.You could wait for a breakout, but I prefer to anticipate the breakout and the seasonal is just one of those things that can help boost your edge.


I am long ALTR.

This is just as much an individual stock pick as well as it showcases how you might be able to increase your chances or maybe avoid a few names you would normally trade if there is “wind in your face”. You don’t want to “go against the grain” if you can help it. If perhaps it’s only moderately bullish or bearish in one of the areas like seasonals or technicals or fundamentals,etc but the rest of them line up fine then it should not be too much of a concern. But if the seasonal is telling you the market should decline sharply and the technicals can be interpreted more than one way, you may want to rethink it.

Seasonals are more used to help me keep on the lookout, and give me a better picture of if I want to ride the breakout for a larger trend, or just take my profits and plan the trade to just get a quick bounce.

You certainly can play them based upon the strongest month where the move is dramatic. Or you can look for a “low” or just a multi-month trend in your favor.

In this particular trade I may try to anticipate a breakout a few times and maybe trade the pullbacks a few times but as we approach mid-late August  I may begin to look elsewhere.

Aapl was an example of a strong seasonal play. I was watching Aapl looking to catch a bottom.

I really got “caught looking” on this one, but by now most of you are probably aware of the great upside potential in apple for a good trade to $500 mentioned by optionaddict.

If I was aware of this site charts.equityclock.com earlier, I may have seen that the bottom could have been near. I would see that it was offering a great upside trade according to the seasonals. I believed a price under $400 offered a reasonable entry, but felt the way the stock had been behaving that there wasn’t too much of a need to rush. I believe I may have had more of a sense of urgency as the seasonal suggested a dramatic move higher over the next 2 months. One could easily argue that the pattern is broken and it won’t see new highs and perhaps they’re right, but a seasonal rush in July-August and maybe September at least could potentially offer a great move to $500 before it goes lower or chops sideways.

You also may have had a chance to notice the pattern that was forming in WPRT and in determining if it will breakout or fail have seen the seasonal that mid June to mid-late July there is a monster run up seasonally.

That supports the likelihood of a breakout. You could have made a case that it should have happened in May-June. The weekly chart showed this stock coiled up tight for weeks similar to ALTR. However, it doesn’t automatically go up just because seasonals are strong. At times it may diverge, at other times, it will wait and then play catch up later. It merely provides supporting evidence to your perceived technical setup to allow you to be a bit more anticipatory and have a timeframe for the trade. Even though it didn’t go May-June, the trend lasts until Mid July, suggesting you may want to be willing to hang in for more time, or have sold early June and re entered on the June dip.

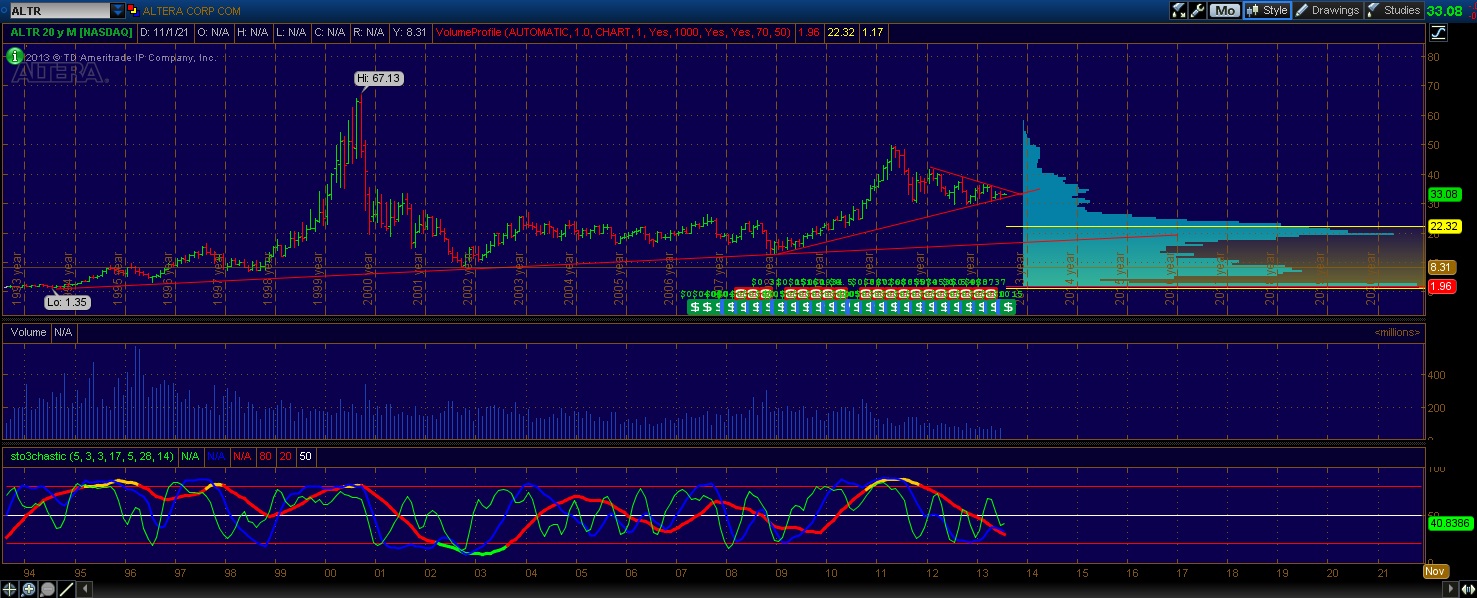
The volume pocket above, and/or technical setup, PLUS strong seasonals, PLUS a nearby spot to manage your risk is just one of those extra things that may be able to boost your win percentage and be enough to convince you to get long when you should often enough and keep you more patient when the seasonals go against you to get you slightly better timing. Just because a volume pocket exists doesn’t mean the stock enters it, it doesn’t mean it has a strong chance of entering it. Instead it means if it does, it offers tremendous upside potential to “fill” the volume pocket quickly.

I will have more on volume pockets in a bit going over various examples and show you what they looked at before and after they filled.

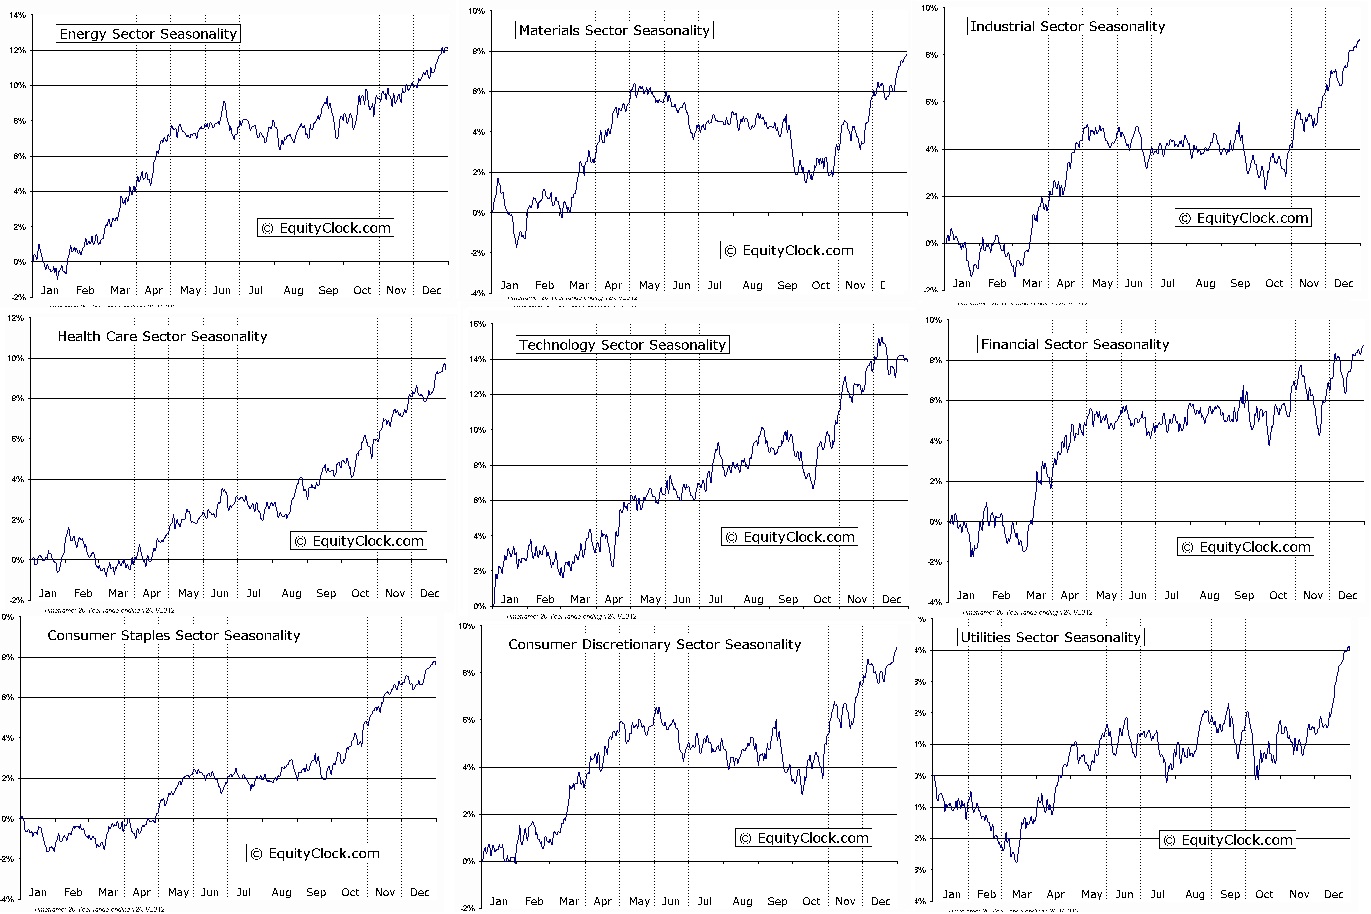
For now just consider adding seasonal charts to your arsenal. Here’s a quick view of sectors I compiled which is a great starting point for building a watchlist in the sector that sets up properly for a low or prior to a large move after a big sideways period of time.

rotation equityclock seasonal sectors1

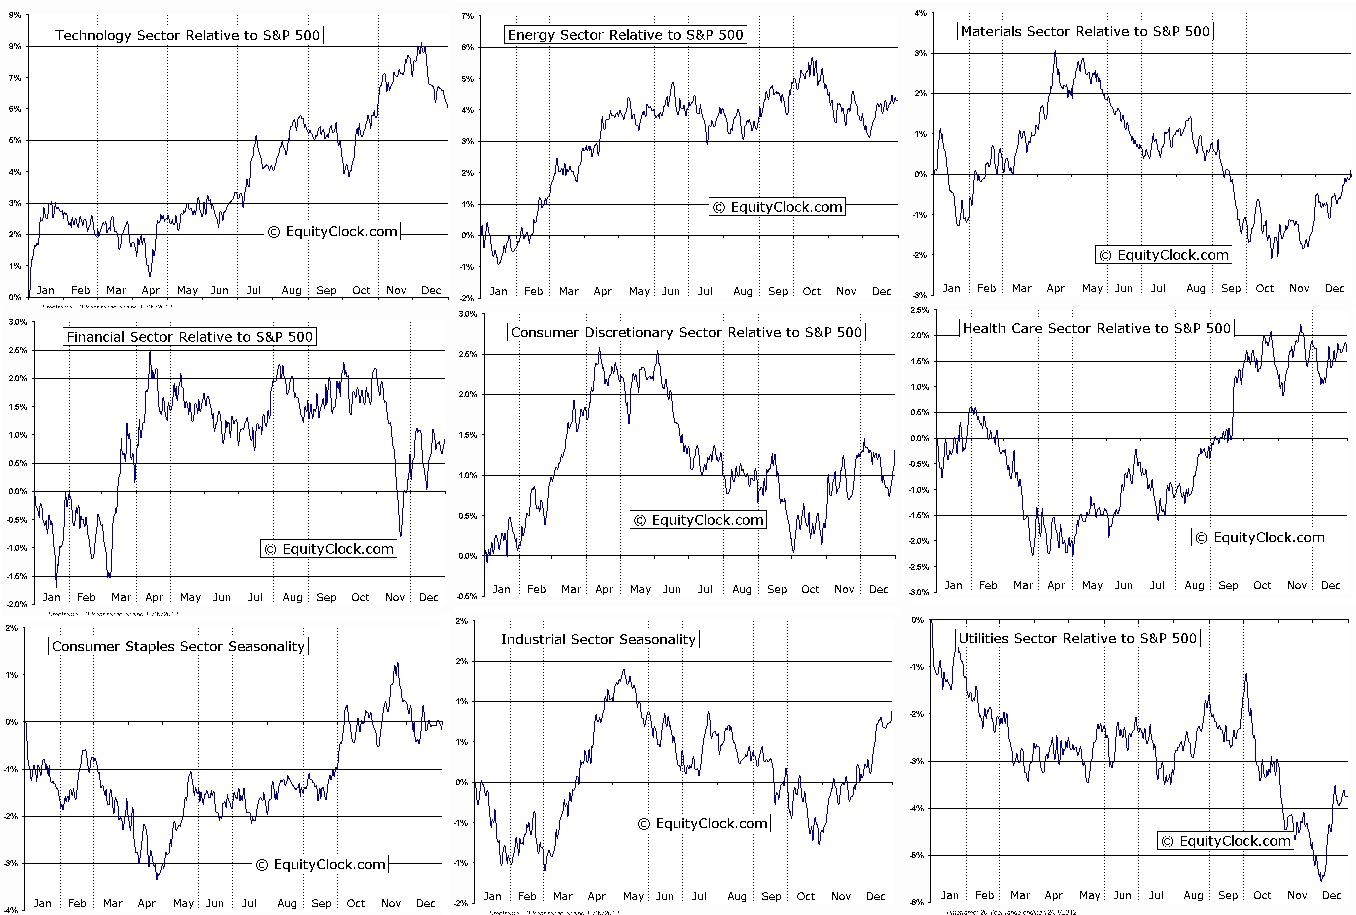
You also may prefer to look at the charts based upon their expected “outperformance” vs the S&P instead.

rotation equityclock relative outperformance

Comments »

Trend Following Strategy Using Sound Money Management Principals

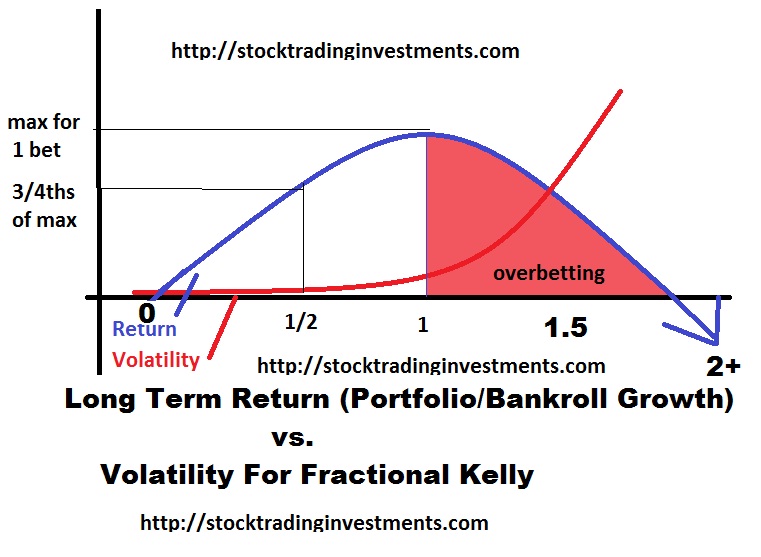
I’ve decided to keep this blog on ibankcoin specific to trends. To keep this blog on topic I made a post at stocktradinginvestments.com titled Kelly Criterion Shows Decreased Correlation Increase Return. The short version is the picture worth a thousand words.
Kelly-Criterion

Reducing correlation (and thus increasing your independence of your bets) is important because you can reduce your draw-down, or increase leverage in multiple uncorrelated names and keep the same draw-down with higher long term returns. If you lose 20% you need 25% gain to make up for it, but if you are invested in uncorrelated assets, a 20% loss will be much smaller as your overall portfolio, even if you have multiple uncorrelated bets with leverage. That is the idea.

What’s this all have to do with trend following?

As great as it would be to go “all in” in the best possible area and get every single call right, that isn’t realistic.
This is why I propose you set minimum holdings for risk on assets (stocks,natural resources&commodities,etc) and minimum for risk off assets (currencies&cash, bonds,). But also consider other lowly correlated opportunities. Depending on the trend, you would adjust your weightings, but not necessarily neglect opportunities if it keeps your portfolio’s correlation low.

When stocks go down when you expect them to go up, if you are 100% invested in stocks you not only are down in your position, but you also lose in opportunity to rebalance at lower prices, and in some extremes even change your allocation to be more aggressive. There is a fine balance between trend following and value investing. Value investing principals would suggest that if you are bullish if a stock is at $100 you should be more bullish if a stock is at $90. Trend following is often, but not always, in conflict with this, especially in individual names vs indices. This means you have to be positioned within a trend both to take advantage of the directional move, and also to take advantage of fluctuations in prices away from the trend (contra-trend moves), and to position more heavily if the signals are stronger. But unless you are 100% certain or the move severely outweighs the downside of it going against you, you do not want to be 100% in any asset class. Additionally because daily and weekly volatility (noise) exists within a monthly trend, it still may be right to have some funds you can transfer, despite also being “right” about trend direction since we still may have opportunities to add stocks lower in a monthly uptrend, or add to TLT or “risk off” trade at a lower price in a monthly downtrend (downtrend in equities, that is). For this reason we set parameters.

So we set parameters of maybe 75% maximum and 25% minimum for both risk off (bonds) and risk on (stocks). (You could certainly go with less or more depending on how you want to push your risk, and maybe make an exception or two). We also want to keep what we learned from the linked to post in mind and make sure an area of low correlation has it’s place.) Having this much is a bit more for longer term traders and contrarians looking to preserve enough cash in the event of a big plunge. If you are more nimble and more accurate go ahead and change this, but the rare times you get caught long in a big decline or vise versa, you will often make up for all the opportunity you missed out prior to the big run. Another solution would be to find more pair trades and hedged positions.

Overall though, you have to not only keep track of the trends in stocks, but in the alternative investments.

To keep things relatively simple, I came up with a general guideline to follow for stocks. I started with defining what type of trend we are in . We can be in 4 trending conditions:

Monthly trend up, weekly trend up

Monthly trend up, weekly trend down

Monthly trend down, weekly trend up

Monthly trend down, weekly trend down

Then I threw in overbought and oversold conditions. Within each of those trending conditions there are 4 possibilities. Either no extremes, weekly extremes, monthly extremes, or both weekly and monthly extremes. This gives us 16 potential scenarios to account for. (In reality there are more because 3/4ths of the trend signals for example can signal an uptrend) If you want to use The PPT OB and OS signals there are 32 potential scenarios.

The simple way is rather than make 16 more adjustments, to just note the 16 conditions first then as a rule of thumb subtract 10% from stocks and add 10% to bonds when PPT OB and -1% from stocks and +1% to bonds every additional 0.1 OB points it gets. And for PPT OS to add 10% to stocks and subtract 10% from bonds and add +1% to stocks -1% to bonds every additional 0.1 OS it gets. A more complicated solution would more aggressively sell the overbought signals and more cautiously buy the oversold signals when weekly trend is down (but not oversold), and more aggressively buy the overbought and more cautiously sell the oversold when weekly trend is up (but not overbought).

Then I went through each condition and came up with a potential allocation. To keep it less complicated I just chose “Arbitrage” as the low correlation play mixed in with “treasury bonds” and “stocks”. In reality, “gold” “natural resources” should be considered for “risk on” plays as well. And “currency”should be added in addition to “bonds” for “risk off” plays. Adding in MORE lowly correlated assets and using leverage when appropriate will increase return without at the expense of volatility and long term growth.

In some conditions, leverage is allowed to be added depending upon the asset class.

Since originally writing this article, I decided to keep an eye on these as a guideline, but to change the individual assets. So the principals remains in tact of what percent is “risk off” asset and what percent is “risk on” and what percentage is “arbitrage” or “minimal correlation” to the rest of the portfolio. But the actual percentages changes based on trend.

As you saw in my most recent post the trend trader, I came up with a sort of “model portfolio” to follow in the current conditions. In reality, I may shift a lot more heavily to arbitrage if the deal is right and I may leverage it if the deal itself does not seem to require leverage. For example, if Apple or Google bought something smaller, they would probably have enough cash on their balance sheets and the concern of the deal going through would not depend on availability of credit. If the economy turns south in a hurry as it is vulnerable to do in a monthly downtrend and weekly downtrend, or monthly downtrend with a weekly overbought condition, deals can fall through, so avoiding leverage, keeping that percentage of your portfolio towards arbitrage small, and being cautious makes a lot of sense. There are those I know who just trade pre earnings both long and short certain names, This would be a pretty low correlation type of trade so “arbitrage” when market isn’t vulnerable to sudden credit contraction and rising LIBOR rates isn’t the only way to have a near 0 correlation, it’s just the one I am going with. Earnings has larger moves in a short period of time and may require greater number of trades at a smaller position size to reduce potential for a large downside swing in portfolio size. What I am trying to communicate here are the PRINCIPALS though…

You can use the trends, or use value weighting or whatever signal you want for adding lower and selling higher via rebalancing, or more aggressively repositioning your allocations. But A very often overlooked goal is how your overall return on risk within a portfolio comes out. And to do that, it requires multiple assets with low correlation weighted towards which ones have a higher probability of equal upside/downside or greater overall edge, and a focus on low correlation. Once you can accomplish that, you can determine your return based upon leverage and how aggressively you position one way or another.

I have another post I will work on that further illustrates this difference in leveraging up your returns vs no leverage given everything else is roughly the same.

Comments »

Trend Trader

FYI right now we are in a weekly uptrend, but positioned for what could very well be a strong monthly downtrend. The QQQ, SPY and Dow are now overbought on a weekly chart and the Russel is not far behind. Also a higher high is made in the RSI while stocks are showing a lower high.

Conclusion:Position size in stocks should be minimal and reduced further into a weekly overbought signal in the remaining indices. It should be concentrated in value names as well.

The US$ is in weekly neutral position as trend is mixed on a weekly chart showing a downtrend in the parabolic SAR and the last signal from overbought in slow stochastics, but momentum gaining positive movement. However it is in a position for a strong monthly uptrend with oversold Slow Stochastics starting to near the trigger buy, but the Parabolic SAR is bullish and a bullish momentum signal in the MACD Histrogram has recently been given.

Conclusion:In light of weak market and strong monthly uptrend, Position size should be large, and leverage (such as using UUPT) is permitted) . The position size should be large enough to be biased towards a market decline and rise in the dollar, but small enough to get more aggressive should the weekly trend change upwards.

Treasury bonds (TLT) are in a Monthly Uptrend but OVERBOUGHT, and in a weekly downtrend just coming off of week 2 of transitioning out of the previous overbought signal.

Conclusion:Position should be unleveraged (avoid UBT, TMF) and a smaller position size should be taken in spite of the likely decline in stocks and the possibility to get significantly more overbought.

DBA – Although similar to stocks, DBA is in a monthly downtrend and what appears to be a weekly uptrend, the weekly uptrend has only just begun. However the weekly results are still mixed. With that being said, it’s rare to see an oversold RSI but the RSI came very close to oversold recently on a weekly chart, and the slow stochastics transformed from oversold and turned upward giving us a bullish signal, and the MACD is very close to a bullish signal. As a result I believe the chart could be considered bullish in spite of the still bearish parabolic SAR.

Conclusion:I feel DBA is a much better option for “risk on” at this point than stocks and possibly gold and should be positioned as such.

DBC – Very similar to DBA, but the parabolic SAR and MACD histogram on a weekly chart as well as slow stochastics are all bullish. Monthly is bearish. There is a bit less room on the upside before it gets overbought however.

Gold is in a monthly Overbought uptrend although a weekly uptrend signal is close to and expected to trigger into bullish territory. Silver is showing a monthly downtrend with a mixed weekly chart.

Conclusion:Gold is likely due for a pause longer term, but still remains a potential option to help reduce correlation in the market and a very small position is still warranted. Silver also gives us a clue about gold and silver is a bit bearish right now on the monthly chart.

Others:

Copper is bearish but has been for quite some time and is close to getting oversold on a monthly basis, for now stay away but keep an eye on it if we are to see further declines

Natural gas is at this point starting to look like an excellent value and contrarian play, so I would consider a position in that, as it is heavily oversold, however I would keep the position small and not add a significant position until it transfers out of oversold and gives a bullish signal as it is still in a downtrend, although one that has gone on for years and isn’t likely to continue for much longer.

It certainly may be possible to find undervalued stocks still worth it but the question is what is your time frame?

Overall Conclusion: The general theme is “protect capital” at this point. Stock position should be reduced, and potentially reduced to the minimum when overbought signals hit on weekly chart. Positions in DBC and DBA and potentially even GLD can be used now so that in the event that stocks get overbought it will provide a seemless transition into reducing stocks while still maintaining minimum allocation for “risk on” plays and avoiding overbought areas with minimal room for upside.

Meanwhile, US dollar position should be large and potentially increased near maximum if either a weekly oversold signal is given or weekly uptrend occurs. Treasuries should have a very small position but are still an option especially with the markets vulnerable and likely the US treasury bonds can gain. Shorting the euro is a possibility as well via EUO.

A small position could be considered in arbitrage plays, but it either should be kept small or larger with a majority (except for a small amount) held in an play that is expected to close very soon. Leverage as well should likely be taken off now, or very soon. A small position will always be warrented in arbitrage because of the ability to reduce correlation, however if e get overbought on a weekly basis and remain in a downtrend on a monthly chart, that is a vulnerable state of the market which could potentially cause deals to fall apart either through some kind of a weasel clause, or financing falling through, so unless you are very meticulous and good in this area, it is wise to keep the size smaller for now.

Although Arbitrage plays have very little correlation, so there always is room if the deal is right. But correlation and risk still exists in the form of economic contraction in lending, and increased pessimism by both businesses and individuals. Leverage should certainly not be used at this time. You can also specialize in pair trades, pre and post earnings plays, and other relatively uncorrelated things with the market

A very small (such as a 2%) position size could be considered in natural gas  at this point via UNG

percentages

risk on:25%

risk off:60% (leverage permitted)

arbitrage:15%

More specifically

Risk On

spy or value stocks: 10%

DBC:5%

DBA:6%

UNG 2%

GLD 2%

Risk Off:

TLT 10%

Cash 10%

UUP 20%

UUPT 20%

Arbitrage:15%

When we get the overbought signal on a weekly basis (including the russel), it makes sense to get more “aggressively conservative”:

risk on:20% (shorts considered)

risk off:75% (leverage permitted)

arbitrage:5%

More specifically it may look something like:

5% stocks

5% DBA

5%DBC

3% UNG

2% GLD (copper?)

Risk off

10% TLT

20%uup

35%uupt

10% cash

You can also use valuation models to determine percentages and adjust based on these so you increase allocation as it gets more undervalued relative to the rest.

Since we are somewhere between the “no extremes” and the overbought position (not overbought in russel), you could be somewhere between the two.

Additionally a daily “bonus” allowed if OS/OB on daily basis if you prefer a more active approach. (Such as 10% increase in “risk on” and 10% decrease in “risk off” at OS) Generally I will rebalance after a daily chart swings to a high or low with a bias towards the opposite direction so I shift my allocation slightly.

TLT is much smaller than it would normally be in both cases, but there is a reason for this that I may address later.

Comments »