The short term consolidation score looks at:
Daily Change
Daily Change Relative To ATR
Daily Change Relative To Weekly.
The short term represents any movement less than 1 week, but really only involves the daily moves because of lack of data between 1-6 days. It also scales the measurements so that as a stock moves less, it gets more points added to the score.
The intermediate term consolidation gives us more data.
Here are a few possible considerations to score:
1)Weekly change vs monthly performance
2)Weekly volatility vs monthly volatility
3)ATR (14 average daily move) ratios…*
4)Weekly volatility vs beta
5)Weekly volatility overall
6)Weekly performance vs beta
7)Absolute weekly performance not too extreme in either direction.
8)Distance from 20 day moving average?
9)Distance from 20 day moving average relative to some volatility metrics**
We can tinker a bit more with how one thing relates to another in different layers to provide a lot more clarity on whether or not the stock is undergoing volatility compression or volatility expansion in the last 7-20 days.
———————-
*ATR divided by price gives us a percentage daily move as an average over the last 14 days. While this only refers to the daily movement, it’s a function of 14 day volatility on daily basis. If the weekly volatility is smaller relative to the ATR (14 day volatility), it tends to represent a stock that is contracting in volatility. If the ATR is smaller than the monthly, it also tends to represent a stock that has contracted in volatility over the last 14 days more so than the last 30. You can also apply a beta adjusted bonus so high beta stocks (stocks with typically more volatility over a longer time frame) that also have a low ATR (less volatility over last 14 days), score well.
**A stock that is closer to it’s 20 day moving average will tend to either have moved less over the last 20 days OR be near it’s “balance” in it’s range suggesting it’s close to the Apex if the chart is fully consolidated. However,a stock with a higher beta, or ATR, or monthly or weekly volatility may be able to tolerate a little bit more movement from the 20 day volatility and still have no confirmed breakout or breakdown. Also, a stock that has moved less in the last 14 days or week than it has over it’s 20 day average may be consolidating. The closer a stock is to the 20 day moving average, typically the less it’s moved over those 20 days, or at least the more likely that it has stayed in an equally proportionally rangebound area or regressed to the mean recently.
Also:A stock in an uptrend with a 20 day moving average under the 50 day may represnet short term weakness and consolidation within an uptrend. A stock in a downtrend with the 20 day above the 50 day may represent a stock that may be consolidating and possibly forming a bottm, particularly if the stock is also above the 20 day moving average. This sort of deduction from data probably won’t be used, but may be a decent idea to pair with consolidation data to find chart patterns. It would best be used in a binary (1 for yes, 0 for no) and as an additional filter (E.G. you can set up a table to show you stocks that score over 80 that also pass this filter of “patterning” from uptrend.) Defining the stock as being in a longer term uptrend can be based upon a stock being above a 200 day moving average or 50 day being above the 200, distance from 52 week low, distance from 52 week high or other data. A little off topic here so I will scratch it.
A volatility measurement tends to measure a stock’s standard deviation of movement over a particular time frame. A stock will move within 1 std deviation ~68% of the time if it is normally distributed. 95% will be contained within 2 std deviations and 99.7% of the data set will be contained within 3 standard deviations. Whether or not stocks movements are actually normally distributed has famously come into question by Nassib Taleb in his books “Black Swan” and “fooled by randomness”, but for the purpose of measuring volatility, this doesn’t matter unless we are going to sell option premiums expecting moves within a particular range.
This is a bit different than looking at a stock’s average movement, but still relate to movement over a time period.
So as long as we evaluate each stock with the same measurement, comparing ATR average daily movement over 14 days) to weekly or monthly volatility (standard deviation of movement over the time period) should still get us an idea of how volatility has changed over time.
By looking for contracting volatility over time and comparing volatility over various time frames as well as the magnitude of the change, we are able to look on a 1 day, 1 week, 2 week, and 1 month period of time and compare volatility relative to a stock’s long term comparative movements relative to the S&P (beta), and not only get a good idea of whether or not a stock is located within normal bounds of a range, but whether or not those ranges are contracting, to what extent they are contracting, and how the recent “quietness” compares to the historical movement of a stock.

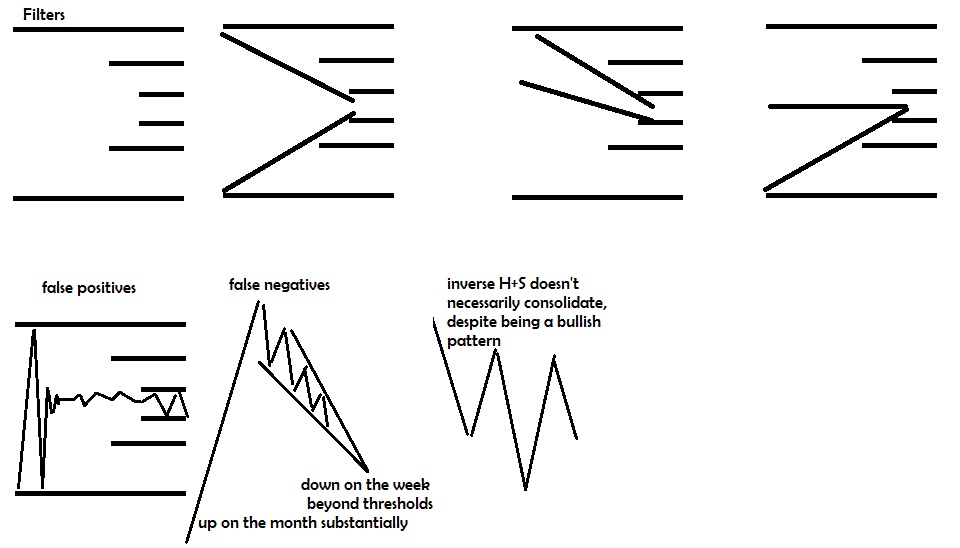
The pictures above don’t fairly represent how our scores also consider relative movement, relative volatility, and average daily moves and standard deviations over time periods. Overall, using all the data presented will provide a much greater chance of having consolidation patterns rise to the top than may be represented by the images. I covered this in a different post.
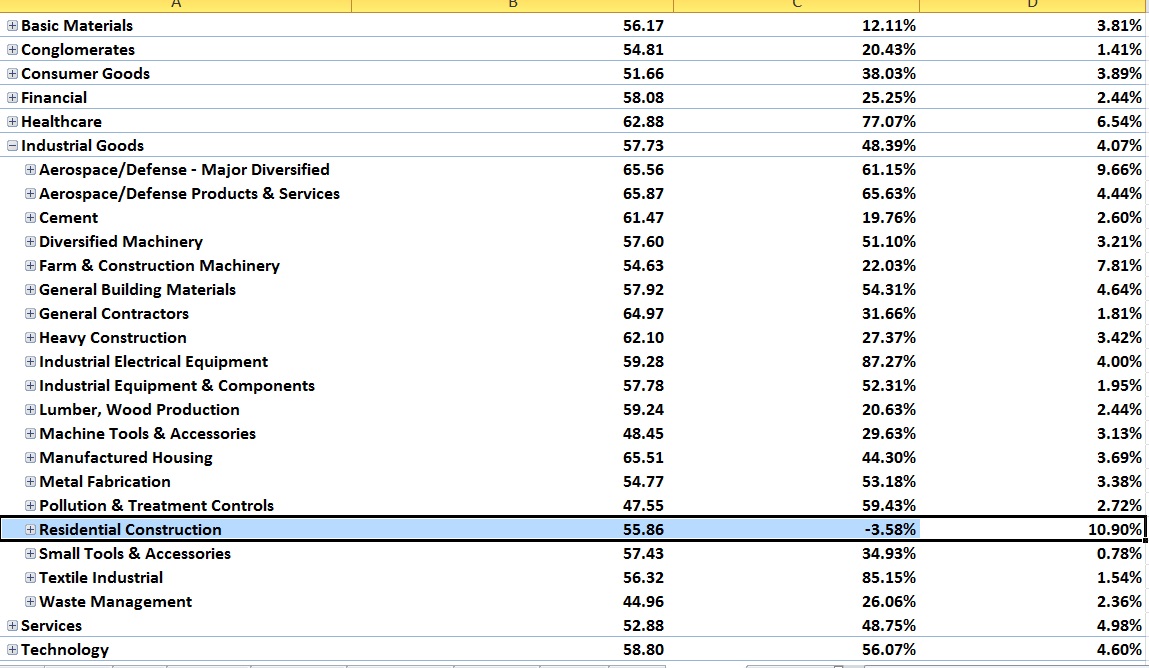
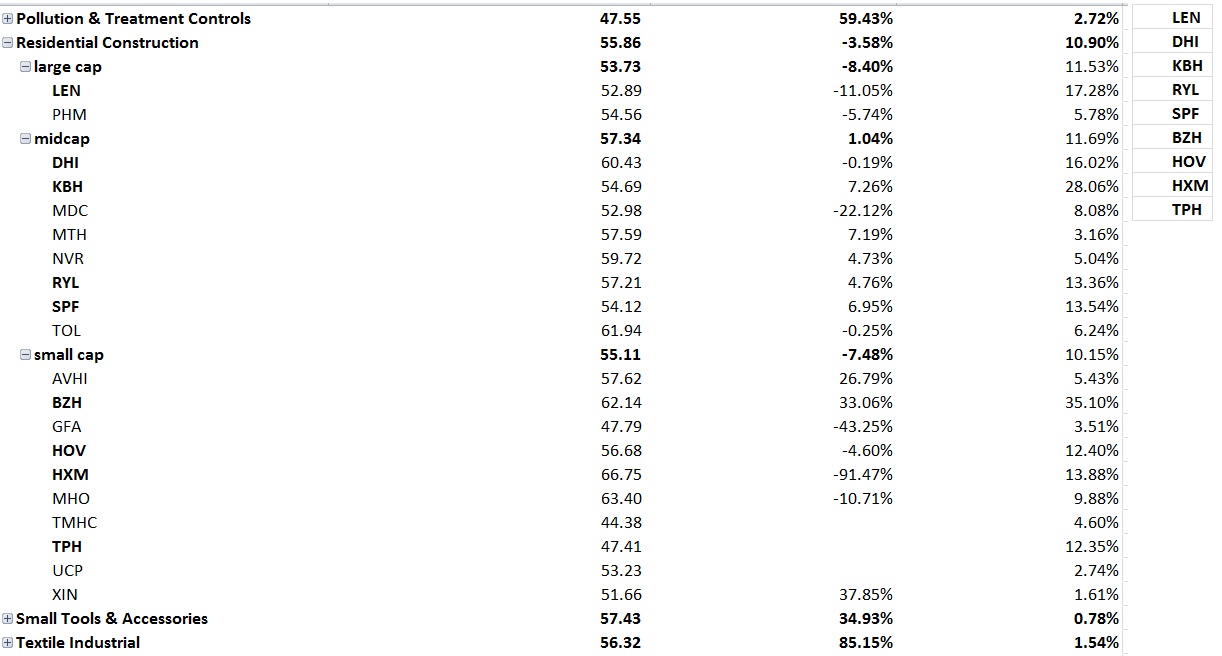
Again– once we gather this data, we can have the spreadsheet sort out the data by certain categories– We then can make adjustments to the final individual score based upon the average of the group. A stock showing signs of consolidation in a group with an amazing consolidation score may be worth more than an “ideal” setup in an average group or worse. When you see multiple stocks in an industry setting up, it’s less likely to just be randomness or a fake. If every single stock in a group is setting up this represents a large amount of capital preparing to rotate into a theme. One or two signals can be wrong, but say 20/25 names in the group setting up? The probability of you catching an idea before it makes a big move is greater.
I feel similarly about seasonal data. Seasonal data on an individual stock may be due to a few quarters of earnings at a certain time that happened a few years and skewed the data. But seasonal data that suggests both the individual stock outperforming the industry and an entire industry will outperform the sector, and the sector will outperform at a particular time of year is more likely due to a causal relationship such as capital moving in reaction to or in anticipation of holiday shopping leading to an increase in earnings and a fundamental reason as to why a particular stock has been more effective at capitalizing on this seasonality than it’s peers in the industry. This is a little off topic here as well.
I don’t necessarily need to understand the cause as long as there is evidence the move will continue to correlate with the timeframe as opposed to it just happened to correlate without cause that will be operationally random moving forward.
If you don’t understand a cycle and are just selecting a point your results will be normally distributed as if it were random. But if instead it were a cycle with waves that expand and contract in duration, and you were able to identify this cycle and buy closer to the low and sell closer to the high, then you would be able to show superior results. Your results would come at the expense of someone on the other side, so again, analyzing the results would show a normal distribution. If you are an outlier to the upside, someone or a group of people will be an outlier to the downside, and overall the data set would be within a range with little evidence that you were actually able to exploit a tendency. That is the nature of a interconnected system where the wins of one person correlate with the loss of another around a collective average. A little off topic again.
So we basically have a good outline for the different things we can consider when making our intermediate term volatility rank which I have begun working on. I have finished the short term consolidation rank unless I decide that something in the intermediate term rank belongs in the short term or I come up with a different idea of what I can add.
Comments »