I’m going to continue doing some work to improve the OABOT 2.0 a.k.a. “Neo”. Neo has been removed from the matrix of the market data and now must begin to be trained “how to see the code”. To start with Neo needs to develop how to discern reality from illusion which means being able to remove the setups that get him in trouble and add skills like a Kung fu master so that he can identify when to strike.

The next optimization step is ATR divided by beta. Beta is a measurement using I believe a year’s worth of data to measure average movement. ATR is a measurement of average price movement in dollars over the last 14 days. ATR divided by price gives you an average percentage move. When ATR is small relative to beta, in theory it suggests a more recent consolidation and range in the last 14 days than is typical. This is common among consolidation patterns.
In theory this should give you stocks moving less in the most recent 14 days than in the prior year.
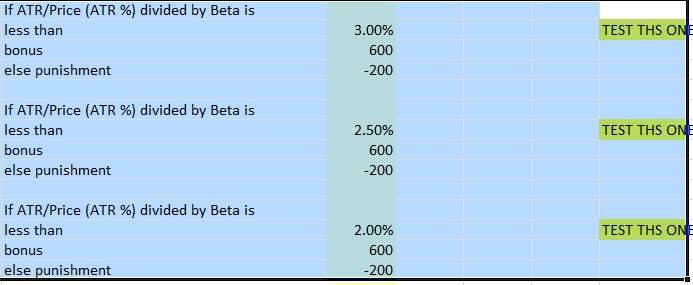
So I made major changes to the scoring. What I noticed was the setups that I was getting tended to be a little bit longer developing.
The best patterns began to show up as I got after around 300 names. This suggests the punishment knocked off a few good names and the reward also rewarded too many bad setups. In other words, compared to before, the score is too high and not as important as some of the other variables. However, it may also be that the score is important when ATR/price divided by beta is less than 3% but much less important when it’s less than 2.5% and 2%. In fact, it’s even possible that taking an extreme reading like less than 0.50% and punishing stocks for being in that tight of range will eliminate many of the merger/aqcuisition types where the stock has a ceiling equal to the buyout offer and thus it doesn’t hardly move at all over 14 days. This can be tested later. For now I have to get through the main scoring and worry about that later.
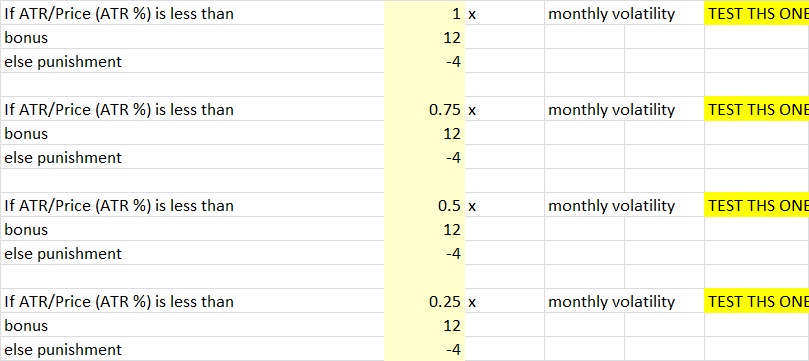
Next test 1/6th the size 100/-33. I definitely thought the results improves from the 600/-200 but the original 12/-4 was still better. Now is something like 12/-4 optimal or is something like 20/-6 better? Or perhaps 4/-1 is more optimal. For now I’ll just return it to 12/-4 and leave a note to test 20/-6 and 4/-1 to try to improve it later. The effort to try to optimize this seems less worth the effort than to optimize other criteria so that’s all the work I need to do for now.
Now we have ATR vs monthly volatility. ATR measures average move over 14 day. Monthly volatility measures 30 day volatility. If 14 day “volatility” (in the form of average daily move during that timeframe) is less than 30 day volatility it should represent consolidation if they are calculated in similar ways. This is similar to the first test we did where we wanted weekly volatility (7 day) less than ATR/price (14 day) except now it’s 14 day less than 30 day and represents a little bit longer time horizon of consolidation. I think this is one we’ll want to switch to a larger score than we did last time. Prior to changing it this was the settings.
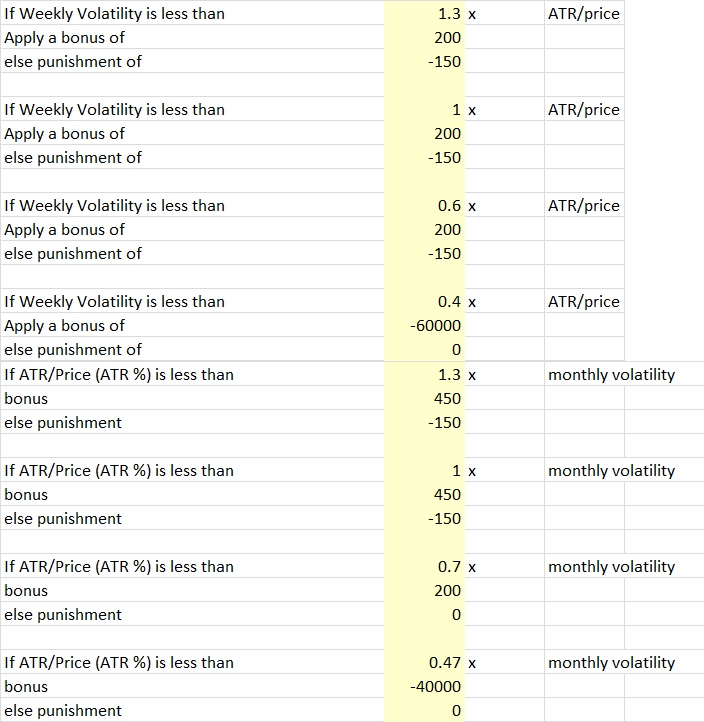
Last time with the 7 day / 14 day I may have started with too small of score even though I thought the score was pretty massive. It would have been better if I started with 1000/-750 just so I could rule out a higher score then I’d have a better sense of direction. Instead I went with 200/-150 and now I have to test 400/-300 and 100/-75 instead of just one additional test.
So I’m going to start this one off with 1000/-333. There certainly were some good setups. But also some not so good. In fact, some of the highest scores were filled with false positives of the merger/acquisition variety. That stuck out to me which led to changes I make that I describe later. But there were still some decent setups mixed in the top 50. That probably means that if ATR/Price is less than something like .25 or even .125 or lower I could actually substantially punish all stocks and probably eliminate a huge amount of false positives. After those the setups started to pop up. When I searched the top 300-400 range I couldn’t really see as many quality setups as in the 200-300 range but because the score was so large as was the punishment I decided to look at the 800-1000 ranked stock range and the setups improved. As predicted the score and/or punishment is too high. Since I started with such a large number directionally it is clear I have to reduce this number. I went with 800/-200 instead of 800/-266 so I reduced the punishment proportional to the reward. I’m pretty confident the punishment for not meeting these criteria was a little too high because of the quality of setups in the 800-1000 range. I’m also going to change the score for the less than .25 to -10,000 and punishment to zero so that it is obvious which ones were filtered out and I can quickly look at them. Then I can adjust this number to .125 or .33 depending on whether or not it filtered out too many good stocks or not enough merger-acquisition stocks. These were the only 12 stocks that the score filtered out. Looks like there’s a pretty low chance I’d be missing out on anything as a result of this score. 
I changed the criteria to punish any stock less than .46 the volatility and I still didn’t really miss out on any and filtered out over 2 dozen. Occasionally I may miss a name, but it isn’t very likely. A stock scoring less than .50 was another requirement, there won’t be hardly any stocks between .46 and .50 and if I change it to something like .7 then there isn’t much room between .7 and .75 so I have to really change all of the points of measurement.
I also decided to test all stocks between .45 and .65 to see how many stocks are worth giving a good score in that range or if I should make additional adjustments. They weren’t necessarily all that great, filled with utilities and defensive names but also had a couple good setups. I decreased the amount of score that I gave those between .45 and .65 and eventually moved it up to .70.
I decided the same problem probably existed for the weekly volatility and it did so I had to remove those less than .4 it removed a few non merger+Acquisitions at .4 but mostly bond funds and defensive funds so I wasn’t bothered by it.
Because of the changes I made, I had to sort of slide all of the scores on both metrics. It currently looks like this but isn’t really necessarily anything close to optimal just yet, it’s just much better than before. As such these numbers are likely to change soon but for now I need to take a break.
 I’m probably going to have to increase the first criteria’s scoring and decrease the second until I’m satisfied as I think the recent week having less consolidation than the I also may decide to play with the sliders and the exact multipliers of volatility.
It seems that the best stocks may actually be in a range of volatility of not too quiet and not too volatile, but generally less is better. So I’ll have to figure out where that range is to continue to make improvements from here.
I was also going to test weekly change divided by beta, but since ATR divided by beta wasn’t super helpful I probably don’t need to change this one too much so for now I’m going to skip it and circle back to it.
Everything remaining that I want to test in the intermediate term rank is related to the moving averages relative to other volatility metrics. If a stock has departed significantly from the moving average then it represents a larger move away from a range, the goal will be to find the levels at which we can remove stocks as going to far and what comparative metrics helps with this. Perhaps a stock with smaller change relative to the 20 day moving average than the monthly volatility or smaller daily or weekly change relative to the 20 day will capture volatility contraction. It’s really not clear. A 20 day moving average can also use as a reference point to manage risk with a stop on a cross under the average if the stock is above it, so a stock being close to the 20 day may represent a good entry.
I will probably test the long term consolidation (monthly to quarterly change and beta) rank before the short term.
It is unfortunate that there isn’t a “quarterly volatility” or “yearly volatility” or more yearly based volatility metrics aside from beta and even 5 year and 10 year volatility metrics. But for now that’s the limitations I am working with. If the 20 day moving average works well, maybe I’ll use the 50 day and 20 day vs the 50 day and such.
What’s left to do?
1)Adjusting the moving average based rankings
2)Adjusting the long term consolidation rank
3)Adjusting the weightings for the “total consolidation rank” (which combines short term, long term and intermediate term)
4)Possibly adding 50 day moving average into long term consolidation rank.
5)Cycling through a couple more times to fine tune the score.
6)Possibly making more significant changes to eliminate sort of the rising wedge patterns or reclassifying them so that when I sort through stocks I can eliminate them if I’d like.
6)Considering categorizing the stocks based on setup by using the stock’s proximity to highs/lows and behavior and making unique scores in the changes over the week/day/month as well as change in trend that signal the pattern or type of setup. Then if a stock meets this criteria, having a separate score just for that “pattern”. This is probably the best way to go. I sort of did something similar the first time I did OABOT but I’ll probably just copy and paste most of the old method rather than start over.
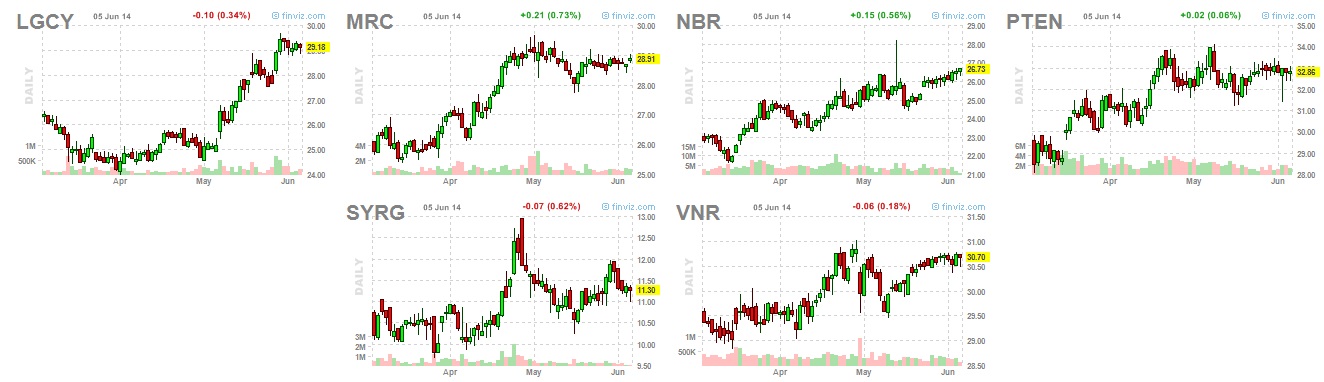
7)Probably setting up a better “summary”/”cover” tab. I like stocks that set up together, but if I don’t have any sort of way to differentiate a bullish consolidation pattern vs a bearish one it won’t be as useful.
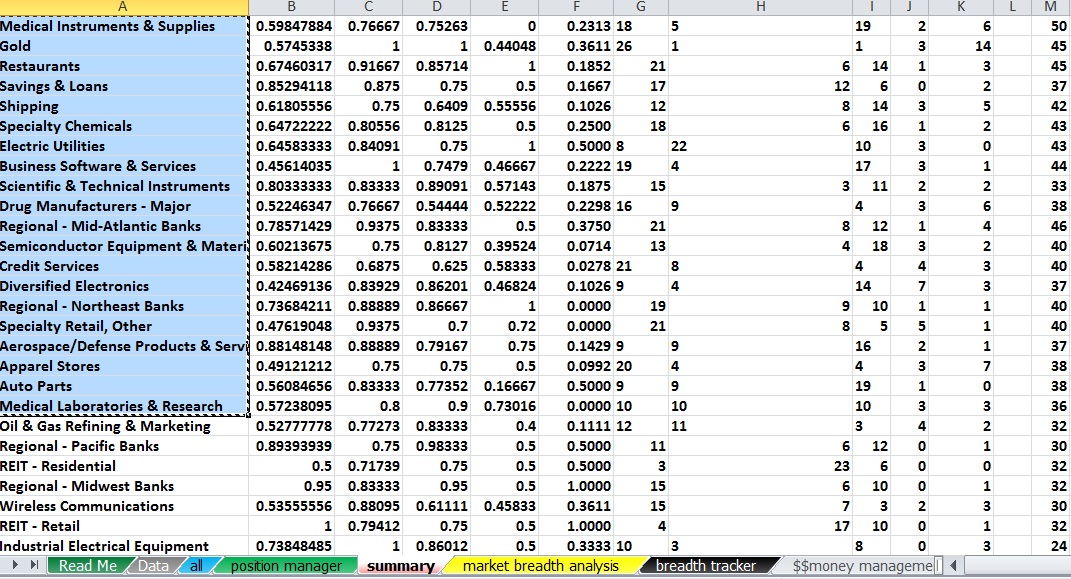
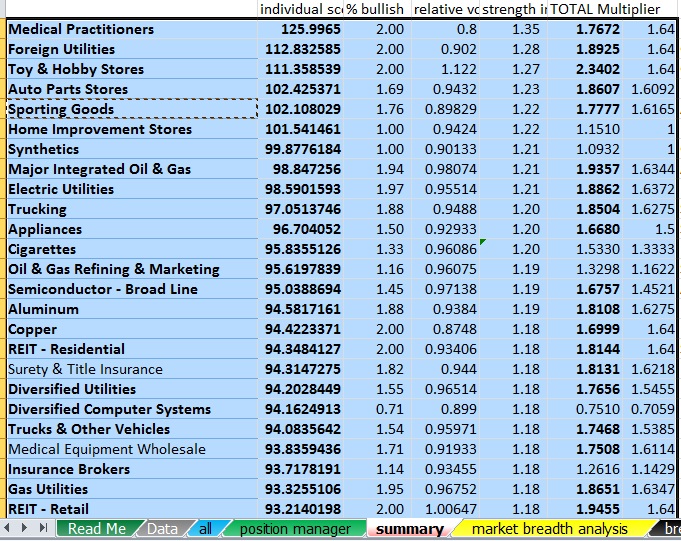
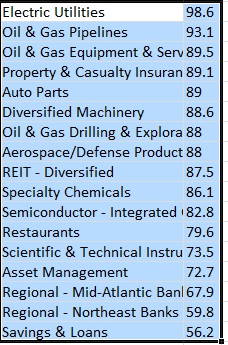
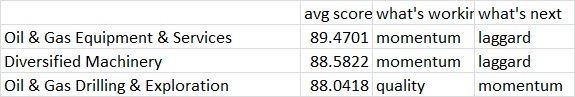
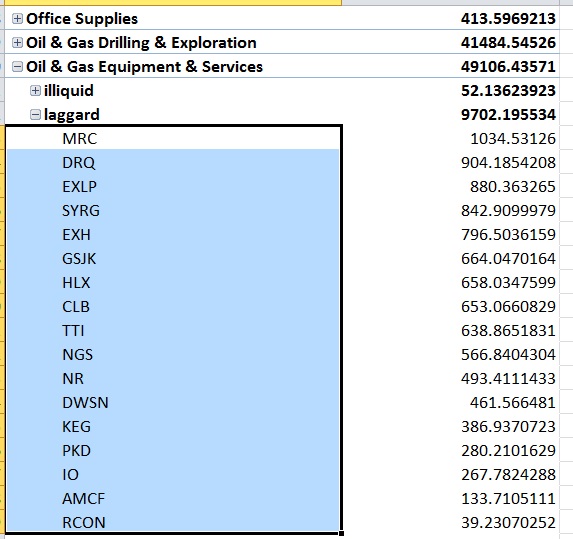
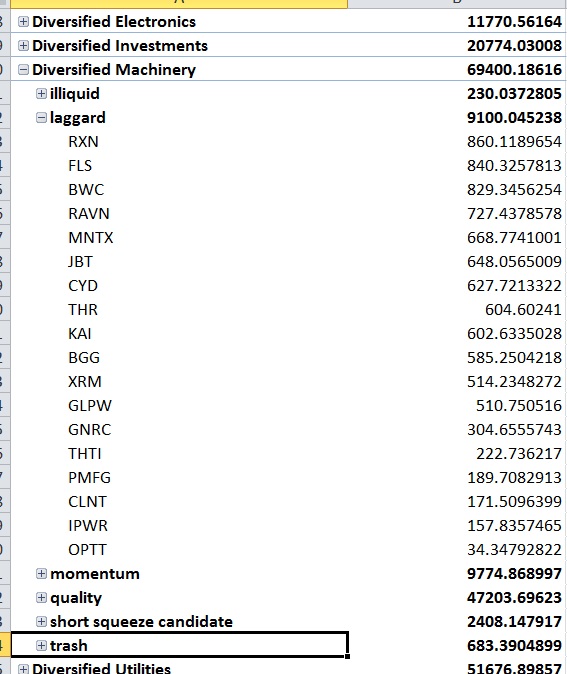
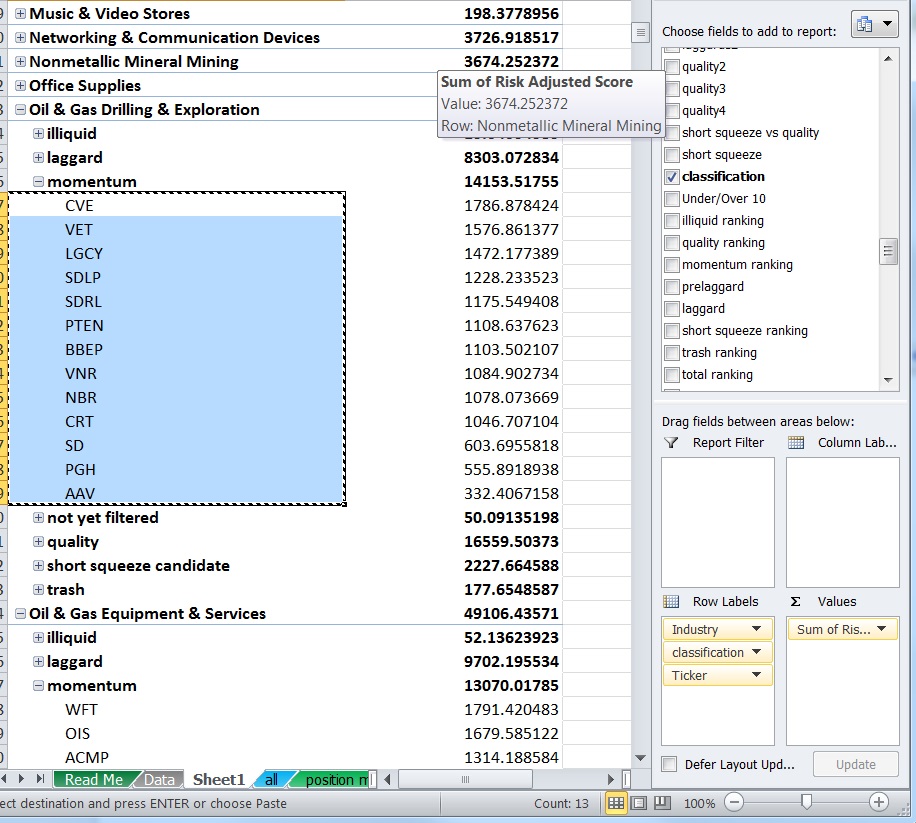
Right now it looks something like this
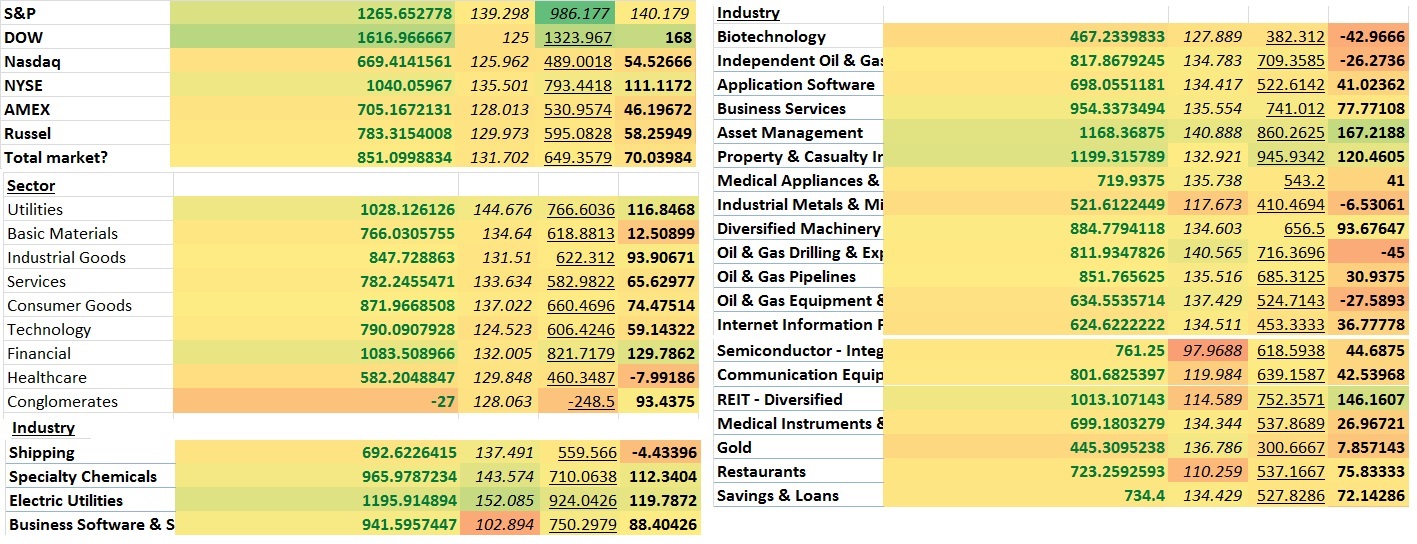
It has stocks categorized by market, by sector, by industry and market cap size is next to be added. This is another reason I’d like to see how certain “types” of stocks are doing like “stocks near highs”, “stocks IPOd in the last 2 years”, stocks 5-15% off highs, stocks 15-40% off highs, stocks near lows, etc. That’d probably be a good way to get a feel for the market’s risk appetite, but I can also use a feature that sums up a list of individual stocks and lists the average score.The last cover tab was more about what is “working” now and where money was flowing. This is more about consolidation ranking but I may add other breadth metrics and such on there as well. I’m all ears to new ideas too.
I probably will have a duplicate of my spreadsheet because for the cover tab I need to have very few if any false positives that might skew the average where as a research tool to find specific stocks I have no problem looking at several false positives.
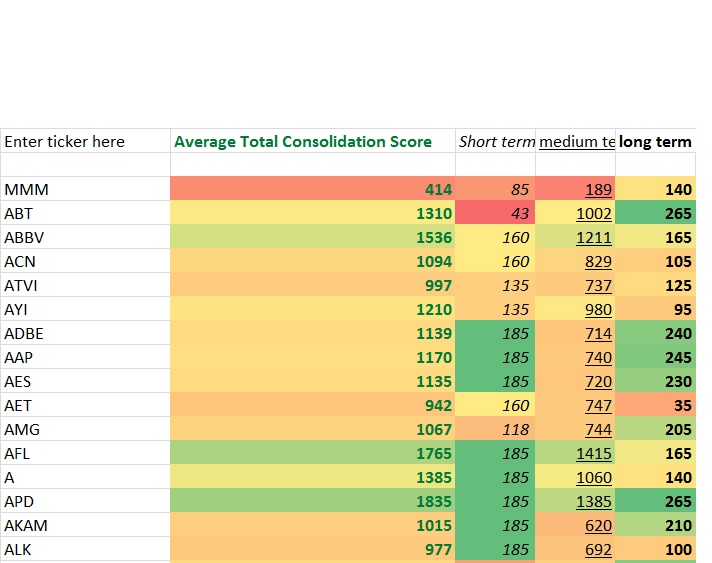
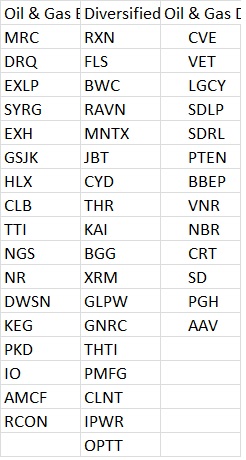
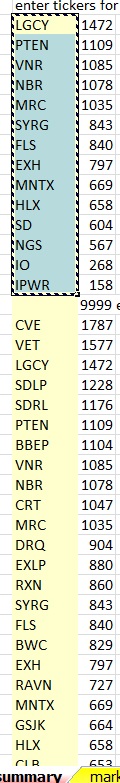
I also have a portion of the main tab setup for entering tickers if you just want to see how a group of say the FANG stocks compares to a hand pick group or market averages, or your own GARP index or whatever. This is how I constructed the S&P, Dow, Russel2000, etc market indicies average scores.