iBankCoin
Home / trading systems

trading systems

Trading System: Cliff Notes

Rules:

1)Own no more than 20 *active* option positions

2)Own no more than 40 option positions total.

3)1% position size per option with 5 possible exceptions.

4)Those 5 exceptions may all be 2%. max 2 may be 3% and max 1 may be 4% positions.

5)Target max 50% of stock positions ~5 positions of 10% or less.

6)10% income position that is always on except sold to avoid margin.

7)Remaining capital with 1-5% in asset allocation options. (commodities, currency/cash, stocks/short VXX, bonds/income) plus possible 2% hedge.

8)Only take a trade where reward is 3 times the risk or more.

9)Monitor breadth to add more when it’s oversold or when it makes a strong breadth thrust off of oversold, add normally when it’s not overbought, and add proportional to rate of selling or slower when it’s overbought or trending down from overbought (until oversold signal).

*A position that falls 75% below it’s original value you basically write off as a loss.

Watchlist:

-Watchlist is developed through OABOT’s top 400 and manually filtered from there to usually 20-60 names.

-Import watchlist into a spreadsheet with suggested stops and targets and current price

-Reward/risk will automatically update once it’s in the watchlist.

-Trading rules for entry that must follow the above portfolio rules and also an entry checklist which should also be using triggers.

Management:

1)As stocks are bought, input the stop, target, entry price into spreadsheet.

2)Since many of you are already trading, don’t worry about importing a large list of current holdings… just update the next trade until you phase out the old trades.

3)Stock must be below stop 5-10 minutes before trading close to trigger a sell.

4)Stock above target has a separate rules of waiting for the candle to close below prior candle low or failing to close above prior candle high Sell before the following candle’s close.

5)Which timeframe you use when stock is above target depends on condition but in general: With investments you may use monthly or weekly chart. With stock trades and options that have more than a week remaining til expiry you use daily chart. on options expiry week you might use a 1hr or 4hr chart. 1 day before options expiry you may use a 30 minute chart. On options expiry day you may use a 5m chart.

6)Generally update and check spreadsheet every hour. Also monitor watchlist stocks for purchase. On options expiry day check them every 10-15 minutes. One trick with that is if the stock is higher than the last time you checked, you don’t have to look at a chart.


Comments »

Backtesting Patterns And Triggers

Some people like to short breakdowns of bearish patterns or “shorting into the hole”. Let me show you why that has been a terrible idea at least during a bull market.

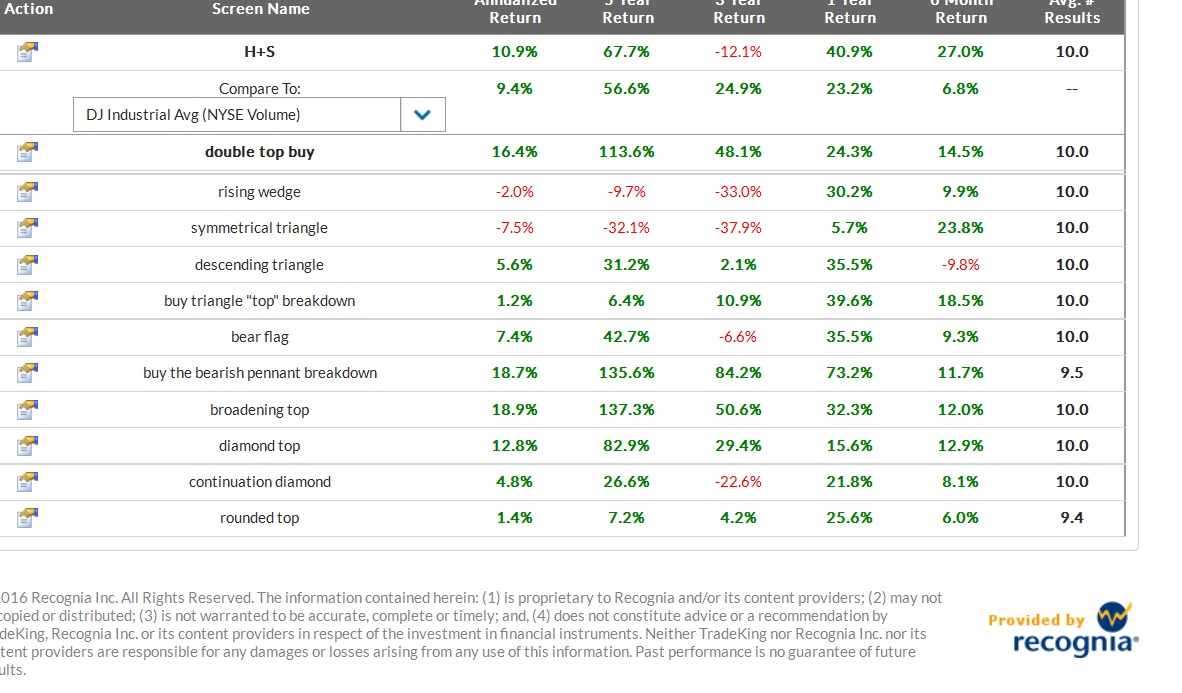
The following is the results of simply buying the breakdown and holding for 3 months. No stop. No targets. No complicated additional signals. Virtually every bearish “breakdown” reverses so hard it ends up positive and many of them actually beat the market. You could have bought the broadening top breakdown or a bearish pennant breakdown or a diamond top or double top breakdown and end up beating the market.

contrarian buys

These results of course are volatile and ever changing, so don’t expect the future to necessarily resemble the past. Still it’s a good reminder of why fighting bull markets by “shorting into the hole” is probably a terrible idea.

Certainly you might argue that you’ll be in and out much sooner than 3 months, but had I put another criteria on it I’m sure the results would also have been bad for the short. Maybe you’ll find the one exit strategy that works for this strategy, but I’m not going to bet on it.

Let’s look at some bullish patterns of buying after the stock breaks out.(buying late)

bullish

Only falling wedges (which has been an awesome pattern) beat buying the top 3 traditionally bearish patterns after the breakdown.  Some of them didn’t even beat the dow. Buying falling wedges BEFORE they breakout is probably better still.

I don’t know if anything is necessarily actionable here in terms of adjusting your strategy because there was a time when diamond bottoms were one of the top patterns and falling wedges were only slightly above average at least if you bought from the breakout. There also was a time when inverse H+S worked brilliantly and times when it didn’t work very well.

But there is a lesson here.

Be early or don’t bother. (Generally).

Also, since the strategy is to be early, we could work to try to fine tune what exactly triggers an entrypoint and how we prioritize which stocks to enter in a watchlist. We can look at setup quality to some extent but that’s a little subjective and might only help us narrow down a large list to a smaller one.

So we can use backtesting for looking at “triggers”. If you can find a simple signal to trigger a trade within the context of a developing pattern and backtest it, it should beat the market if it’s a better signal than just “randomly” buying.

The bullish hammer candlestick pattern:

hammer

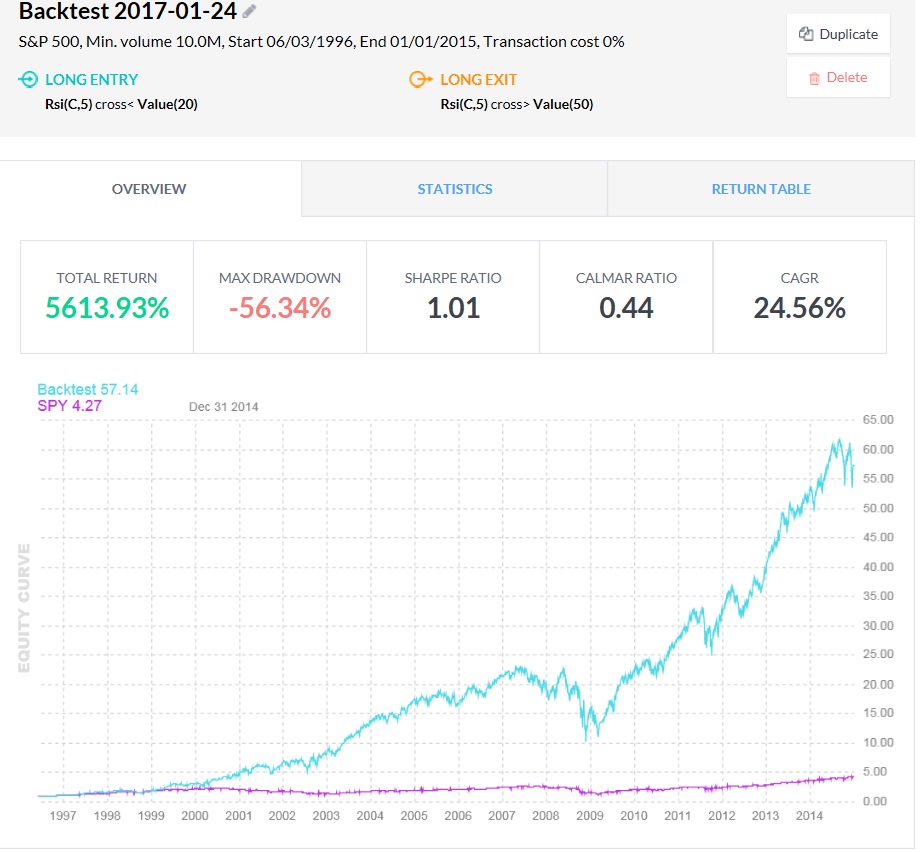
And the RSI(5) crossing below 20 (buying oversold).
RSI(5)

The RSI particularly is not a good signal to use on it’s own even though the results are good. This only backtested S&P stocks which reduces the risk of holding a stock going down to zero as a removal from the S&P would constitute a sell. There’s really no risk management if you’re buying something oversold without likely selling it more oversold. However, if you buy oversold with a developing pattern providing a clear support area, you can manage the stock by selling a failure to hold support and that actually probably makes some sense since there’s still a range of buyers now selling. Also, if we are using OTM options to buy we have a built in risk management mechanism of the full premium so we still have exposure after the pattern breaks down and it still can reverse.

A candlestick pattern can be used on its own in some regards since only holding it for 5 days limits the probability of it going down too far and has a proportional chance at an equal upside. Also, if you had to you could sell on a close below the candlestick pattern low itself or find a candlestick near support of other candles and sell on a close below one of those. Nevertheless, the only time I like using candlestick patterns on their own for a signal is as a hedge. It can be hard to find a bearish pattern worth trading during a bull market unless you have a process to quickly identify one that will at least underperform and reduce risk exposure, if not actually decline in a bull market.

There are other worthwhile triggers from your watchlist to activate a trade.

The purpose of a trigger should be one of the following (or more)

1)To increase chances of the trade working in your favor (the signal should have better than 50% chance of an equal move to the upside as to the downside).

2)To increase the risk/reward (the entry should be lower or closer to support).

3)To decrease the time waiting for the trade to work (The entry should be closer to the breakout point).

4)To narrow down a group of stocks to the one that is most likely to provide the best risk adjusted return.

Aside from RSI oversold or a hammer candlestick there are a few more triggers:
-Buy at support or near support or even below support intraday and exit on a close below support (better R/R)
-Pattern within pattern setup. (momentum of intraday pattern may trigger the actual pattern you’re trading to break out… plus this generally means greater consolidation and greater volatility/range expansion usually results)
-Breakout of pattern within pattern (Rather than buying before the intraday pattern goes you wait until it starts to move and this way you may get it closer to the regular pattern’s breakout point)
-Break above prior day low in bottom half of pattern (usually a move above the prior candle leads to some sort of short term price movement that may trigger a breakout)
-Tight multiday range (volatility compression leads to volatility expansion A.K.A. breakouts)
-Near Apex of pattern (shortens your holding period waiting for the pattern to develop and break)

If you are still having trouble deciding which stock to add from a watchlist, there are other factors you may consider:
-Picking the stock from your watchlist with the highest short interest
-Picking the highest reward/risk
-Looking at the underlying options and finding the option with the best reward/risk

-Using the best reward/risk and calculating the amount you have to pay to get that reward/risk for every remaining stock and putting a good till canceled limit order there and then just watching to make sure the pattern is still in tact and canceling the trade if it breaks.

Not all of these ideas are easily testable with the available backtesting tools, but you should at least have a process that clearly defines or provides rough guidelines for a method to decide which trade to enter, how many trades you can enter with the same expiry, how much max option exposure (current portfolio), max exposure (by initial purchase), max number of purchases in a single day/week/month… and a checklist to go through in the morning before trading and before placing each trade to help you navigate these decisions.

I’m still working on defining this, and I’ve been trading for >10 years so it isn’t a must… but I’m pretty sure I’d have better results if I was more organized and had a more precise process… At a minimum it’d bother me less if I missed a buy… because this way it won’t be because of lack of organization, but instead just because of the way I chose to define the system.

update: Here’s an outline of a trading system I’m working on to more clearly define decisions and to eliminate uncertainty with regards to decisions.

Generally you should aim for the best R/R on the trade you make itself if any one trade is clearly above the others… outside of that.

Here’s a possible priority list:

1)RSI (5) combined with intraday RSI oversold (1m,5m, or 30m) while in the lower half of the pattern and near support.

2)RSI(5) combined with hammer candlestick at support (rejecting breakdown of support)

3)Hammer candlestick at support

4)At pattern support independent of any other signal.

5)RSI (5)

6)Tight day range

7)Hammer candlestick somewhere near support

8)Pattern within pattern

9)Close above prior day

10)Breakout of pattern within pattern

11)Buy the failure of the pattern (breakdown) and wait longer.

12)Breakout of actual pattern but within 3% of breakout point and 10% of low.

I still kind of think that calculating the cost of an option at support at the current day and prioritizing by the risk/reward at that price (and then canceling the remaining orders if you hit your maximum) might be the best approach… but with multiple strike prices and expiry cycles and different targets depending on expiry cycles that can be a little challenging too.

Even having this priority list isn’t really enough to tell you how patient to be waiting for a priority 1 vs whether or not you should just take any one of these triggers. It can tell you if you have 5 stocks you like and only want to buy 2 how to decide which ones to choose, but it is only a small part of the trading system.

Comments »

Asset Allocation Strategy

PP

Capital has to move. I believe the market can almost never be in a state of equilibrium because new debt is being created which creates additional capital that changes the balance of allocation, and old debt is being replaced when it’s being paid or assets are being foreclosed for the inability to pay and moey leaves the system or rotates away from one particular system such as a domestic, localized economy to a foreign one.

As such, the efficient market hypothesis can almost never be exactly correct, and if it could be, it only is for a moment since new debt being created and old debt coming due and interest payments are never coordinated to sustain parody in the market place. People have to make moey to pay bills and transactions HAVE to occur. If they don’t, such as in communism, the economy collapses as has occurred historically anytime any nation even attempts to move towards a communistic state.

With this in mind, we still should care about how one might position in an effecient market, because a true “game theoretic optimal solution” or “equilibrium solution” is indifferent to how the actual market is positioned. The key behind this philosophy is to position such that you profit from a movement of capital regardless of in which way it occurs.

A simplified example is shown at the top of this post, but an even more simple one would be a world where you could choose between 2 types of currency assuming neither could be eliminated from legal usage. The optimal “equilibrium” solution would be 50% of each at all times. If 99.9% of the world used dollars, you still would gain from 50% mixture of each because you’d maintain the ability to reduce higher and add lower. If it was 99% the other way that would also be the case. Although a more “exploitative” solution would be to position the inverse of the crowd such as being 99.9% of the currency that is owned by .1% of the population, that doesn’t detract from the profitability of the “equilibrium” solution of 50/50%

Understand this difference because I do not advocate an “equilibrium strategy” entirely, but by being aware of it you can deviate from it to the degree by which you have an edge and to the degree by which you can stand volatility.

If you have an edge, you can try to assess that edge probabilistically and use simulations to match your goals such that you have an expectation that satisfies you at a level of volatility that you can stand.

If you were to integrate your ability to make short and long term trades, you might create a baseline that adds in an edge playing the market, but curbs it with an allocation based equilibrium strategy as a core staple of that strategy in the following regard.

equal

As you can see, by including individual short term and long term trades as an allocation, there is a bias towards stocks and stock picking.

With the introduction of this, the problem is that over time your allocations will change and the reality of transaction fees require less frequent rebalancing. Also, individual trades usually have upside expectations and you want to let your winners run. As such it is possible that your individual positions may cause portfolio to grow out of balance. So you probably want to build in a more flexible mechanism to maintain overall parody with regards to your intended allocation of risk and stocks overall. This can be demonstrated below
1

2

3

Rather than sell short of targets to maintain balance in asset allocation, you can use this reflexive, adaptive model to maintain the balance. As long term allocation grows you can reduce or entirely sell your broadbased stock ETFs. As short term allocation grows you can add hedges that last at least until your exit strategy triggers a sell and the increase in cash can allow you to make the adjustment to bring your strategy back into the intended risk allocations. You can develop more complex models to work subasset class allocations as well, and even try to handicap those or handicap the actual market movements by weighting your positioning according to risk and reward and expectations overall to more aggressively try to game the market as well as use leverage.

4

If you believe that you have a large enough edge and want to use additional information, you may use volatility as a tool and include options.

When volatility is high, you add to option selling strategies or XIV or SVXY ownership, and you might add to broadbased ETFs since correlation tends to be higher and the edge for picking stocks is less. You might increase longer term exposure following a crash weighting heavier in value and fundamentals. When volatility is low, you add to overall option exposure and may opt to reduce your allocation of XIV or SVXY. When correlations are less you may want to increase option ownership and decrease broadbased ETF ownership and look to apply your “edge seeking” as a larger percentage of your allocation.

This dynamic approach can still have with it a set of rules from which to govern the overall intent, and some kind of checklist to help you operate it efficiently as intended. The overall idea is to not get emotional and allocate emotionally, but instead strategically according to a plan made when your mind is operating at a high level, rather than when you are in fight or flight mode and you’re in “panic mode” and your amygdala is active.

So if I were trying to game the market right now, on the long term I may be interested in commodities, but in the short term I don’t see any setups. Any allocation towards ETFs or calls would have to be with plans of long term ownership. I think it’s a good entry for a longer term horizon on the stock market, but the individual names aren’t suppolying great entries aside from maybe some long term stock investments.

So with a volatility spike I’m rotating out of my individual stock trades as they stop out, and then if I have any hedges, I’m seriously reducing or taking them off as the decline reaches extreme. I’m looking on adding or increasing an inverse volatility ETF as long as the primary bull market thesis remains intact, and I’m looking to position for long term stocks but I’m not really looking to add long option strategies. I may be willing to sell puts on stocks I’m willing to buy or sell put spreads on stocks with high IV that look to be likely to hold or go higher.

You don’t necessarily need to force trades, but if you have thought all of this out and have thought out position size, maximum and minimum allocation for each assetclass or a way to objectively determine the allocation based upon certain measures, you will avoid fear taking over.

You will also be able to remain consistent. One of the biggest problems traders run into is that at the bottom, an allocation of 50% stocks seems high, where as at the top it seems low… At the bottom finding individual stocks to buy is tough, where as at the top they are easy. This is why you need a system in place while you’re thinking rationally that you can apply as the market changes, or at least increase the size of your hedges and bearish bets at the “top” while selling you broadbased ETFs to counterbalance your ability to have confidence with individual positions without unnecessarily over exposing yourself.

You also need to have thresholds at which you rebalance. Perhaps if a stock is within 5% of targeted allocation you don’t bother rebalancing, but outside of that number you do.

from an exploitative philosophy it’s okay to increase your allocation as the market goes lower if you are buying individual stocks, and you have some sort of risk management mechanism which acts as a kill switch if buying lower fails. While in equilibrium strategy you don’t want to expose yourself to further declines with a “martingale” type of strategy, there are many times when both the odds of a bounce and the expectation when it does happen actually increases as stocks get more oversold. But you need to have limits. So if your average allocation of an asset class is 25% you might take that up to a maximum of 40% when buying the ideal oversold conditions and down to 10% or 5% when selling oversold.

I can’t define these to you because that depends upon what your pain tolerance is and what your goals are and timeframe for those goals, and whether or not that is realistic for you.

With an equilibrium strategy, you are basically looking at a strategy that works over an infinite time horizon, where as realistically you should approach it with variance in mind. As such, position sizing becomes important and your cash position should increase. This is why the logic to weighting assets by volatility may actually make some sense on the surface, but I don’t believe it’s pure equilibrium strategy.

Unfortunately, that which is not volatile may not remain that way forever. I believe real estate had not undergone much downside volatility at all for decades until it finally crashed in 2007-2009. The global demand for bonds on the basis that it has been “safe” or less volatile isn’t an accurate reflection of the last 200 years of history where governments defaulted, nations have risen and fallen and political power and influence has shifted. It may provide some normalization of risk through the INCOME, but that doesn’t make it immune from default risk or loss of confidence and asset class wide loss of risk appetite. Since that risk still exists, you have to ask yourself if the prospect of complete default is worth such a low yield. For example, a 2% yield requires 36 years of interest accumulation until it makes a 100% return. If the chances of a default in that time period is greater than 50% than there is no advantage at all from holding bonds instead of just cash. In fact, it’s worse to hold bonds probably even if those odds were 40% because of volatility risk, opportunity costs of not being invested elsewhere, taxes on income and “black swan” risk even though there are some advantages in curbing volatility as a result of income. For many people even if that amount were 20% due to risk tolerance and transaction costs it may be better to hold cash than bonds, and even if it were much lower it’s not a huge loss. In some cases bonds can be used as collateral to borrow from to create leverage.

The real risk to cash is not the failure to return value, but the failure to protect purchasing power. As such, assets that gain from inflationary pressures, particular that effect the individual the most (such as food and fuel and stocks) is the best way to mitigate that risk. Currently, I don’t view a shift of capital from stocks to bonds as a major risk to stocks, so overall the exploitative strategy should probably be to have a mixture of cash stocks, some commodities and perhaps even betting against bonds and finding other income strategies such as preferred shares, corporate debt and occasional option selling strategies when conditions warrant it.


update:

Another approach to maximizing a particular expectation of return is looking at synergy between asset classes. Since the rotation of one into the rotation of another produces gains to the degree at which you are able to effectively buy low and sell high and since allocation of income provides additional capital to more efficiently rebalance and normalize returns, you can look at the downside deviation or the overall deviation of results to compare the overall portfolio strategy as a measurement of risk.

While this only tells you a backwards looking result of how volatility can be smoothed, it is more appropriate than backtesting of actual results since it’s looking at historical correlation.

I came up with the following strategy as an effective means historically to balance risk efficiently as can be seen at this link.

Sortino ratio: 3.23

Sharpe ratio: .87

CAGR: 10.23%

Std Deviation: 8.08%

worst year -2.71%

Backtested since 1985


Allocation:

Intermediate term treasuries 29% (IEF)
Long term treasuries 41% (TLT)
Small Cap Value 11% (IWN)
Mid Cap Value 14%
Large Cap Growth 5%

Midcap values weren’t around before 1985 so the following is the best I could do backtested since 1972.

Sortino Ratio 2.21

Sharpe ratio .76

CAGR 9.81%

std deviation 6.18

worst year -1.67%

10% Small Cap Value
12% Int Small Cap
70% Intermediate term treasuries
8% gold

Another strategy which involves cash to reduce the volatility is
8% small cap value
11% int small cap
3% LT treasuries
47% intermediate term treasuries
24% cash/money market
7% gold

If you progress towards using leverage and rebalancing more frequently, you are going to have to increase cash position and income positions to replenish that cash position so you can normalize the volatility without having to pay a lot of extra transaction costs to rebalance.

Since the goal is not return overall but instead return vs downside volatility, you potentially could leverage this up significantly and still have less volatility than a non leveraged strategy that was more aggressively allocated. The result can be a better return on better risk.

I believe this philosophy is somewhat flawed since it looks at past performance and past risk as defined by volatility and past correlation to determine overall portfolio volatility. I think to some degree, the less volatility a market has experienced over the past the more vulnerable it is to more dramatic volatility if people are following models expecting the future to resemble the past. Once it starts producing more volatility than expected, that forces people to re-calibrate their models and reduce allocation which creates more selling pressure and more re-calibration among mutual fund managers and others.

But I think you can still look at bonds and convert that to other forms of income that are currently better positioned, and try to identify the areas better positioned for growth in the future as well and keep in mind how down years of stock and bonds may see positive results in gold and commodities and how certain assets compliment each other. Or you can use some mixture of a more balanced strategy that allocates among a few asset classes evenly and this mixed with some tweaking based upon your outlook and adding cash as necessary or leveraging as necessary to better meet your goals and risk tolerance.

This is designed to get you thinking about how capital flowing from one asset class to another plus past history vs future potntial and your own volatility tolerance to come up with a flexible strategy that works for you and isn’t overly complicated to follow.

Comments »

Trading Systems Part 2: Accounting for Multiple Outcomes

In a basic “pot odds” calculation as described in the last post trading systems: pot odds and trading, if you can let your winners run so that you sell your option for 4 times the cost, netting 3 times your risk or 300%, you are getting 3:1 and thus only have to be right more than 1/4. (lose 3, win on 3 the 4th time and break even). However, options are more complicated than that. While you may be right or wrong on whether the stock goes to a price such that you earn 300%, the stock could reach the target earlier, in which case you may make more than 300%. Also, the timing could be late but direction still right, or the stock could gap up or run past the target and exceed your return. As a result, you might have a number of outcomes ranging between the extreme 1000% or so outlier trades to 0% depending on your ability to let the winner run and your tolerance for volatility. A simple pot odds calculation becomes tricky for determining whether or not the system is profitable, and how much. For this you can use “expected value”, but that really doesn’t grasp the expectancy of the system per trade over time. Nevertheless, since 1% risk represents a small amount of capital lost through volatility, it can still be looked at from the concept of how many 1% position trades are taken per year, and you can approximate that the growthrate that occurs in your portfolio is close to 1% of the expected value of the system as a decent starting point. With such a position size, you can take more trades on at once and as a result the gains can compound faster. There is still some correlation (a LOT of correlation during a significant correlated selloff), but by diversifying trades over multiple time frames and spreading out your purcahses and using the occasional hedge, you can mitigate the cost of volatility at very little cost to your overall results.

So let’s get into an example. Say you average out all your trades over 100%, You average all those over 30%, all those between -30 and 30% and all those from -30 to -90% and then all trades that lose more than 90%. That gives you 5 averages that can define your system in the total average of “large wins” “moderate wins” “break even” “salvaged premium” and “full loss”. The frequency of each event determines a number of trades out of all trades. Simply divide the number of trades by all trades for each of the 5 and you have an estimated probability of the return. Average the return of all trades in each category to get the average return.

From here I actually like to model my results as opposed to using expected value, but let’s just give an example:

Last year’s 2013 results before I booked a couple of large wins in TWTR and TSLA were

17% of trades averaged 294%, 20% of trades averaged 53%, 15.8% of trades averaged -1% 23.2% of trades averaged -63% and 24% of trades I rounded down to the full 100% loss.

To do an “expected value” calculation, you simply multiply the probability of each event by the return and then add them together. So (.17*2.94)+(.2*.53)+(.158*-.01)+(.232*-.632)+(.24*-1)=.217596=~21.76% gain per option trade. By letting the winners run in 2014 from Jan until Jun before a few large wins in AMZN and PCLN and others, this yield was just above 40% but it was also substantially helped by a few large outliers well over 500% (GMCR,AAPL,etc) . So how does that translate to portfolio growth? There is an easy calculation that can be done if the position size is small.

Let’s put it at 1% risk or 1% of .2176 expectation=.002176% per trade. In other words, we multiply at a factor of 1+.002176 per trade. (1.002176^X)-1=annualized rate of return where X is the number of 1% trades you can place with this system in a year.  Make 300 trades and you are looking at about a 1.002176^300=~1.919-1=~.92=92% annualized rate of return.

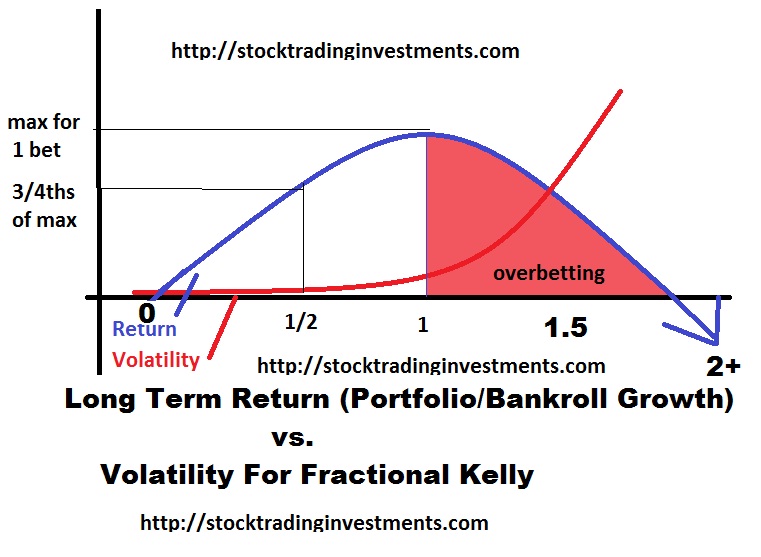
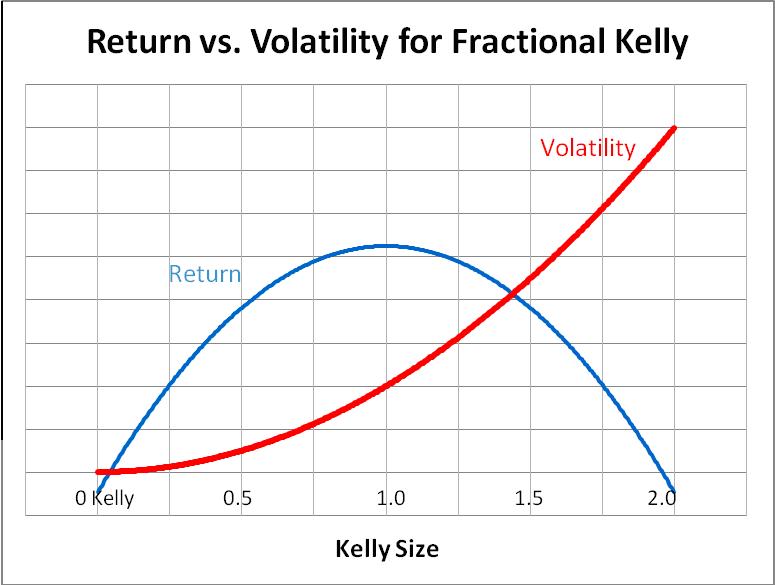
The smaller the position size, the more consistent the system, the lower the correlation between trades, and the greater the edge, the more accurate the estimation is and typically the more consistent the results are with the expectation. However, keep in mind the relationship of return and risk as you look at how it becomes less accurate with increased position size. The assumption that increasing the risk will proportionally increase the volatility and the reward assumes a linear relationship which is not true. Instead the relationship looks as follows:

Kelly-Criterion

Nevertheless, we can use a monte carlo simulation to pull a random number between 0 and 1. Since there is a 17% chance of the upper result if it pulls a 0.17 or less, this corresponds to the 294% return result occuring, where as a 20% chance of a 53% return corresponds to a .17 to .37 being pulled and so on. That can allow us to randomly pull the results of a thousand trades, and then through a monte carlo simulation tool we can simulate thousands of trials of 1000 trades and model any particular result or formula as a consequence of each result to get the intended information we need and reflect the results we want. Just by using the average return and ignoring the substantial probability of effective ruin

At 1% with ZERO fees, we get an average return of 91.35% compared to our expected 91.9%

With 2% with zero fees we get an average return of 265.7% compared to an expected ((2*0.002176)+1)^300=268%. Being able to place the same volume of trades as the risk gets too much larger becomes increasingly difficult and increases the correlation risk that is not modeled here but will negatively effect returns. As we increase the position size the difference between the average simulated return and the calculated return grow as the simulation is less and less close to the calculated returns due to losses from volatility. The other thing is, as bet size increased it becomes increasingly difficult to place the same number of trades per year.

What this growing difference does not show is the increasing skew of results. In other words, if 1000 traders were to trade this system over 300 trades at a fixed position size, a smaller and smaller percentage of traders would have a greater and greater result as position size increased. The magnitude of the outliers would increase which would skew the AVERAGE expected results. The opposite side of it would be an increasing probability of poor results as well.

The kelly criterion is a risk management based mathematical formula to assess risk management to maximize gain. Effectively, the more you increase the position size the more you turn it into a lotto ticket, until you eventually take your skill edge out of it and your results actually begin to decline and eventually even become negative if you get too carried away. Even if you are adjusting the percentage risked, you should never go over the full kelly, and since you don’t have an unlimited amount of time to recover the drawdown, and you can only place a few hundred trades per year with overlapping correlation, and there is greater uncertainty… I would absolutely drastically reduce the bet from the kelly. Calculating the “kelly” is a process that has many applications and is another story for another time.

Comments »

Trading Systems Part 1: Pot Odds and Trading

I wanted to go over some basics of building a profitable trading system by looking at “pot odds” a term applied in the game of poker and “expected value” and how it is interchangeable to trading. I am usually not a fan of looking at expected value because it doesn’t properly frame in the potential for massive account volatility, but it is still useful in understanding the basic requirements for a profitable system and can assist people new to trading or who have not yet learned to be profitable why they might have some “leaks in their game”. “pot odds” looks at the amount you can win, vs the amount you have at risk to determine the necessary probability of your decision in order to be profitable. From it you can also determine “expected value (EV) per hand (or per trade) ASSUMING the same amount risked every time.

In other words, say your opponent moved all in for the size of the pot on the flop. You get paid 2:1 to call since you must match your opponents bet, but get twice that (the pot AND the opponent’s stack) if you are right. You can then lose twice, win on the third and win everything you lost back. Therefore, you need only just better than a 1 out of 3 chance of winning for the call to be “profitable” in the long run.

If you have your entire bankroll at risk rather than a small percentage you are overextended and it is not a long term profitable decision because it will inhibit your ability to earn in the future as you will not be able to recover from a loss. “bankroll management” as it is called in poker and “position sizing” as it is called in stock trading is an important seperate topic that combined with “pot odds” greatly influences your long term profitability.

What novice poker players in cash games and traders often ignore is the fact that they will lose due to volatility. Lose 10% of capital, you need 11% just to get back to even, so 1% is lost due to volatility (it is actually less since multiple gains will also compound at a less substantial rate). Lose 50% of your capital and you need 100% return to get back to even.

kellycriterionbetting more than 2 times the “full kelly” actually turns a profitable strategy unprofitable over ANY time frame, and erases any skill edge you have. While your winners may also compound, your losses create disproportionately large drawdowns that require a greater skill or edge to overcome to get back to even, and due to simple chance those drawdowns are certain to occur over a long enough time horizon with a correlated, unhedged system. Your edge is not as profitable as the expected value calculation in reality, at least not without introducing a “risk of ruin”. But I digress, let’s keep things simple… Pot odds. To keep things simple and ignore “uncertainty”, I want to use a situation in trading which the numbers tend to be a bit more concrete as opposed to uncertainty, so I want to give the example of “risk arbitrage” through buying into mergers and acquisitions.

According to this blog entry, 97 deals were completed, only 2 deals failed. However, many others remain unresolved and sometimes it may take longer than anticipated to close which doesn’t eat into your total profits for the trade, but does eat into your annualized profits since it takes longer for you to be able to reuse that capital. Since we are concerned in this article about profitability and pot odds, time will not be factored in. Even though almost 98% of deals closed, we will leave a bit more margin of error since some deals can linger on for years and then not close which could skew the numbers a bit. To be safe, we will say over 90% of deals go through and we can say that with pretty substantial confidence. At 90% chance of being right to win X and 10% chance to be wrong and lose 100% we must solve for X such that -.9x=-1*.10 or.9x=-.1 or -.1/-.9=1/9=.111111=11.1111%.

If you would lose 100% and win 11.111111% when you are right, the strategy of buying into these deals post announcement would be break even. So if you put your entire capital at risk, you would have the “pot odds” to buy any time there is a 11.11% payout or better. But when deals fail, they don’t go to zero, they drop down to around their pre-buyout price on average. This can change from deal to deal and some deals may just be in a constant downtrend.

If you had a downside of only 10% and an upside of only 5%, how would it compare with a trade with a downside of 100% and upside of 20%? You can confirm the expected value by downside of a loss (expressed as negative percentage) times probability of a loss plus upside of gain plus probability of a gain.

System 1 10% downside, 5% upside:

(-.1*.1)+(.05*.9)=.035=3.5% per completed deal.

(-.1*.1)+(.2*.9)=.08 or 8% per completed deal.

This shows why I don’t like expected value in comparing two systems, you risk insolvency by putting 100% of your capital into the trade with the “higher expected value” where as you only put 10% of your account at risk with the “lower expected value trade” If you were to risk 10% of capital on the 2nd strategy, you would only grow your portfolio by 0.80% per deal. As such the deal providing the better risk reward assuming equal probabilities of success/failure is almost always going to provide the better return on risk. You must evaluate system on an equal portfolio risk basis to truely determine which is better. The kelly criterion is a good metric for comparing one system to another on an equal risk basis. However, the kelly criterion should not be used for position sizing as it is probably 5 times more aggressive than it should be (or more) due to the false assumptions the formula makes about having an “infinite time frame”, a “certain, predefined known edge” and “complete emotional tolerance for all volatility that does not effect your edge” and that multiple bets at a lower percentage with a low correlation provides a better return on risk overall.

Additionally, if you could complete 12 trades a year in the 3.5% expected value system and the  8% per deal system took over a year, it would be much more profitable, so a raw calculation of “expected value per trade” must first be “normalized” (in this case normalized means something very different than “normalizing” volatility” as instead it means it should be set up to reflect the “normalized rate of return at a given level of risk” to reflect overall growth on portfolio given equal risk via position sizing). Then it must be also “annualized” so that they are equalized on a particular time frame after fees… However, due to uncertainty, you also must consider that the large edge that compounds fewer times is less vulnerable to small changes that may negatively impact the ROI more than you thought.

I don’t want to get any more complicated than I already have in this article, but for now I will tell you to practice by looking at your “risk” and your “reward” and measuring out your probabilities required to break even. For example if you have a target price that nets 3 times your risk, you need to hit your target 1/4 times in order to break even.  With options if you try to hit around “break even” on hitting your targets or even lower, the trades that expire in the money and have to be sold for a slight gain, break even and only a slight loss as opposed to the entire risk of the option PLUS the occasional trade that runs beyond the target will create profitability in the system.  I get into more specific and more realistic trading systems in part 2 and part 3.

Comments »