iBankCoin
Home / Monthly Trend Report

Monthly Trend Report

May Trend Report

One of the common trends that we all have heard is “sell and may and go away” but should one really sell in May?

It is an election year, so perhaps we are better looking at the normalized performance during election years.

In an election year, buy in may looks like a better strategy…

In the decade cycle, it looks like the low will occur after May, but that 2012, maybe sometime in the summer, is a great time to buy.

The last 40 years:

Sell in May is not a bad strategy, the amount gained from May to October or November is almost nothing, and perhaps it’s not worth the volatility. However, Selling in early June or late August can produce a bit stronger results.

Unless we are looking at the Nasdaq:

It looks as if Nasdaq will be good until July.

There may be something too this Sell in May strategy as buying in October and selling in May certainly produces results, Additionally many won’t manage the volatility through the summer as well, so avoiding that may provide superior results from a return on risk perspective. However, I don’t know that the sell in May is strong enough to overlook a “sell in August” strategy. But stocks aren’t the only thing we are looking at here.

However, certain areas certainly show selling has been best in may, such as Copper, although March or April would also have been good selling months.

Or Coffee:

Or Corn:

Or Live Cattle:

Soybeans in June:

Perhaps another reason to sell in May is that bond interest rates are higher at the end of May

Now the mutual fund cash levels are lower

July 2011 3.3% cash
August 2011: 3.4% cash
Sept 2011 3.8%R
Oct 2011 3.5%
Nov 2011 3.5%
December 2011 3.5%
January 2012 3.6%
Feb 2012 3.6
March 2012 3.3% (compared to 3.4% in March 2011)
Mutual fund cash levels have not been this low since July 2011, before stocks dropped 15-20% in a short time period. At this point, other than increased liquidity from the Fed, which isn’t happening yet, the only thing that can push the market higher is corporate cash being put to work, and the retail investor sending more money in. However, there’s a problem with this…. The “turn of month effect” is ending right now (5/3 after close), turning things negative.

Turn of month effect is the effect of stocks outperforming during the last 4 trading days of the previous month and first 3 of this month.

Here’s a look at the average daily gains.

Day Daily Gain Stand Dev
Fourth to Last 0.068% 1.064%
Third to Last 0.021% 1.055%
Second to Last 0.071% 1.037%
Last 0.088% 0.997%
First 0.118% 1.117%
Second 0.168% 1.065%
Third 0.155% 1.077%

For non stat buffs, standard deviation measures the range. As a general rule of thumb results have a 68.5% of performing within 1 standard deviation of the sample mean and a 90% chance of performing within 2 standard deviations, and a 95% chance of performing within 3. Each of those can be broken in half, so that a 34.25% of the results occur on the lower end and 34.25% on the higher end of the 1 standard deviation range. What’s more, that assumes “normal distribution”. In other words…

Day Low Range High Range
Fourth to Last -0.996% 1.132%
Third to Last -1.034% 1.076%
Second to Last -0.966% 1.108%
Last -0.909% 1.085%
First -0.999% 1.235%
Second -0.897% 1.233%
Third -0.922% 1.232%

Basically, a fancy way of saying, we really don’t have enough evidence to conclude with any sort of confidence that the turn of month effect really exists and is not just an anomaly that has occurred. If you look at enough data, you’re bound to find a mild correlation. You could flip a coin several thousand times while looking at your watch, and if whenever the second hand is on 30 heads occurs 60% of the time, you could easily think that the time has something to do with it, but it could be nothing. But there is a greater probability than not, that there at least is a positive return over this range, and a return that is greater than over the remaining time period. So although we can’t make any conclusions, the odds are slightly better that you may have an edge over this time period. The edge isn’t even that great if it’s true, but it’s still slightly more probable than not that one exists.

One Trend that is Shaping up is dow/nasdaq. Dow is very cheap relative to nasdaq as it was last month.

10 year Treasury prices remain around at all time highs as yields are below 2%. Bond Yields are in “contrarian” range in that they will eventually rise as they have fallen very significantly so since the early 80s.

Now technicals point to monthly overbought and possibly starting a downtrend. Weekly mixed signals so we will call it neutral, daily possibly about to turn bearish from overbought on further weakness. Early-Mid June points to a turning point.

Comments »

March Trend Report

Something is going on… Greece is defaulting, not defaulting, defaulting againhaving no official default event while still defaulting… it’s official, default CDS triggered!

Okay, old news by the time you hear it… but this is finally good for the stability of the market, as it may restore confidence to the CDS markets and at least the ability to insure the bond market may slow down the flight of capital out of bonds and into stocks to more stable levels. But with the vix this low already, you can’t exactly benefit from betting against volatility. Additionally, it is only short term. If anything, the longer term picture should see rising volatility as the structural problems of the Euro remain and the markets have been completely complacent regarding the Euro troubles.

Money poured strongly into stocks as capital fleas the bond markets. I was expecting the official default to restore confidence to the CDS and bond markets, but there are other reasons capital is fleeing.

US treasury yields are spiking in the short term. Will that cause problems if rates get hiked? For the short lived move, perhaps, but it means capital is flowing out of bonds, and it is not isolated in the US but is instead global. Gold+silver are showing early indication of potentially a big breakdown here that could produce a very significant low this year if it occurs. People do not behave rational in the sense that a lower rate causes them to borrow more. I have researched and found no evidence of such a correlation of lower rates=more borrowing. Instead, rate hikes can sometimes have the opposite effect as banks have more incentive to lend when they can do so at higher interest rates, and more incentive to find ways to promote buying of real estate, rather than stories of fear. Meanwhile, people see rising rates and want to lock in the relatively low rate while they still can, and they fear missing out a little bit more. I personally do not buy the “conventional wisdom” that rising interest rates are bad if it is happening for the right reasons. Lower rates has meant lower stock prices many times. So rising bond yields which could lead to rate hikes in the future, may not be a bad thing.

http://www.elliottwave.com/freeupdates/archives/2010/03/17/RATE-ing-In-Vain-Market-The-Fed-Is-Not-In-Control.aspx

Although those examples were isolated instances, the “insane” rate hikes of Volker era continued to see high inflation. Certainly interest rates going up or down doesn’t always pan out as expected. Money in any given currency is traded and treated as a commodity. Well higher interest rates cause problem when the debt has to be rolled over. Spain and Italy will face troubles as hundreds of billions of euros will be rolled with interest rates substantially higher. It’s like an adjustable rate mortgage on their home. That will cause an outflow of their national wealth, which perhaps is bullish for stocks, or perhaps the migration into the dollar will be too strong at some point and crash stocks and commodities priced in dollars. The primary beneficiary over the long run from the migration of capital out of bonds should be stocks, and with interest rates heading higher, it would not be a surprise to see the rally continue. It is not as if the dollar has crashed hard from the 2009. It has lost about 15% since the dollar’s peak while stocks have more than doubled since their bottom. The stocks have gone up over 30% since October 2011, while the dollar lost only about 2% of it’s value. TLT has lost 12% of it’s value since then. dow/gold is up 33% from it’s august 2011 low. Money is flowing into stocks, but how much longer until we see a pull back, or worse a reversal of trends?

Capital is fleeing government debt and into risk based assets. With that being said, certainly there are major concerns, particularly for stocks right now.

July 2011 3.3% cash
August 2011: 3.4% cash
Sept 2011 3.8%R
Oct 2011 3.5%
Nov 2011 3.5%
December 2011 3.5%
January 2012 3.6%

Mutual fund cash level have remained historically low but historically there still is a lot of cash on the sidelines of hedge funds and of course retail investors missed out on the rally. So perhaps this may be a bit misleading.

RSI is overbought on a daily and weekly charts

Slow Stoch is heavily overbought on daily, weekly and monthly

We still remain in an upward trend and as I have warned previously, uptrends tend to stay overbought longer than downtrends can stay oversold. This is why the strategy I have mentioned is to allocate “risk on and risk off” accordingly, rather than shifting to negative risk or shorting the market.

The long term look at treasuries appears to remain a good contrarian play, and perhaps it is finally breaking here. The more heavily allocation towards the dollar and currency ETFs and away from US treasuries has paid off. The recognition of FXI being more overvalued than SPY in the Feb trend trader, may have provided some with a short that made money despite the market melting higher as well as provided some value long names, of which many have done well. It also would have provided you with a look at some currency names that may have held up relatively well. I would advise raising a little cash from both trades.

I have a feeling we could stay overbought for a little longer here, but I’m not willing to bet on it heavily either way. I tend to think a top is coming and that the similarities of 2007 are slowly starting to surface with rising gas prices, stocks ignoring overbought signals and an election not far behind.

The relative strength in the dollar (making higher lows since May 2011), even as the stock market makes new highs, and the inflation trade doesn’t seem apparent globally or domestically with gold and silver breaking down as the dollar holds up.

This is telling me that capital is migrating into the US, and globally is still finding it’s way into risk assets.  Perhaps individuals are selling assets (which are priced in dollars, and with global reserve currency in dollars tend to first liquidate to dollars), in commodities and bonds and foreign currency, and raising cash while still entering into stocks. It seems that way.

Some plays for the long term… short treasuries, long dollar, long currency etfs, long natural gas long term, short gld+silver, long dow, short nasdaq (a bit dangerous as it could produce a parabolic blow off top like in 2000.) Otherwise scan through the trend trader for some ideas that are undervalued long term and won’t hurt you to rebalance if we go lower, and perhaps run a screen for upwards earnings revisions. I believe if we don’t roll over relatively soon, JUNE is probably the month to watch for a peak.

Unfortunately sometimes the last part of a move is the strongest. for this reason, I speculate in options every now and then when the VIX is low, rather than expose myself in stocks directly. If it is a big blow off top, then I will gain more with a smaller amount of leverage. If not, I may lose a significant amount, but not significantly more than I would have. if I am less aggressive, my downside will be less and my gains will be nearly the same or about the same or slightly more..

Comments »

Mini Monthly Trend Report Market Update

Money is pouring into stocks, particularly financials right now, Central Banks are buying US equities, oil is set on fire and the stocks, especially the leaders held up strong in the face of metals like Copper and Gold and Silver tanking yesterday.

Well the market also gets pushed further into risk with the low yields, the Soverign Debt Defaults and “not actually a default” ruling and the people starting to realize their CDS are as about as worthless as the subprime derivatives and negative real yields make bonds not so great.

All the money sitting around gets pushed into stocks, parked into real estate, and sheltered overseas away from the money squanderers in government in the west, and instead into the benefactors. Well US companies benefit from cheap labor overseas, entitlement spending at home and stimulus to the consumers, devaluation of individual wages and many of the american companies are expanding globally to markets that benefit from the spending and exporting of the capital via debt interest payments to creditor nations. Oh certainly bonds outperformed in the last 30 years but following a 30 year trend, 30 years into it is insanity. Don’t get me wrong, the “risk off” trade is still to US dollars and bonds, and so some TLT position to take advantage of the “risk off trade” is perfectly fine, but I certainly wouldn’t want to be reaching for yield at this low levels. I understand some older people need income for retiring, but I would still rather put a significant amount of my money in high yielding stocks t this period of time. You do not want to follow the trend of baby boomers moving to bonds because it will not last. The yields are near or at long term extremes. Compare stocks to bonds and stocks are for the first time in a very long time, finally at least reasonably priced relative to bonds. Relative to real estate bonds are just barely at what I would consider extremes as well.


I believe that is the long term trend that we have in store for us but lets be honest, even with all that going on, how can appl continue to act like it is a small company that just smashed earnings by 100% and is just starting to get recognized by institutional investors every single day? It’s not that it isn’t undervalued but how often do stocks go straight up in the air indefinitely that are already $500 Billion dollar companies?

Although I refuse to put a large % of my overall cash into this nonsense until we get a meaningful correction, that does not prohibit me from occasionally getting aggresive via OTM calls. And the Financials are breaking out, or BTFO as RC likes to say.

The Nasdaq is nearing extremes

Look for a break in trend and a shift in the nasdaq back to the dow, or else wait for dow/nasdaq to get below 4 before playing (as a contrarian play).

I will have the rest of the March Trend Report Up in a few days, for now just some minor observations and highlights.

Comments »

February Trend Report

Mutual fund cash levels

July 2011 3.3% cash
August 2011: 3.4% cash
Sept 2011 3.8%R
Oct 2011 3.5%
Nov 2011 3.5%
December 2011 3.5%

historically very low

10 year PE 22.47 (EP yield 4.45%) Historically slightly higher but still reasonable.

S&P div yield 1.97 (historically low)

10 year treasury around 2% (historically near all time lows)

The stock market has recently taken off. Although the monthly chart is now confirmed bullish on the parabolic SAR and MACD histogram is close to turning bullish, the monthly chart is overbought at the same time it is turning bullish. Meanwhile the daily and weekly charts are egregiously overbought.

So although there may have been a very brief period of time to get a bit less cautious, that time is quickly changing.

Holding treasuries is perhaps even more vulnerable as the RSI as well as the slow stoch is overbought.

So what is one to do? This is where focused effort can be placed into looking at correlation and a margin of safety. Risk off should remain a fairly large portion of your portfolio, profits should be taken in both risk on and risk off and cash should be raised.

If you seek to trade, you can use daily, weekly and to some extent monthly signals on individual etfs. However, if you are less concerned about trying to time the market and less inclined to rotate your portfolio through trades, you should look to find a margin of safety and undervalued names as well as look at the monthly chart. A bit of both methods perhaps is ideal as it will cut down the correlation of your portfolio even more, and allow you to invest with multiple time perspectives in one portfolio.

Your long term return should seek 3 things things. One is a high Alpha at all times. You want to identify securities that are trading well below their value to buy. (You also may seek those that are trading well above their value to sell) This is “seeking the outliers” in the following chart. It is buying $1 for 50 cents.

The 2nd thing is basically to shift the beta based on market conditions. This is timing the market as a whole. You can either shift into selling a greater percentage of assets that are overpriced, and out of those that you own that are underpriced, or you can use index ETFs to shift assets. 
You want a higher beta when the probability of the market trading higher is large, and a small or negative beta when the probability of the market trading higher is low, assuming all else is equal.
I prefer to monitor my correlation to the S&P and aim to reduce it when the market is vulnerable, but also I use a balancing act between general ETFs such as the TLT, UUP (and other currency etfs) and SPY,QQQ,FXI and other index etfs.
Generally you want to watch the market trend and the overbought/oversold signals on multiple time frames to keep everything in perspective and to reduce your position size of risk assets when the market is vulnerable to a correction, and shift into more aggressive holdings and a larger beta when the capital is shifting into the market.

The third thing is to monitor overall correlations among your assets. This is often overlooked, but the thing that is important is to reduce your correlation. When the markets crash, the people that do best are those that have assets that are not strongly correlated with the market. Many assumed the subprime mortgage crisis would not effect everything else, but in fact it did. There was a greater correlation than people realized and those that thought they were diversified by holding stocks of different kinds were in trouble.
This can be illustrated by the following using a bit of thought.

You get a greater return by 2 independent bets at 1/2 the "optimal" bet. Therefore, more independent bets provides superior long term returns. In the stock market everything has a correlation, so no bets are really completely independent at the same time. However the closer the correlation between multiple assets to zero and the closer the return/risk of these bets, the more these principals come into play. So aside from shifting your beta while maintaining a high alpha, you also must be diligent to be sure you can do your best to reduce correlation. If the future were completely known and you knew where every stock and every asset would be, there would be no need for diversification and reduction of correlation. If the future were completely random, that would be all that matters, so some of just how correlated you are depends upon how accurate you are as a prognosticator and how clear your crystal ball is. The same goes to how much you ramp up your beta when you see the future in stocks as a bright one, and your individual skill as a stock picker should depend on how much effrt you spend in selecting individual names vs broad index funds. I will try to reserve the trend report for helping assess where we are and how to plan (beta, allocations among large general classifications, correlations), where as the trend trader will be reserved for assessing individual assets among those groups.
I would continue to remain defensive. Your beta should remain low. Your correlation to the market should be low or even negative at this time. You should run through each asset you own relative to every other asset.
There are two types of correlation, one how your overall portfolio correlates to the market. The other being how your overall portfolio correlates to itself. Unless you have certainties about where stock will go or a high level of confidence or an extreme amount of difference in value, you generally always want your portfolio to have close to zero correlation with itself with multiple assets.
But the shift of risk relative to the market sometimes referred to in some situations as "beta" has to do with the conditions. Bullish conditions should have a higher beta and higher correlation with the market. Beta also refers to leverage where this correlation calculation does not.
http://www.sectorspdr.com/correlation/

How much you shift your beta depends not only on conditions but on how aggressive you want to be. Generally I might say that a uptrend monthly chart with an uptrend weekly chart with both overbought should be perhaps slightly more bullish than a downtrending monthly chart with an uptrend and overbought weekly chart. However we are more overbought than before on a weekly and daily level so it’s relatively moot.

If you find it difficult to reduce your positions, one way to do it is through shorting an index ETF. I tend to try to avoid owning overbought markets so I will sell them and do my best to rotate into somewhere less overbought. Regardless, the art involves alpha, beta, and the right balance of correlation. It is no easy feat, but if it were easy, there would be no one to take the other sides of our trades, and no fiscally irresponsible money manager to lose through volatility over time for us to gain. Which brings up the question, why help other traders? First, sometimes a little information does the people you teach more harm then good if they do not apply it correctly, or only apply some of your teachings. There is a saying that a little knowledge is more dangerous than none at all, because it can result in the overconfidence that leads to ruin. Secondly, because there are trillions of dollars in the stock market, many people already know this so the damage you do by helping is negligible, and the gain you get from sharing and learning the knowledge yourself is worth it. The people who teach the information they learn, learn better and recall the information better. This is why I don’t mind blogging from time to time, while giving myself a journal of sorts to look back on as well.

February

commodity valuations
http://www.wikiwealth.com/commodity
commodity etfs
http://etf.stock-encyclopedia.com/category/commodity-etfs.html
currency valuations
http://www.wikiwealth.com/country
currency etfs
http://etf.stock-encyclopedia.com/category/currency-etfs.html
bond etfs http://etf.stock-encyclopedia.com/category/bond-etfs.html
   
reits etfs
http://etf.stock-encyclopedia.com/category/real-estate-etfs-reits.html
resource etfs http://etf.stock-encyclopedia.com/category/resource-etfs.html
   
asset allocation etfs
http://etf.stock-encyclopedia.com/category/asset-allocation-etfs.html

Comments »

January 2012 Trend Report

See also the 2012 trend report.

Stocks remain in a monthly downtrend, but a weekly uptrend although the weekly uptrend is now overbought. The economy is in a very vulnerable position here.

It starts in Europe. A sovereign default occurred in Austria in 1931 that kicked off a wave of others and the great depression. Some chatter is heard about the problems in Europe having similar consequences this time around.

The problem is with Spain and Italy as they will likely roll their debt in 2012, yet the interest rates have risen drastically in the last Q of the year so this will be costly and their debt will rise.

Meanwhile, in the US we have large trade deficits and debt to GDP of over 100%, unfunded liabilities over 100T but the 10 year treasury yield should close this month at an all time low as it currently is 1.91%.

Additionally there is a lot of old debt coming due. If we look at the peak in debt in 2007 in the United States, only one slice of the real money supply, the general leverage stood at nearly $60 trillion. So if you think $3T will put a dent in that, you are saying that leverage only declined by 5% from 2007. There is mark to market accounting, so any official numbers will be inflated. Put even 25% deleveraging and there will be no inflation from QE1 and QE2 as the 15T in debt destruction will put deflationary pressures and foreclosures and bankruptcies and shortages on payments, meanwhile the new debt being created can potentially lead to inflation in other areas, or the combination of “stagflation” as Milton Friedman once predicted. Perhaps that will not come in the US as interest rates are currently at all time lows, however, it seems the global economy is interdependent and we risk a global contagion from what may play out in Europe. It would surprise me to see slow growth, high unemployment (which we have) and high inflation (which we have in terms of real goods).

Not helping the situation, is that there isn’t exactly a lot of cash and room to spare in terms of the market.

Liquid Assets of Stock Mutual Funds
Percentage of total net assets
http://ici.org/research/stats/trends/trends_10_11
July 2011 3.3% cash
August 2011: 3.4% cash
Sept 2011 3.8%R
Oct 2011 3.5%
November 3.5%

With cash levels low, if there gets to be a shortage of liquidity, and people start to withdraw money from mutual funds, they will be forced to sell, which will further depress prices, causing others to want their money out. It really won’t take much for capital to flow out.

Here is where the trends are at…

daily overbought

weekly overbought

monthly downtrend and bearish divergence

TLT looks significantly overbought but potentially making one final parabolic push with room to go higher for the time being. Volume is going parabolic.

Treasury all time lows hit on a monthly close below 1.94

10 Year Treasury Rate Chart


Even gold looks vulnerable

Don’t get me wrong, gold has sold off significantly already, it never made a parabolic move as it stayed within it’s trend channel, and still might… I am not exactly ready to bet heavily against it, but with the deflationary scenario we face, and all the buying pressure that has occurred in gold over the last 10 years, don’t tell me it is immune and isn’t at least vulnerable to a constructive correction here.

2012 is such a significant year. The euro could finally collapse, because skyrocketing yields will lead to budget shortfalls, riots occur when they even talk about austerity, now they implement it, costs of entitlements around the world hit as the baby boomers hit retirement age and more start to get social security checks. Austerity measures will take place and government will lose control of the people in Europe.The capital flow into the US will seem like everything is great as US treasury yields will potentially go even lower in one final run, as tlt goes parabolic, but then what? More people are buying treasuries than ever, but that buying pressure cannot continue forever. The time to own treasuries would have been over the last 30 years when your yield was over 10% when treasuries outperformed stock in what seems to be a very atypical result. The time to exit gradually is now, particularly into a strong move upwards and a panic in Europe. The time to short treasuries may finally arrive, particularly near TLT 140.

I believe a major buying opportunity will arrive, maybe as early as June, maybe not until 2013. Particularly in real estate.

Comments »

December Trend Report Update

I haven’t yet put out this December report until now because we are testing the boundaries and I wasn’t sure if we were going to see a new signal. We are very near overbought on a weekly chart and we are testing the upper boundaries of the downtrend on the monthly chart. With a significant enough move upwards the trend will change on a monthly basis, but with smaller a move upwards we will reach overbought in the weekly charts without changing the monthly trend. Much of this could change relatively quickly to signal that you should be either more cautious (overbought weekly without a trend change in monthly) or more aggressive (If a new uptrend on the monthly chart is signaled. But being that we are 7 days into December, if I wait until a signal changes there will be no December report at all so I will just tell you to be flexible in this volatile market that does not need much volume to fuel large moves due to the low mutual fund cash levels.

Additionally, I will be providing a more detailed trend report for 2012 later.

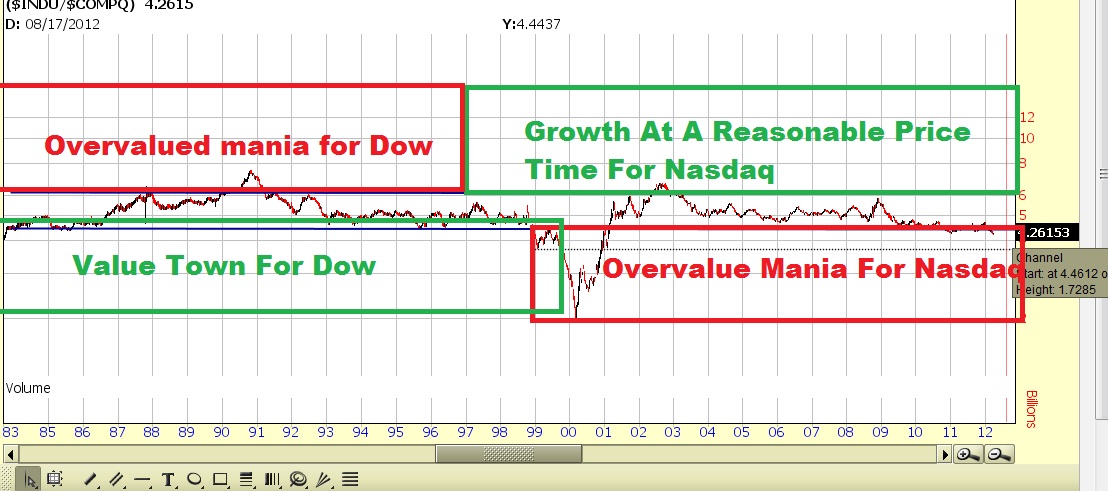
Some contrarian signals worth keeping an eye on in the future will be that dow/gold is fast approaching the long term support and I suspect we see gold pause in 2012


Also relevant is that it is down in the 50 to 90% range decline that you tend to see when bubble’s deflate. However, dow/gold has a history over the last 100 years of making such extreme moves, so perhaps this could be considered somewhat “normal”.

The 10 year treasury yield is coming off bubble highs that are not typical and are now also in the 50% to 90% decline range. Although there were days below the level, it has so far failed to produce a monthly close below the Jan 1941 low of 1.95. Right now it looks like we are essentially testing the lows on the yields.

keep track of updated 10 year treasury yields here.
I believe betting on higher yields is probably not the best idea when the market is looking weak, although there is still a chance yields could perhaps bottom in 2012, but more importantly it represent high risk in bonds that many people may not be aware of. Additionally, Low interest rates typically mean low expectations for stocks and growth as investments are bought on a relative basis. If you get a 3% yield putting your money in the bank and a 5% yield for a 10 year treasury you will need more than just a 7-8% yield to justify investing in stocks. Stocks will need to be more undervalued to justify the investment, or the expectations of growth must be higher. However, if you only get 1% interest at the bank and 2% interest in a 10 year, a 7-8% yield seems much better, and stocks should be considered much more attractive when bond yields are low (if you still expect them to yield 7-8% overall return), especially if expectations of growth rise in the future as wealth transfers out of bonds and into stocks.

Mutual fund cash levels are still near significant lows which is in contradiction with dow/gold and low interest rates being at ‘lows’. As a result I suspect we could see an extreme move at some point until these contrarian indicators are more in agreement. The path of least resistance seems to be lower, taking mutual fund cash levels higher… As the euro problems eventually reaches some kind of culmination at least in the next few years.

Liquid Assets of Stock Mutual Funds
Percentage of total net assets
http://ici.org/research/stats/trends/trends_10_11
July 2011 3.3% cash
August 2011: 3.4% cash
Sept 2011 3.8%R
Oct 2011 3.5%

(november 6.4, December 6.6?)

“The surveys of 56 leading investment houses in the United States, continental Europe, Britain and Japan showed a typical balanced portfolio held 6.6 percent of its assets in cash, its highest since at least December 2010, from 6.4 percent last month.”

http://news.yahoo.com/investors-brace-2012-higher-cash-stocks-reuters-poll-142220114.html

I don’t know if the spike up in November and December based on the survey can be reliable, but if so they have at least begun to take measures to raise cash and it would be a lot more healthy time to own stocks if true than it was in July.

Levels are still fairly low. This means there isn’t much left funding the rally and that the market is both prone to volatile moves as well as an eventual correction, or temporary bear market. Much like the end of any bubble when there is no longer cash to fuel the rally, a panic is more probable in this environment than in an environment where there is lots of cash on the sidelines. However, that is an over simplification as mutual fund cash level is low because money is flowing in and the federal reserve is currently expanding the money supply. The question is whether or not both public and private debt will continue to rise at a fast enough rate to increase the money supply. At some point it is likely it will not, which is why this is such a contrarian indicator that is more a signal of caution than a signal to trade on.

With Macroeconomic environment structurally unsound and the ECB forcing the rest of the world to print rather than making the ECB have the ability to have a more elastic money supply, they are delaying what should turn out to be a pretty significant problem at some point. I think we will see destruction around mid 2012 before a very significant low takes place most likely both in yields and real estate and possibly stock prices. The federal reserve’s actions have lulled mutual funds into complacency. You really could argue the decline of cash reserves has been in play since the early 90s
. That certainly doesn’t have much on the 30 year decline in bond yields though which I think is most likely out of these to bottom in 2012, which means bonds are actually quietly becoming a “higher risk” investment (relative to it’s return) in spite of people viewing them as the contrary.

This could be seen as a bullish trend in treasuries, except for the fact that much like treasury bonds, it is historically very low and the trend is getting stale, and it too has declined well over the 50% requirement for a bubble to deflate, and the yields have the clear characteristics of a blow off climax, exponential top that a bubble has, followed by a sharp decline of over 50 to 90%, which hits the previous lows or undercuts the lows.

You probably don’t want to chase multidecade trends, but if you must, there are often a climax bottom/top to close your positions into, so hopefully for those chasing there is that parabolic move. It is an aggressive strategy, but perhaps worth considering the “greater fool” strategy if you are good at the financial game of chicken.

Believe it or not… not much has changed since the November Trend Report in terms of price trends in stocks. The stock prices continue to trend up on a weekly chart, and still have not broken the boundaries on the monthly chart. The limits are being pressed though and significant movement to the upside this month should reverse that trend. However the weekly charts are nearing overbought levels. In fact according to the slow stochastics, the dow is currently just barely overbought. The daily chart shows slow stochastics are at overbought levels as well furthering the case to be made of reducing risk. I would take profits into this strength and remain cautious. As we close out the year, I suspect the market will be vulnerable to a cascade downward sometime in 2012, and perhaps a panic if the ECB continues to print until eventually they run out of money (unless they are given the power to print an unlimited amount, something the Germans seem to fear) in spite of the already low treasury yields in the US and low expectations. If you got more cautious near overbought levels and then you rebalanced and got a little less cautious you should be able to ride the wave the right way.

There are many issues involved and eventually it connects towards being a political problem.

Things to look for to change the structure of the problem are
1)The ECB is given power to operate more like the Fed with an elastic money supply (power to print at will to prevent a bank-run).
2)A central Euro Bond is created
3)Mutual funds raise significant amounts of cash over time so that a sell off doesn’t risk further selling by everyone simultaneously.
4)The structure of leverage needs to be greatly toned down or it needs to be clear who can cover the obligations.

If an investment bank that sold derivatives to someone and the bank suddenly can’t pay, who fits the bill? Does the person buying derivatives even know who has the other side so they know whether or not they will get paid back or so they can attempt to price in the risk of not getting paid? Or do they just assume everything is okay and become complacent? What about those betting heavily on the decline of the bank that goes down, now how many more people betting against the failure on excessive leverage are in trouble? What about people with deposits at the bank who’s deposits were used to speculate on derivatives? What about all the debtors if you suddenly have a shortage of the cash? Bank runs would previously happen when something like 6% of the overall cash supply is withdrawn all at once, and the fed was designed to step in to prevent this from happening. The ECB has a limited ability and could eventually run out. But there also is some amount of change in each derivative’s underlying asset value that if exceeded, a derivative run could occur (depending on the derivative, the exposure, the overall amount of leverage, and how connected each asset is to each other and each investment bank is to another and so on). Well judging from the last bailout, it appears that tax payers and consumers and eventually bond holders are on the hook to some degree. Not 100% because Lehman didn’t get bailed out. TARP money and AIG bailout and Bear Sterns via non recourse loan by the federal reserve and what have you.

5)If the federal reserve is just going to print the money, this could bring up another problem of skyrocketing debt to cover the panic type events, and if so it is more reason why debt should only be allowed in times of national emergency, because how can you suddenly fund payments for potentially as bad as many times the global GDP without consequences? But realistically, that is not the system. The system does unfortunately have the side effect of perhaps too strong of central government.

There are many structural problems that can’t easily be satisfied without reform, but extreme reform that essentially would ipe out the system to start over would probably be too destructive.


While the weekly chart is actually showing a bullish divergence as it makes higher highs in the slow stochastic while price makes lower highs, the monthly chart continues to show higher lows in price while the RSI makes lower lows. The price action is not to be trusted.  The important thing remains the trend which also is in conflict with the weekly chart showing an uptrend still. The monthly trend is more accurate and results in greater moves but a longer time period. However the weekly is still to be respected. The allocation in the trend trader is cautious and will get more cautious if we hit overbought on the weekly chart without breaking the monthly trend. Additionally, it is worth watching the trend channel shown above, although you should still be cautious because of the likelihood that this is going to be a false move due to the bearish divergence, you should still watch the key levels of support and resistance, perhaps to slightly adjust or use it to rebalance and reassess your positions. I believe a decline is still coming, but you must remain flexible, and betting against assets going up is traditionally a low probability trade unless everything lines up, so the alternative is to have a larger “risk off” position and minimize the “risk on” position unless the ideal set up occurs. Unfortunately Things just aren’t in alignment to make that kind of bet. Instead, being cautious and participating in a mixture of “risk on” (stocks, gold, oil, commodities, etc), “risk off (currency trades, US treasury bonds, Cash) and relatively “delta neutral” (complex options strategies, or else arbitrage plays, bullish and bearish bets in anticipation of earnings, pair trades, post earnings pair trade plays, etc), with a cautious or aggressive weighting depending upon the signals you are getting makes sense. At the moment it is one of caution. Should the crisis escalate to panic due to a number of things such as euro problems, defaults, or further US downgrades setting off fear of a global contagion, not only risk on assets are at risk but even potentially some arbitrage deals that may be dependent upon financing may have difficulties. Others may get cold feet… If possible they will find a way to weasel out. Such recently happened between Skyworks Solutions who was going to buy out Advanced Analogic Technologies. Skyworks made accusations of “fraud” and that the numbers weren’t correct. Advanced Analogic fired back with a counters that they weren’t honoring the terms of the agreement. Finally Skyworks Solution said it would buy it for a slightly lower offer ($5.85 instead of $6.0+). In another deal TAM and LFL were in agreement of a deal until a regulatory investigation delayed the deal “6 to 9 months” and that the merger would likely not take place until the 4th quarter. It still has not gone through. This type of things happens. Deals still go through they just get delayed. This makes using options as leverage to beef up these returns more risky, esp when the market is vulnerable, and the annualized return could end up significantly lower than initially expected if the deal gets delayed. As such, these “risk arbitrage” plays are not as “neutral” to market conditions as you would ideally hope, especially when market is vulnerable, however they do still have the ability to help to lower your correlation and boost your return in all market conditions. They do have a very high success rate in all conditions if you don’t measure a “delay” or a lower offer as a failure. Talking about arbitrage is something that books have been written on and cannot be covered briefly, but the concept is the important part. The concept is that REDUCING correlation is often productive to boosting your return on risk even if the return of that other asset is less. Some misunderstand this and say “diversification” or slightly better “multiple asset classes” for this same reason, but that only sometimes and only partially reduces your correlation. A portfolio with a return of 7% gain with a 2% drawdown is better than one with a 10% gain and a 4% drawdown. Use leverage and your 7% return becomes a 14% return with roughly 4% drawdown (plus leverage costs), or use less leverage and be somewhere between if you can’t handle it. The return on risk is what is important and the LEVERAGE is what you use to determine the magnitude of that risk/reward profile that determines your return. Reducing correlation through relatively “delta neutral” strategy(such as arbitrage), as well as owning a mixture of “risk on” and “risk off” is a great way to boost your return on risk. Now taking the THEORY of this and putting it into practice is another issue. If you pick individual stocks, there are risks among those companies. You might have the downside of investing in some bad companies in with the good if you just pick an index fund such as the SPY, and you might take on stock’s individual risks to a limited degree but you avoid the risk of a real shocker that can wipe out a huge portion of your cash such as accounting fraud, or an FBI raid and findings of illegal activities, or a major lawsuit, etc. Increasing positions reduces this risk but has the cost of a lot more fees and it is more difficult to manage more positions and you risk making mistakes. So it’s a trade off you have to deal with. I prefer using ETFs mostly with a few occasional individual value stocks with a small amount of capital and even smaller amount of “option gambles”.

In conclusion of this trend report, a lot of cash and “risk off” assets are advised and confirmed with the monthly trend. The “arbitrage” deals must be picked cautiously and you should make sure they are not heavily dependent on financing.

Comments »

November Trend Report

To not at least aware of the bleak picture with mutual fund cash levels as low as they are would be a bit reckless.


So we start with not just the “long term” but the “wake me up from my coma when I give a crap-Long-term”. That is the contrarian indicator that is useful on a multiple-year or decade basis. So we start with this in mind. If mutual funds have the power to fuel rallies, they have very low power when they hold little cash. However, this sort of behavior results in low volume needed to create big moves and for volatility to be at a high in terms of daily and weekly fluctuations. This helps explain why HFT accounts for so much of the volume and why the markets seem so batshit crazy volatile lately.

Batshit crazy I tell ya!

For now the August data is available
http://www.ici.org/research/stats/trends/trends_08_11
July 2011 3.3% cash
August 2011: 3.4% cash
They’re lagging a couple months behind but September data should be available soon I believe, ici.org should have it up.

Is there a fundamental reason to be bullish? on a long term basis? Well, if not for this being an abnormal cycle with coked up leveraged banking and sovereign debt problems we would be quite a few years into the business cycle. Since the full cycle lasts about 8 years, and 2007 was the top in at least the markets and arguable economic contraction started thereabouts, the next peak of economic expansion is potentially somewhere around 2015. However with that aside, I am going to need to see cheaper prices first.

So is there a reason? Not really…. At least historically there is a reason to be less bullish than usual. The 10 year trailing PE attempts to smooth out some of the volatility and identify value for long term moves. Right now it is neither undervalued nor overvalued, but more overvalued than undervalued if you look at stocks since the removal of the gold standard. If you look at stocks over the last 100+ years, it is overvalued. The 10 year PE is around 21, just above the mean of 19-20 or so since the removal of the gold standard, and above the 16.42 long term historic mean
http://www.multpl.com/

Since this is not at extreme it really doesn’t mean a whole lot, plus it completely ignores treasury yields and dividend yields and growth rates so unless we know whether to expect multiple expansion or contraction or if it’s at extremes it’s not really important. With that being said the trend seems to indicate multiple contraction for the time being but that could change at any moment. I believe mutual fund cash levels is a much more ominous reading than the PE at current levels. In combination shit’s not all roses.

Let’s look at the charts.

Historical comparisons can be drawn to the following date/s based on monthly charts only

Bearish:December 2008, April 2000,Dec 1929 , And June/July 1937

Relatively Neutral: September 1981

Bullish: dec 1987,sept 1998

Some fit better than others. The RSI is not nearly as overbought like it was in 2008 or 1929. Although certainly closer, it is not even as bad as 2000 or even 1937 (although technically I feel this is the most similar) so we would not expect things to be as bad. However things are more overbought than the remaining. 1998 is similar however it lacks the 3rd month of increasing momentum. I feel the best comparison is June or July 1937. Observe.

I didn’t line the charts up exactly but you can see the sharp decline from overbought in the slow stochastics until it is lower even though stocks made a lower high. You see the 3rd month in a row where the MACD histogram was down, and 3rd month in a row the parabolic SAR was down. The RSI made a similar move from just/nearly ovebought to a lower low.

Sector Trends:

Utilities is the only area with a technical uptrend intact using the sector SPDR etfs. Even Utilities appears overbought though. Everything else is bearish confirming the long term bias to the downside.

The following represent decent fundamentals

http://www.wikiwealth.com/company:healthcare
http://www.wikiwealth.com/company:staple
http://www.wikiwealth.com/company:telecom
http://www.wikiwealth.com/company:utility

Industries in a monthly uptrend: This section is under construction. Do your own research.

In down trends on a monthly basis it represents periods of, or anticipation of economic contraction, and flushing out the leverage. Cash becomes king, which is partly why aside from bonds, Utilities remain strong due to their strong cashflow. However

Sorry to shit on your Europe haircut party…

…where everything is solved or so is the hope but reality is as long as there’s 1 currency yet multiple bonds for each country, it remains to be seen whether this will be a powerful enough event to change the long term trend. I doubt it.

(don’t ask me who that asshat is with the shit for brains haircut, I don’t know)

Like in 1937 I believe we swirl down the proverbial toilette(sic) and wipe the smug look off of the perma-bulls. However, we certainly may rally and retest the boundaries of the trend in the next couple of months first but I do not think we break through.

The trend report is not to discourage you from day trading or swing trading, but it is to make you aware of the longer term picture so that you can make subtle adjustments either holding larger or smaller amounts of cash where appropriate and/or reducing position sizes or adding stops and moving out of the way of buying the dips as aggressively, to avoid August 2011.

I didn’t have the luxury of having my own blog on a premium site like IBC or even a PG lately so I posted here.

http://stocktradinginvestments.com/author/hattery/

Sorry unless you were part of the few dozen viewers or whatever the fuck, you missed out. My bad, you trailer trash turds, now quit jacking off to the batshit crazy picture of Britney and go do something useful with your lives. And slowing people down on the way to work trying to change the world by holding up stupid ass signs no one cares about doesn’t fucking count…. Unless you’re this guy… Fly is that you?

In conclusion for the 2 people who got this far and are still reading, shit is probably going to hit the fan sometime within the next few months, Adjust accordingly. You probably won’t though… 6-8 months from now you will all wonder why the fuck you bought the last dip before stocks went 20% lower.  I will keep you updated to let you know if the trend changes, but for now the long term direction is lower first. Buy the dips at your own risk, or else the space alien magician might harvest your organs and eat your brain for an appetizer while screaming “ack, ack, ack” and Netflixing Whitney Tilson.

Comments »