iBankCoin
Home / Tag Archives: trading

Tag Archives: trading

Neo Enters The Matrix

I’m going to continue doing some work to improve the OABOT 2.0 a.k.a. “Neo”. Neo has been removed from the matrix of the market data and now must begin to be trained “how to see the code”. To start with Neo needs to develop how to discern reality from illusion which means being able to remove the setups that get him in trouble and add skills like a Kung fu master so that he can identify when to strike.

matrix_morpheus_red_blue_pill

The next optimization step is ATR divided by beta. Beta is a measurement using I believe a year’s worth of data to measure average movement. ATR is a measurement of average price movement in dollars over the last 14 days. ATR divided by price gives you an average percentage move. When ATR is small relative to beta, in theory it suggests a more recent consolidation and range in the last 14 days than is typical. This is common among consolidation patterns.

In theory this should give you stocks moving less in the most recent 14 days than in the prior year.

next

So I made major changes to the scoring. What I noticed was the setups that I was getting tended to be a little bit longer developing.

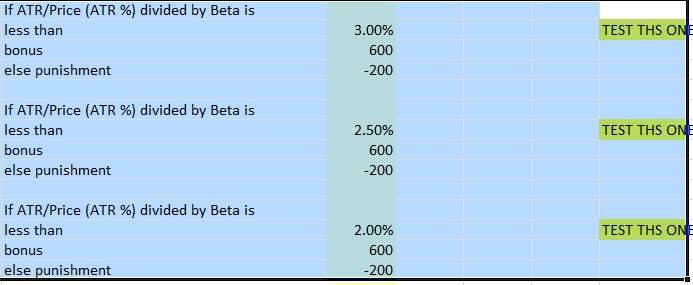
The best patterns began to show up as I got after around 300 names. This suggests the punishment knocked off a few good names and the reward also rewarded too many bad setups. In other words, compared to before, the score is too high and not as important as some of the other variables. However, it may also be that the score is important when ATR/price divided by beta is less than 3% but much less important when it’s less than 2.5% and 2%. In fact, it’s even possible that taking an extreme reading like less than 0.50% and punishing stocks for being in that tight of range will eliminate many of the merger/aqcuisition types where the stock has a ceiling equal to the buyout offer and thus it doesn’t hardly move at all over 14 days. This can be tested later. For now I have to get through the main scoring and worry about that later.

Next test 1/6th the size 100/-33. I definitely thought the results improves from the 600/-200 but the original 12/-4 was still better. Now is something like 12/-4 optimal or is something like 20/-6 better? Or perhaps 4/-1 is more optimal. For now I’ll just return it to 12/-4 and leave a note to test 20/-6 and 4/-1 to try to improve it later. The effort to try to optimize this seems less worth the effort than to optimize other criteria so that’s all the work I need to do for now.

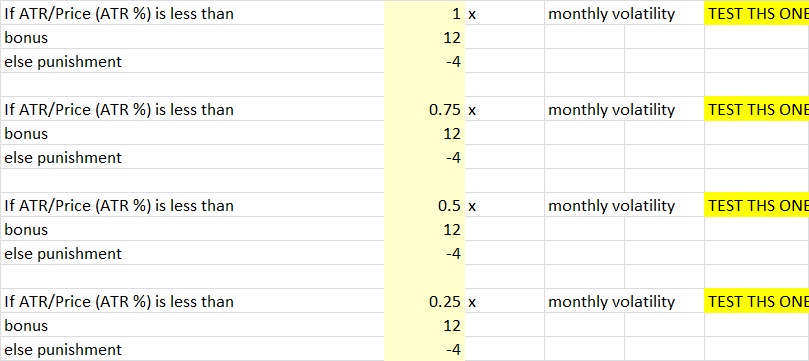
Now we have ATR vs monthly volatility. ATR measures average move over 14 day. Monthly volatility measures 30 day volatility. If 14 day “volatility” (in the form of average daily move during that timeframe) is less than 30 day volatility it should represent consolidation if they are calculated in similar ways. This is similar to the first test we did where we wanted weekly volatility (7 day) less than ATR/price (14 day) except now it’s 14 day less than 30 day and represents a little bit longer time horizon of consolidation. I think this is one we’ll want to switch to a larger score than we did last time. Prior to changing it this was the settings.

next-test

Last time with the 7 day / 14 day I may have started with too small of score even though I thought the score was pretty massive. It would have been better if I started with 1000/-750 just so I could rule out a higher score then I’d have a better sense of direction. Instead I went with 200/-150 and now I have to test 400/-300 and 100/-75 instead of just one additional test.

So I’m going to start this one off with 1000/-333. There certainly were some good setups. But also some not so good. In fact, some of the highest scores were filled with false positives of the merger/acquisition variety. That stuck out to me which led to changes I make that I describe later. But there were still some decent setups mixed in the top 50. That probably means that if ATR/Price is less than something like .25 or even .125 or lower I could actually substantially punish all stocks and probably eliminate a huge amount of false positives. After those the setups started to pop up. When I searched the top 300-400 range I couldn’t really see as many quality setups as in the 200-300 range but because the score was so large as was the punishment I decided to look at the 800-1000 ranked stock range and the setups improved. As predicted the score and/or punishment is too high. Since I started with such a large number directionally it is clear I have to reduce this number. I went with 800/-200 instead of 800/-266 so I reduced the punishment proportional to the reward. I’m pretty confident the punishment for not meeting these criteria was a little too high because of the quality of setups in the 800-1000 range. I’m also going to change the score for the less than .25 to -10,000 and punishment to zero so that it is obvious which ones were filtered out and I can quickly look at them. Then I can adjust this number to .125 or .33 depending on whether or not it filtered out too many good stocks or not enough merger-acquisition stocks.  These were the only 12 stocks that the score filtered out. Looks like there’s a pretty low chance I’d be missing out on anything as a result of this score. negative
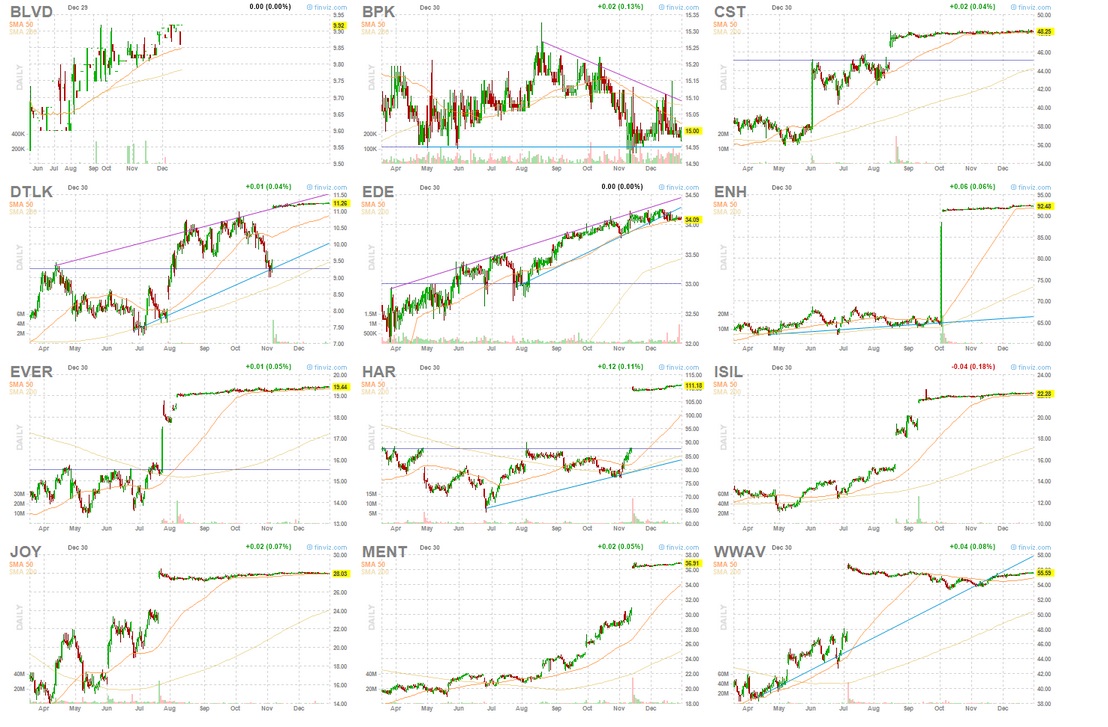
I changed the criteria to punish any stock less than .46 the volatility and I still didn’t really miss out on any and filtered out over 2 dozen. Occasionally I may miss a name, but it isn’t very likely. A stock scoring less than .50 was another requirement, there won’t be hardly any stocks between .46 and .50 and if I change it to something like .7 then there isn’t much room between .7 and .75 so I have to really change all of the points of measurement.

I also decided to test all stocks between .45 and .65 to see how many stocks are worth giving a good score in that range or if I should make additional adjustments. They weren’t necessarily all that great, filled with utilities and defensive names but also had a couple good setups. I decreased the amount of score that I gave those between .45 and .65 and eventually moved it up to .70.

I decided the same problem probably existed for the weekly volatility and it did so I had to remove those less than .4 it removed a few non merger+Acquisitions at .4 but mostly bond funds and defensive funds so I wasn’t bothered by it.

Because of the changes I made, I had to sort of slide all of the scores on both metrics. It currently looks like this but isn’t really necessarily anything close to optimal just yet, it’s just much better than before. As such these numbers are likely to change soon but for now I need to take a break.
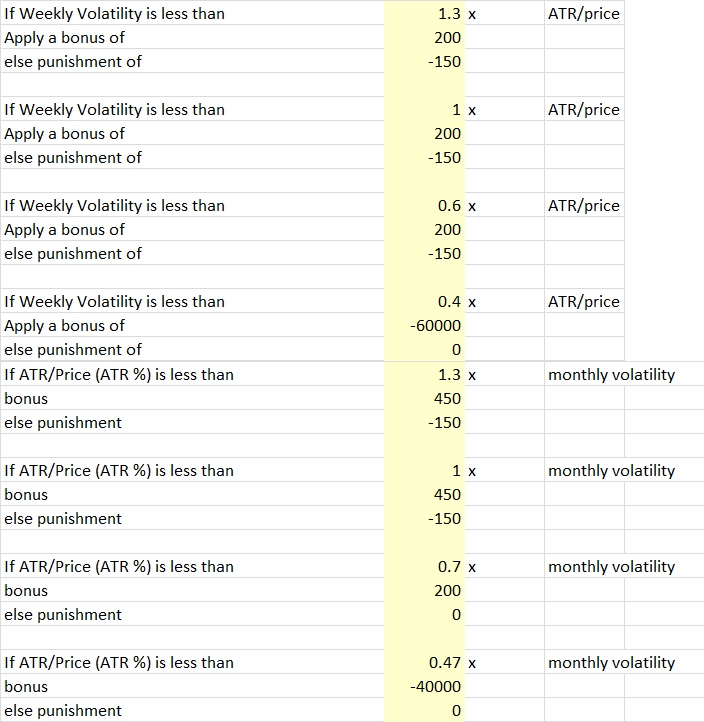
nowI’m probably going to have to increase the first criteria’s scoring and decrease the second until I’m satisfied as I think the recent week having less consolidation than the I also may decide to play with the sliders and the exact multipliers of volatility.

It seems that the best stocks may actually be in a range of volatility of not too quiet and not too volatile, but generally less is better. So I’ll have to figure out where that range is to continue to make improvements from here.

I was also going to test weekly change divided by beta, but since ATR divided by beta wasn’t super helpful I probably don’t need to change this one too much so for now I’m going to skip it and circle back to it.

Everything remaining that I want to test in the intermediate term rank is related to the moving averages relative to other volatility metrics. If a stock has departed significantly from the moving average then it represents a larger move away from a range, the goal will be to find the levels at which we can remove stocks as going to far and what comparative metrics helps with this. Perhaps a stock with smaller change relative to the 20 day moving average than the monthly volatility or smaller daily or weekly change relative to the 20 day will capture volatility contraction. It’s really not clear. A 20 day moving average can also use as a reference point to manage risk with a stop on a cross under the average if the stock is above it, so a stock being close to the 20 day may represent a good entry.

I will probably test the long term consolidation (monthly to quarterly change and beta) rank before the short term.

It is unfortunate that there isn’t a “quarterly volatility” or “yearly volatility” or more yearly based volatility metrics aside from beta and even 5 year and 10 year volatility metrics. But for now that’s the limitations I am working with. If the 20 day moving average works well, maybe I’ll use the 50 day and 20 day vs the 50 day and such.

What’s left to do?

1)Adjusting the moving average based rankings

2)Adjusting the long term consolidation rank

3)Adjusting the weightings for the “total consolidation rank” (which combines short term, long term and intermediate term)

4)Possibly adding 50 day moving average into long term consolidation rank.

5)Cycling through a couple more times to fine tune the score.

6)Possibly making more significant changes to eliminate sort of the rising wedge patterns or reclassifying them so that when I sort through stocks I can eliminate them if I’d like.

6)Considering categorizing the stocks based on setup by using the stock’s proximity to highs/lows and behavior and making unique scores in the changes over the week/day/month as well as change in trend that signal the pattern or type of setup. Then if a stock meets this criteria, having a separate score just for that “pattern”. This is probably the best way to go. I sort of did something similar the first time I did OABOT but I’ll probably just copy and paste most of the old method rather than start over.

7)Probably setting up a better “summary”/”cover” tab. I like stocks that set up together, but if I don’t have any sort of way to differentiate a bullish consolidation pattern vs a bearish one it won’t be as useful.

Right now it looks something like this

cover

It has stocks categorized by market, by sector, by industry and market cap size is next to be added. This is another reason I’d like to see how certain “types” of stocks are doing like “stocks near highs”, “stocks IPOd in the last 2 years”, stocks 5-15% off highs, stocks 15-40% off highs, stocks near lows, etc. That’d probably be a good way to get a feel for the market’s risk appetite, but I can also use a feature that sums up a list of individual stocks and lists the average score.The last cover tab was more about what is “working” now and where money was flowing. This is more about consolidation ranking but I may add other breadth metrics and such on there as well. I’m all ears to new ideas too.

I probably will have a duplicate of my spreadsheet because for the cover tab I need to have very few if any false positives that might skew the average where as a research tool to find specific stocks I have no problem looking at several false positives.

I also have a portion of the main tab setup for entering tickers if you just want to see how a group of say the FANG stocks compares to a hand pick group or market averages, or your own GARP index or whatever. This is how I constructed the S&P, Dow, Russel2000, etc market indicies average scores.

cover2

Comments »

Option Trading Systems Part 3: Implied Odds

In trading systems there are the first set of expectations based upon the upside if you hit the target, and the probability of that upside measured against the expectation and probability of the downside. This was discussed using the metaphor of “pot odds” in Trading Systems part 1. But does it really end there? What about trades you close that neither hit the target NOR hit the full max downside? What about trades that exceed the upside target?

I believe you can structure a system and understand expectations with mathematics, but where things get fun is in estimations of math based upon conditions. Your read of the situation, the players involved, the possible alternative options, having contingency options and adapting to circumstance is what gives any game “character” and turns it less into a math equation and more into a balance of intuitive “feel” combined with a mathematical equation.

Back to the poker parallel, you may have pot odds to continue on a flush draw, but what about the value that comes in hitting the flush? If you know once you hit your flush that you can expect on average to get paid more and not lose any when you miss? More value. If you also can potentially win with an ace high if your opponent doesn’t put an additional bet in on a bluff? You may have more profitable situations than can be calculated by simple pot odds. As a result there my be situations even where “pot odds” doesn’t accurately describe the true upside.

When trading options, you are not trading a binary system. Even if you choose to cap your winnings by writing a call spread and sell the call at the strike price equal to the target price to cap your potential, you still have some trades that made less than the target amount but still make money, or trades that lose money but don’t lose the maximum. As such, just about anyone trading options is going to have to think beyond “pot odds”.

In trading it important to allow yourself to have that big payoff as a result of letting winners run beyond the target, particularly if there is little resistance once you get past said target. A good situation in an individual trade is if you have a clear volume pocket up to say $50 before substantial resistance but then the price history thins out above $52 all the way up to $60. If the stock’s upward momentum charges right through $50 and gets above 52, you now have new support and potentially could march to $60. Even though the trade plan called for $50, the system can be flexible and call for an audible and instead try to milk the trade for all you can. Even though you might think you can only get a small bet out of opponent you may pick up a tell that the card helped him, so you might try a check-raise to lure him to commit more chips. Fortunately, the “expected value” calculation mentioned in Trading Systems part 2 still is relevant as an AVERAGE when planning the system, but less so on individual trades.

There is a concept in statistics known as “variable change” that was popularized in the movie “21” about the MIT blackjack team. I will cover the details later, but basically by adapting to new information, you may be able to gain an edge by adjusting your decision as the trade plays out. In this case, “Variable change” is relevant because rather than apply a general baseline statistical data to what our expectations are based upon the average risk/reward of 3:1 that we target, or even say the R/R at $50 that we initially planned on the trade, we can take into account the most recent action of the stock and “call an audible” to maximize our results.

In blackjack “variable change” is more concrete as you can adjust to the “count” by calculating how your odds have changed as a result of several face cards being dealt already or several small cards being dealt. In poker implied odds can’t be known since the depend upon our opponent. In trading the upside and probability of hitting cannot be known with any sort of large sample size and small margin of error. Hence, it is more intuitive and up to the “read” of the individual. While that may seem sensitive to the individual trade and highly subjective which leaves room for mistakes, you can manage it such that the confidence level that “calling an audible” is more profitable than not is extremely high. Over time your skill and results may influence the profitability of the trading system, and your confidence will improve in your ability to correctly call an audible that adds value to the system.

The “implied odds” calculation is basically very much like pot odds since once a stock reaches the target price, you have a risk of continuing to hold plus a reward of continuing to hold. Once the expected value of holding no longer adds value,you can sell so as long as you keep in mind the overall context of the trading system must still be intact such that overall on average you reach your target often enough to offset losses and profit besides. Since you have hit the target, you will more actively manage the option and have an idea of under what conditions you will sell, and on average how much you lose when wrong by continuing to hold.

Where implied odds can get most confusing is in factoring it in before you start your trade, just as an intelligent poker player would not call on the flop without first intuitively considering the possible actions that may follow and the overall expected value as a result of betting on all streets. When trading a weekly option (or “yolo” as they are known around here), It often is easier to identify a price level whereby if price passes, the stock should run as those in a position get squeezed out. Often times yolo trades may have a strikeprice that is at the target and the reward is in getting beyond it and running as the shorts are squeezed out and past sellers look to get back in.

Comments »

Trading Systems Part 1: Pot Odds and Trading

I wanted to go over some basics of building a profitable trading system by looking at “pot odds” a term applied in the game of poker and “expected value” and how it is interchangeable to trading. I am usually not a fan of looking at expected value because it doesn’t properly frame in the potential for massive account volatility, but it is still useful in understanding the basic requirements for a profitable system and can assist people new to trading or who have not yet learned to be profitable why they might have some “leaks in their game”. “pot odds” looks at the amount you can win, vs the amount you have at risk to determine the necessary probability of your decision in order to be profitable. From it you can also determine “expected value (EV) per hand (or per trade) ASSUMING the same amount risked every time.

In other words, say your opponent moved all in for the size of the pot on the flop. You get paid 2:1 to call since you must match your opponents bet, but get twice that (the pot AND the opponent’s stack) if you are right. You can then lose twice, win on the third and win everything you lost back. Therefore, you need only just better than a 1 out of 3 chance of winning for the call to be “profitable” in the long run.

If you have your entire bankroll at risk rather than a small percentage you are overextended and it is not a long term profitable decision because it will inhibit your ability to earn in the future as you will not be able to recover from a loss. “bankroll management” as it is called in poker and “position sizing” as it is called in stock trading is an important seperate topic that combined with “pot odds” greatly influences your long term profitability.

What novice poker players in cash games and traders often ignore is the fact that they will lose due to volatility. Lose 10% of capital, you need 11% just to get back to even, so 1% is lost due to volatility (it is actually less since multiple gains will also compound at a less substantial rate). Lose 50% of your capital and you need 100% return to get back to even.

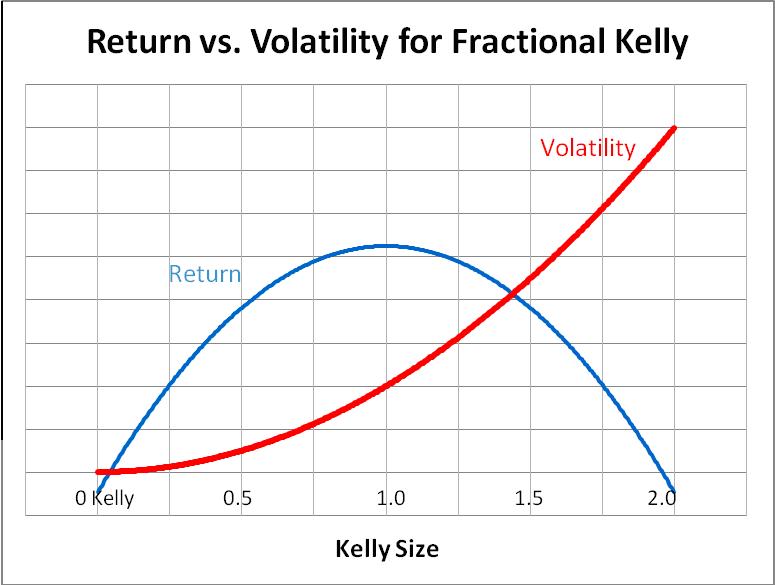
kellycriterionbetting more than 2 times the “full kelly” actually turns a profitable strategy unprofitable over ANY time frame, and erases any skill edge you have. While your winners may also compound, your losses create disproportionately large drawdowns that require a greater skill or edge to overcome to get back to even, and due to simple chance those drawdowns are certain to occur over a long enough time horizon with a correlated, unhedged system. Your edge is not as profitable as the expected value calculation in reality, at least not without introducing a “risk of ruin”. But I digress, let’s keep things simple… Pot odds. To keep things simple and ignore “uncertainty”, I want to use a situation in trading which the numbers tend to be a bit more concrete as opposed to uncertainty, so I want to give the example of “risk arbitrage” through buying into mergers and acquisitions.

According to this blog entry, 97 deals were completed, only 2 deals failed. However, many others remain unresolved and sometimes it may take longer than anticipated to close which doesn’t eat into your total profits for the trade, but does eat into your annualized profits since it takes longer for you to be able to reuse that capital. Since we are concerned in this article about profitability and pot odds, time will not be factored in. Even though almost 98% of deals closed, we will leave a bit more margin of error since some deals can linger on for years and then not close which could skew the numbers a bit. To be safe, we will say over 90% of deals go through and we can say that with pretty substantial confidence. At 90% chance of being right to win X and 10% chance to be wrong and lose 100% we must solve for X such that -.9x=-1*.10 or.9x=-.1 or -.1/-.9=1/9=.111111=11.1111%.

If you would lose 100% and win 11.111111% when you are right, the strategy of buying into these deals post announcement would be break even. So if you put your entire capital at risk, you would have the “pot odds” to buy any time there is a 11.11% payout or better. But when deals fail, they don’t go to zero, they drop down to around their pre-buyout price on average. This can change from deal to deal and some deals may just be in a constant downtrend.

If you had a downside of only 10% and an upside of only 5%, how would it compare with a trade with a downside of 100% and upside of 20%? You can confirm the expected value by downside of a loss (expressed as negative percentage) times probability of a loss plus upside of gain plus probability of a gain.

System 1 10% downside, 5% upside:

(-.1*.1)+(.05*.9)=.035=3.5% per completed deal.

(-.1*.1)+(.2*.9)=.08 or 8% per completed deal.

This shows why I don’t like expected value in comparing two systems, you risk insolvency by putting 100% of your capital into the trade with the “higher expected value” where as you only put 10% of your account at risk with the “lower expected value trade” If you were to risk 10% of capital on the 2nd strategy, you would only grow your portfolio by 0.80% per deal. As such the deal providing the better risk reward assuming equal probabilities of success/failure is almost always going to provide the better return on risk. You must evaluate system on an equal portfolio risk basis to truely determine which is better. The kelly criterion is a good metric for comparing one system to another on an equal risk basis. However, the kelly criterion should not be used for position sizing as it is probably 5 times more aggressive than it should be (or more) due to the false assumptions the formula makes about having an “infinite time frame”, a “certain, predefined known edge” and “complete emotional tolerance for all volatility that does not effect your edge” and that multiple bets at a lower percentage with a low correlation provides a better return on risk overall.

Additionally, if you could complete 12 trades a year in the 3.5% expected value system and the  8% per deal system took over a year, it would be much more profitable, so a raw calculation of “expected value per trade” must first be “normalized” (in this case normalized means something very different than “normalizing” volatility” as instead it means it should be set up to reflect the “normalized rate of return at a given level of risk” to reflect overall growth on portfolio given equal risk via position sizing). Then it must be also “annualized” so that they are equalized on a particular time frame after fees… However, due to uncertainty, you also must consider that the large edge that compounds fewer times is less vulnerable to small changes that may negatively impact the ROI more than you thought.

I don’t want to get any more complicated than I already have in this article, but for now I will tell you to practice by looking at your “risk” and your “reward” and measuring out your probabilities required to break even. For example if you have a target price that nets 3 times your risk, you need to hit your target 1/4 times in order to break even.  With options if you try to hit around “break even” on hitting your targets or even lower, the trades that expire in the money and have to be sold for a slight gain, break even and only a slight loss as opposed to the entire risk of the option PLUS the occasional trade that runs beyond the target will create profitability in the system.  I get into more specific and more realistic trading systems in part 2 and part 3.

Comments »