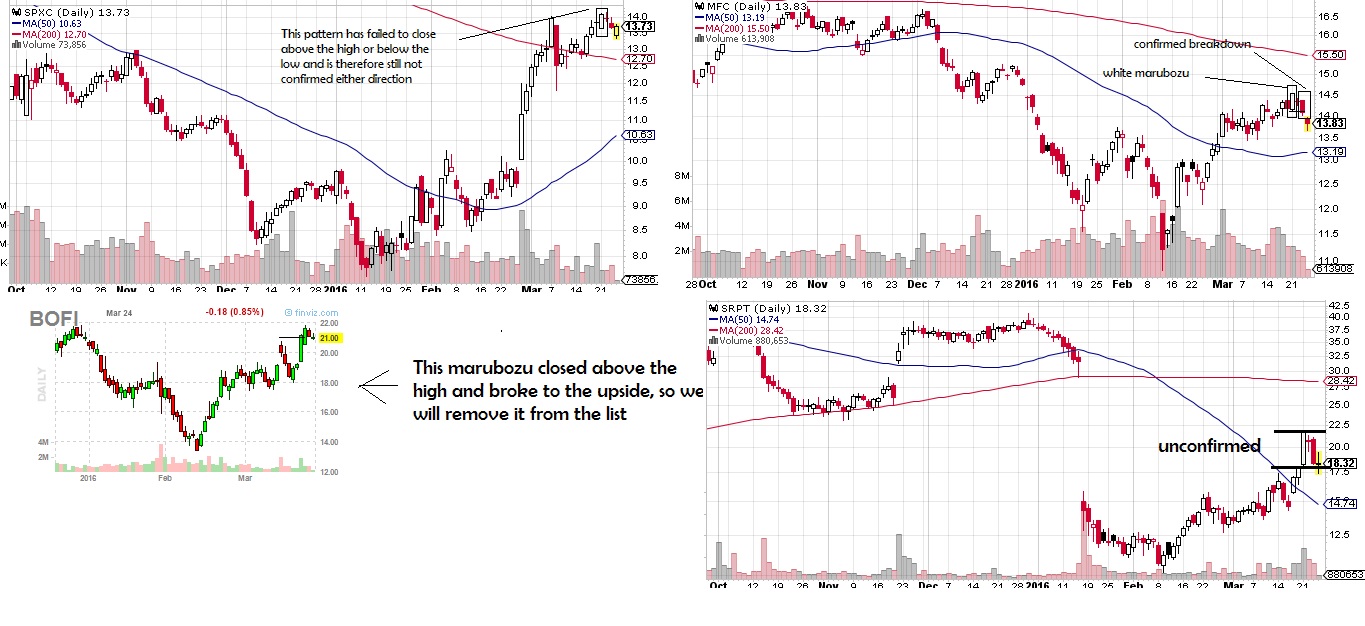
After a lot of work I’ve finally begun creating “risk classifications” like OA talks about.
I basically looked at a combination of variables to give me a risk classification for each variable and a weighted average. I tried to readjust the scores into 5 categoreis based upon the weighted average since it’s rare for numbers to be very close to 5 or 1.
For the time being I’ve ran several numbers factoring into the risk classification such as % off of high, % off of lows, strength vs peers, peers strength vs the market, total float, float short %, risk for what exchange or index the stock is in, risk for total dollar price the stock is. There’s also an earnings composite score which compares: earnings, sales, projected growth and standard deviation of all of the earnings numbers and compares these numbers to the peers. From this I come up with a weighted average factoring in all variables and some others.
There’s a lot more I want to add to some capacity. For example, I still want to add in several other variables going into the risk calculations that will improve this such as: liquidity, beta, beta vs its “peers”, market cap, market cap vs “peers”, and maybe some other fundamentals like ROE, Profit margin, etc…. date since IPO, % institutional ownership. I also want to work on adjusting the weightings until I’m more satisfied with it. Right now it’s more like a working prototype that needs improvement. I think beta and beta relative to the industry is probably one of the more important factors so right now there’s probably significant room for improvement.
For now, here are the the stocks that met qualifying consolidation scores and some signs of falling or sideways consolidation for each “risk number”.
1s.
2s.
3s more 3s.
4s 2nd group of 4s.
5s.
or for the copy and paste crowd:
1s
http://goo.gl/Zr7z4z
2s
http://goo.gl/1E3Kix
3s
http://goo.gl/K1C3Bk
http://goo.gl/DlXNiD
4s
http://goo.gl/MjSChV
http://goo.gl/75CNLx
5s
https://goo.gl/nVwBRc
If you generalize you can definitely see a difference in the names, however you certainly do see some stocks that probably don’t belong in a particular category. For instance, BCEI in my opinion is probably closer to a 5 than a 3 but I think when I add in beta and long term consolidation rank to the weighting it will make a big difference.
An interesting thing I noticed is the 5s tend to be near their lows and off of their highs significantly so that at this point if I switch to rising consolidation patterns the patterns actually improve. Here are rising consolidation patterns which usually are about 95% bearish or crap patterns but completely flipped once I excluded them to just the 5s. I wouldn’t necessarily trade bull flags or patterns of this quality in this location, but certainly the patterns that are more bullish than bearish increase substantially from the usual more than 95% crap and I would rather buy dips in these names than sell rips if I had to choose.
goo.gl/fdBIWw
The 4s was pretty close to the same thing with a few more rising wedge patterns since a stock in a perpetual downtrend most begin to show at least some strength before it will round out a bottom.
goo.gl/4FLfFG
The 3s actually still had a few but you’d have to go through a lot of patterns that are not actionable.
The 2s were almost all running up against resistance after falling or at new highs and so I wouldn’t waste my time.
The 1s were mostly mid trend up near or at the highs so I would need to see some sideways work or a sell off at which point they would no longer be labeled rising patterns.
I decided to narrow the lists using a screen requiring more than 25% earnings growth Q/Q, 10% sales growth Q/Q and institutional ownership over 20% then handpicking the ones I liked.
3s
CUDA,FNWB,HOFT
4s
DL,YY,LULU,BZUN,EXA
5s
ACIA,BVX,MEET
This was just a more efficient way to get through the list but it comes at the expense of potentially missing more setups. This is just one way you can narrow the list, you could also do so manually by looking at charts first, long term charts next and maybe volume profiles if you still need to narrow down the list. You may instead want average daily volume above certain amounts. if I used an over 300k avg daily volume filter I could handpick these as an initial list and try to narrow it down manually from there.
3s
CLR,CUDA,EW,EXPE,AN,CPLP,BCEI,CRIS,DDS,OAS,PBR,PIR,PI,SCHN,SCS,SPG,TRP,TTEK
4s
AKR,BKD,DEPO,DO,DRRX,EGY,GGP,GRUB,HIBB,HLX,HZN,IPI,LILA,LTBR,MAC,MNK,NAKD,MVIS,NYRT,REXX,SHLD,SIMO,SINA,TEVA,TWTR,UAN,WPG,WWE,XCO,YY,YUMC,BRFS,LULU,NVFY,ADHD,APTO,BZUN,CASC,THLD
5S
ACIA,BOOT,CPST,CXRX,DCIX,DLTH,EZPW,EYES,GNC,GSAT,MEET,MEMP,MITL,PEI,PLG,TWLO,VNCE,WAC
Could probably narrow that down slightly to:
3S
CLR,CUDA,EXPE,CPLP,BCEI,CRIS,DDS,OAS,PIR,SCS
4S
DEPO,DO,EGY,GRUB,HLX,HZN,IPI,LILA,LTBR,MAC,NAKD,NYRT,REXX,SHLD,TEVA,TWTR,UAN,WPG,WWE,XCO,YY,YUMC,LULU,NVFY
5S
ACIA,TWLO,BOOT,CPST,CXRX,DCIX,DLTH,EZPW,EYES,GNC,GSAT,MEET,MITL,PEI,PLG,TWLO
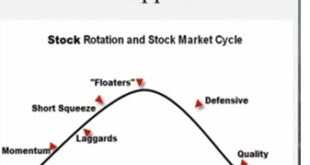
Perhaps the more interesting thing that will happen is when I combine classifications of a stocks peers with the risk cycle and with knowledge of where the market is. For example if I look for industries that are leading the market after this market run is extended I wouldn’t want the 1s or 2s or 3s but the 4s and 5s. If I looked at the industries lagging the market I might want the 1s and 2s because I’m looking for them as a group to begin showing some strength starting with the lower risk names… If I found the industries only slightly leading I may want the 3s and 4s. If I only looked at slightly lagging the market I may want the 3s. When a market first finds its footing off of a correction then I might like the leading stocks in leading groups. The ability to generate dynamic lists is something that will be useful in generating better lists.
(the below image I think is a couple weeks old)
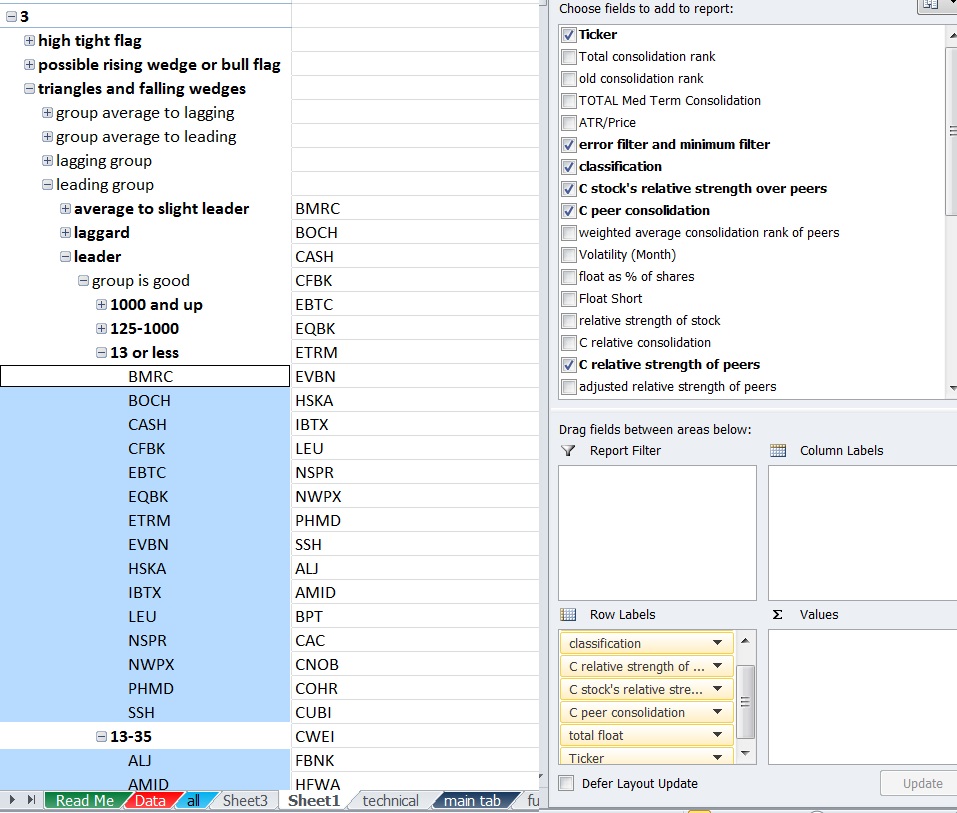
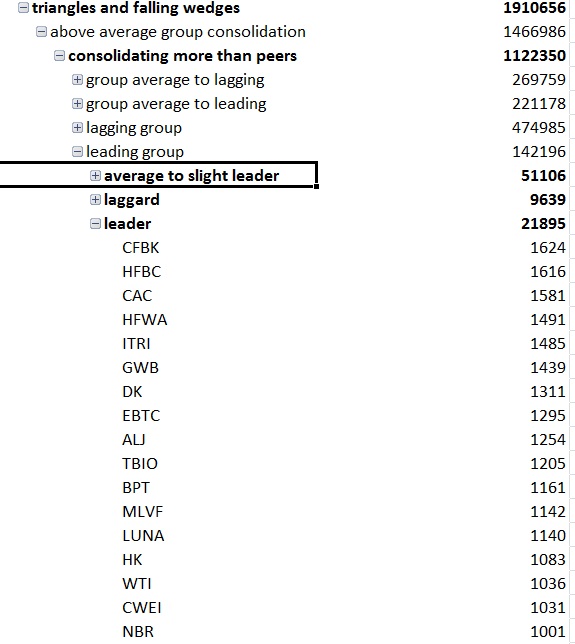
There’s also the balance of trying to include more information such as what themes are seeing increased buying on increased volume and what themes are working on various timeframes without complicating things too much. Ultimately I want this to be a very simple process and I’m not the most organized person, but I also want to be able to weight all relevant factors at one time and no irrelevant or conflicting ones.
For example, it wouldn’t make sense to average a momentum ranking and value ranking since the best value stocks are the worst momentum stocks and the best momentum stocks are the worst value stocks. A composite average would be pointless. Keeping stocks isolated in various categories and only looking at the relevant categories for the time being is probably the way to go or dynamic programming that will adjust the scoring method based upon group.
If you enjoy the content at iBankCoin, please follow us on Twitter


