iBankCoin
Home / Uncategorized (page 3)

Uncategorized

Mark This Day On Your Calander! Overall Breadth Oversold

Since the “breadth” indicators looks at the percentage bullish vs % bearish on multiple time frames and uses multiple ways to look at breadth it is VERY rare that you see the overall average ratings outside of the normal range of say 40% to 60%.
breadth oversold
The highest I’ve seen it to compare the opposite was 74.6% on July 3rd. That created a meaningful upper range of the S&P and practically top picked the Russel just in time one last day before the major selloff, from which we have sold off over 10% as of today. The opposite reading would effectively be 25.4% on the bearish side. Instead we currently have a rating under 20% for the first time since I’ve been watching this in April and (semi) actively tracking since late June.
Many students of breadth will tell you to wait for a “breadth thrust” or dramatic and significant flip FROM oversold or overbought levels as you then have the change in sentiment which triggers shorts to chase from oversold and sellers to pile on from overbought. You also can potentially look for leadership to emerge which can be evident from the larger of the two numbers on any time frame acting more bullish than the lesser of the two numbers. However, you can also look at the opposite process of trying to dollar cost average or scale in/out as well. You might use it as a signal to transfer money to more aggressively buy the rare historic event. Of course, it is worth mentioning that bull markets tend to remain overbought for quite some time and bear markets can remain oversold for some time. Nevertheless, this type of substantial selling could represent ultimate discouragement lows…. Ultimately the trick is putting the breadth into context with sentiment and relevant context. That is difficult to do from a stale bull which has yet to receive public participation, but I am going to bet that this is a significant shakeout that has far reaching global implications like 1998 but one that is still in the context of credit expansion and a bullish business cycle with credit still remaining very loose. You could see huge ramifications from sanctions on russia, ebola, ISIS, global tensions and increased fear but you cannot reverse and manipulate the primary trend which I believe is still higher as you do not have confirmation in the S&P, Nasdaq and dow. The russel is concerning but markets don’t act in isolation forever. So while some say the russel is a (complex) head and shoulders breakdown (or double top), I say it is a head and shoulders FAKEOUT until proven otherwise.
Having the discipline to rotate capital into risk here is certainly not easy however… particularly leveraged option buying strategies which tend to capitalize off of low volatility when the volatility is high. That makes this a bit more challenging, but there is still a good roadmap of which stocks to focus on in AHwOA and I believe the opportunity is also good for buying TNA and XIV


The moves are adjusted for the amount that would erase a move. For example 100% movers corresponds to 100% up movers vs 50% down movers since a 50% down move following a 100% up move would bring you back to even. A 150% move up corresponds to 60% decline. 10% up = 9.0909% down. etc

Comments »

Scanning For Themes

I decided to set the OAbot up so I could get a quick glance and look for themes. It was initially with the intention that I would completely automate the process, but in it’s current format the OAbot works better as a research tool than an automatic setup generator. One of the rankings looks at the average “setup score” of each stock within an industry and comes up with an average.The setup score typically (depending on the classification of each stock) will look for strong uptrends, recent consolidation and volatility compression using monthly volatility, weekly volatility, and daily move as a % of ATR).

Although there may be other valuable metrics such as relative volume of the industry and breadth, ideally the only necessary component to identifying anticipatory entries is all stocks within a group saying the same thing. I can repeat this scan across sectors or classification types, but there is an inherent bias towards stocks that are near the highs as any laggard that just exploded to new highs will then be looked at as a momentum or quality stock. As such aside from trying to subtract the recent day move from the high to see what the stock was classified as before the move, and/or having some sort of metric to track over time at what % of each group has broken out and is no longer classified as a laggard or trash near lows, there is not much that can be done… I don’t have the time to put a lot of work into the OABOT right now as I once did.

So for now we can scan for themes quickly. The following is all industries with the # of stocks in the industry over 20, an individual setup score average over 90, and sorted by avg setup score in the industry.

Major Integrated Oil & Gas 106.474303
Oil & Gas Pipelines 105.618511
Trucking 101.401134
Residential Construction 99.1633571
Rental & Leasing Services 98.1455953
Oil & Gas Refining & Marketing 97.1936567
Semiconductor – Broad Line 96.6590651
Gas Utilities 96.1367812
Textile – Apparel Clothing 96.0117017
REIT – Residential 94.6209923
Oil & Gas Equipment & Services 93.8425753
Specialty Chemicals 93.7406842
Auto Parts 93.4825295
Property & Casualty Insurance 93.4359768
Credit Services 93.4128977
Gold 93.3070126
Chemicals – Major Diversified 93.1052147
REIT – Diversified 92.6859943
Telecom Services – Domestic 91.2492766
Drug Manufacturers – Other 91.1494354
REIT – Retail 90.8556666
Electric Utilities 90.6886449
Oil & Gas Drilling & Exploration 90.1819049
Independent Oil & Gas 90.1435737


The individual setup score breaks down the stock differently depending upon the classification. Stocks near their lows are evaluated differently than those near their highs. Stocks flagged as “short squeeze candidates” are evaluated partially by their float and % of float short in addition to weightings from each category of classifications. Stocks that are liquid with good fundamentals and growth prospects are looked at differently. Stocks with accelerating momentum and growth are looked at differently. There are 3 different types of “laggards” and each has a different way to evaluate the score. The score is very dynamic in that if certain things are true it is evaluated a certain way. If either of a number of things are true, it may be given a bonus to the score. If a combination of things exceed a certain value it may contribute to the score. Should I find the time, I will put a lot more thought into the exact metrics, weightings, and components that go into the score by tracking which setups look better after making tweaks over a longer period of time until I have more ideal rankings. Once I am able to further fine tune everything, and possibly even track price across time and automate the tracking, THEN I feel I may be able to construct a tool that is more automated, particularly if I implement many of the things that are computed, but not factored into the end ranking just yet. Rather than use the OAbot individual stock scores at this time, I think it is quicker just to go to finviz and scan through each of these industries until you have enough setups or identify a theme or two that you are satisfied with.

I’ve already manually from top down analysis concluded energy was a good setup a couple weeks ago… so all the various oil&gas plays coming up is additional confirmation.

I like how trucking stocks while a very diverse group (some stocks near highs, others near lows), still shows a lot of consolidation and bullish looking setups. Look at HTLD and UACL as an example.  Very different stocks right now, but both look like they are working sideways to set up a bullish move. Even among the worst stocks of the group as determined by their % off of 50 day highs are names like SWFT that are at least consolidating above a recent balance area after the sharp drop and rejecting new lows below $20 so far. Not at all a bullish chart after making the equal low longer term, but you could easily see a move to 22 before declines and recent action is at least decent considering the technical damage done to it. There are still a few stocks of the group that look like while contracting in volatility, they still have more sideways work to do for a couple weeks. I think the industry may need a bit more time for some of the leading stocks to consolidate and some of the others to work sideways or breakout and retest as the others set up, but overall it looks like an industry where you could identify a select few setups, then move onto the next, and possibly at some point you might see more of them beginning to correlate… Either way it may be a good theme to watch.

I am surprised to see residential construction score so well, I never would have even looked right now. It has been a dog of an industry but a handful of stocks are making bull flags and consolidating after a bounce from lower prices. I don’t love the industry, but every now and then you’ll see an industry flagged you wouldn’t have thought to even look at and get some ideas. It’s nice to have a preset sort of program that doesn’t have bias aside from the one you programmed in that can then be checked critically with a human eye as you have the machine that doesn’t get tired or miss anything, and then the human eye to critically assess and the intuition developed from experience (that cannot easily be programmed) to filter down the process. Since currently I am using more of an intuitive feel based identification of theme and selection of stocks, it is not a bad idea to combine objective filters such as selecting from those in sectors with seasonality that suggests we are near a low or have plenty of upside ahead.

This process takes much longer when I am analyzing it and then converting analysis to words and typing them out and it may not be exciting to read, so I won’t go through all of them. I may in the future just look to create only a volatility compression score only as being able to limit the search to groups with plenty of volatility contraction may be a little easier, particularly if I combine with a decent overall setup score in the way that it will filter down the groups to those over 85 or 90 rating first and then will sort by volatility compression scores.


the end for now.


Comments »

Breadth Marches On

One of the interesting I observed about breadth recently is that off of oversold levels the bounce was so strong that it was difficult to distinguish leaders from anything else. “buy everything” was the motto just as on a longer fractal it was off the 2009 lows. Breadth still flipped aggressively and there were still a large percentage of stocks up, as well as a large percentage of big movers up, but it was not a market that you could say was pulled up by leaders, but instead one in which everything rallied, and a small percentage of stocks rallied a lot. That could be interpreted as shorts merely getting squeezed out and an over enthusiastic buy after a sharp sell off before another leg down, or as a sell off that had gotten so far oversold that the opportunity was so good that the buyers didn’t have time to be picky and do thorough research, they wanted in on anything and everything they could. The key to evaluating the breadth sometimes is patience when you are unable to have an edge in putting the breadth into proper context. Coming off oversold is tough.
A breadth flip from bearish breadth to bullish breadth is generally really good off of oversold levels, but the difficult part is assessing if it will be a market of stocks or a stock market and if the move will represent a V reversal or if those lows will be retested? Is it going to run away from here or is it going to retest resistance and remain in a range? Sometimes clarity is not provided until later on.

Fortunately, the last few sessions have seen leadership as markets have gotten more stretched from the lows. We do see more modest breadth overall, but this is clearly not “just noise” as some of the 1% movers may be and not a reactionary rally, but one driven by big movers clearly outnumbering the small moves.

For example today just looking at one day moves, 60% of all stocks moving were up today. Of those that moved 1% or more, 61.2% were up. Of all 4% or more moves, 64% were up. While the extreme moves are more rare, the more extreme the filter got, the more bullish the breadth is as a % of movers of a certain threshold. In a strongly bullish environment, the breadth being even more bullish as the moves become more extreme is typically a good sign. That may signal a number of things such as conviction to the upside, positive earnings and revisions and fundamental factors that drive stocks up, generally positive news as news driven moves may be of greater magnitude, and an increased amount of capital in the system allowing them to chase. All of these are typically bullish except when at overbought extremes in bubble territory and indicative of sentiment being too extreme when 4% movers make up a larger and larger percentage of up moves.

One sign for extreme sentiment might be breadth on a longer term time frame showing extreme up moves composing a higher percentage than strong up moves, and a large overall number. We have not seen that lately, as sentiment is not extreme at all on the longer term. We also have not seen much leadership on the extreme moves at all on longer term basis, which means this is still a swing trading environment, as opposed to the market entering run away trend mode where buy and hold for a run away move is king (I imagine the 80s and 90s showed plenty of leading growth stocks running gap and go or breakout and chase). This action in my view can be confirmed by the Russel still remaining in a consolidation range.

Monday August 11th (possibly the prior Friday) and for sure Wednesday, August 13th saw huge reversals from bearish breadth that continued to stack up over the next couple weeks. Although breadth on the daily move is not above the 80% range as it was a week ago, the fact that there still appears to be greater convictions on the big movers to the upside shows that leaders can continue to pull the market higher. The % of 1% movers moving at least 4% is around 15% so letting your winners run still appears to be a good strategy as well which supports the swing trader’s and stock picker’s cause.

Today here are some signs the bulls are winning aside from up moves outnumbering down moves and the market being up:
% of up stocks moving 4%+
5.80%

% of down stocks moving >-4%
4.92%
% of 1%+ stocks moving 4%+
14.86%

% of -1% stocks moving >-4%
13.23%
% of up stocks moving 1%+
39.01%
% of down stocks moving >-1%
37.18%


breadth tracking

Comments »

Breadth Tracker

I have not always found the time to track breadth or I’ve either forgotten to save afterwards, or forgotten to track it, but I’ve been trying to make a more conscious effort to put up the breadth readings. An interesting observation is that the total average breadth is the worst it has been since I started tracking (at least worst I remember and if it was ever worse I didn’t record it).
breadth tracker
I do know that in some of the better days in which I wasn’t tracking it that the % of stocks up 4% was over 10%, but unfortunately I don’t have record of it saved. The sudden shift from earlier on being under 3% to over 9% signals a decisive move in direction by a number of stocks in both directions.

The unfortunate thing (and in some ways the fortunate thing) about breadth is there are different ways to interpret it. It has to be put into context. Breadth is only a measurement of advancers vs decliners. The major index or indicies are weighted heavily by the largest cap names and can’t tell you when a lot of stocks are up a little, when a few stocks are up a lot, or when a lot of stocks are down but a few megacap stocks are up. Breadth can help you look behind the curtain a little and interpret what’s going on under the surface. Alternatively, it can be used as a sentiment indicator and you can correlate it to interpretations of sentiment cycle to confirm risk aversion. You can look for leadership the way I set it up, and even analyze if it is “market of stocks”.

Although the numbers are objective, you can either see more oversold and value in buying the blood, or you can wait until things improve dramatically and follow after a “breadth thrust” (sentiment shift). This flexibility can be frustrating for some, but also very adaptive to your way of trading. An allocation strategy might wait to begin to shift allocation until there has been a decline and slowly begin to rotate in and then do so more aggressively after the oversold levels follow with a sustainable shift in breadth that is more than a couple days long. It tracks multiple time frames and you can look for whether or not there is substantial leadership making extreme moves one way or another, and the percentage of extreme moves that are bullish vs bearish.

The fact breadth is so bad in the context of believing this uptrend is not yet over, yet still vulnerable to an intermediate correction while still showing “aversion” in some growth names provides a lot more actionable ways to play my bias on different time horizons as breadth develops. I am in a bit of conflict here, but I believe the sell off in the russel is a precursor to the selloff in the S&P but that there will be some mean reversion. I would eventually expect growth stocks to lead on the next go around but it may be longer than usual until it sets up as first we may have to have some rotation. Additionally one of the CAUSES for aversion may be a reduction of risk ahead of earnings season. After that plays out whether positive or negative the market will have to react, and then eventually rotate their capital SOMEWHERE. I doubt see with yields so low that bonds are attractive, commodities aren’t exactly that attractive either, and so currency and stocks are the only places the vast pools of money will go. Eventually the pension funds will either start to become insolvent and go belly up or aggressively have to rotate into risk more aggressively, and possibly both. Their models of making 8% in the late 70s and early 80s when interest rates were 10-15% may have been fine in the past when the bond yield was super high in the 80s but there isn’t enough yield for that to remain viable at 2.5% 10 yr treasury. Eventually until we have public participation and euphoria, we will continue to find higher prices, although it may take substantially more time before the market sets up for the next rotation and it may correct in the mean time before it will chase into stocks so that may not help you as a trader over the next month or so.
Another breadth reading (McCllelan Oscillator) is also as low as it has been in a long time.
nymo


Comments »

Market Breadth Update 7/17 Very Little Leadership

The leadership we do have at least is finally bullish after a few days of what may be just temporary risk aversion.
However, there is a greater concern…
stock market

That concern is that individual stock bets have failed to pick a direction. These conditions, should they continue, is very dangerous for short dated option trading strategies, but may just be pre-earnings uncertainty. Nevertheless, until things turn around in the short term, it is a “stock market” rather than a market of stocks.

I haven’t been following breadth for very long and I only recently started looking at the % of stocks that are up making significant moves, but nevertheless, I have seen readings where over 10% of all stocks that are up have made +4% moves. I thought 5% was low, but a reading under 3% right now is pretty rough, especially considering with such low VIX we should see some individual leadership. As I have not tracked breadth in this much depth for very long I cannot be substantially confident in my interpretation, but I suspect the divergence between a VIX suggesting a “market of stocks” while breadth has increasingly suggested an increasing shift into a “stock market” means we are on the verge of some kind of turning point where in hindsight this signal will seem obvious.

The russel diverging from S&P and dow, and the breadth suggesting investors are hesitant to aggressively accumulate or sell any particular theme could simply confirm the gameplan of “aversion” that OA has mapped out. Alternatively, if the glass is half empty, instead you might see this as an early indication and precursor to volatility increasing, the smart money reducing positions ahead of it and selling into any strength while there simply aren’t a lot of people that have caught on and joined in selling yet, and the “calm before the storm” type of logic. Last time the “market of stocks” got put into question it only took a week or two until it turned back around and remained a “market of stocks” before then selling off sharply in a slightly more correlated way than desired and remaining there (bloop, bloop) as Janet Yellen decided to give grandma stock advice, warning the kids to avoid playing with firecracker stocks.

Translating this ambiguous view into a gameplan is actually much easier than one might think. One should always have their own way of deciding “what” to buy, but equally important is how to position size, what time frames to look at, and how defensive of a strategy to use. Regardless of the viewpoint of “the market” going forward, the mere suggestion that the “market of stocks” is being put into question yet again suggests following a more concentrated approach (fewer names with normal or slightly above normal position size for about equal or less total capital at risk in options) going forward. The lack of clear leadership suggests that if I must buy options, more time is advised. So remaining a bit more patient with some extra cash, not leaping into the riskier names just yet, giving more time for setups to develop and sticking with what you do well looks like a good gamplan going forward from my point of view. Perhaps a more defensive strategy of cutting losses a bit more quickly to not get stuck in stuff that takes too long to develop, and counting your blessings if you have a gain in a stock run over 4% in your anticipated direction rather than expecting it to defy the even longer than usual odds. If you cannot trade that way and want to stick to stock picking and letting winners run more so than worrying about salvaging premium, just gear down for awhile and make sure you have enough capital ready to position more aggressively again once we get some leadership and more positive signs.


asinine disclaimer:I’m not certified as a broker or financial planner so this isn’t “advice” legally speaking, just “entertainment” and education.


breadth end of day is interesting. More time in the day leads to greater chance of larger moves and with very few positive stocks, it’s not all that surprising that market would dive into the few runners:

breadth 7-17

Comments »

System simulation and position sizing

Assuming the following system and $25,000 starting capital:
results(ROI by “event”):
1:397% (average was skewed by a +1500% in GMCR, a 1000% in YELP and a few 500-800% gains in AAPL,BAC,GMCR(2),LNG,AMZN,PCLN)
2:57.51%
3:0.28%
4:-69.69%
5:-100%
Odds (of corresponding “event”)
1:23.44%
2:9.38%
3:4.69%
4:9.38%
5:53.13% (I assumed all current trades on the books went to zero to prevent unfair bias of only counting the completed trades while the open positions were negative)

Simulated expectations and probabilities over 200 trades…
1% position size:
median result:$45,000? Mean:$51,574
46.5% chance of double over 200 trades ($50,000)
7.5% chance of 200% over 200 trades ($75,000)
1.1% chance of 300% over 200 trades ($100,000)

(note:drawdowns are measured from highs and count if they occur at any point in time over 200 trades)

Chance of 20% drawdown 10.7%
Chance of 30% drawdown 0.9%
Chance of 40% drawdown 0%
Chance of 50% drawdown 0%

1.5% position size:
median result:$60,000? Mean:$73,800

79.1% chance of double over 200 trades ($50,000)
41.8% chance of 200% over 200 trades ($75,000)
18.7% chance of 300% over 200 trades ($100,000)
9.5% chance of 400% over 200 trades ($125,000)
4.5% chance of 500% over 200 trades ($150,000)
2.2% chance of 600% over 200 trades ($175,000)
1% chance of 700% over 200 trades ($200,000)

Chance of 20% drawdown 40.6%
Chance of 30% drawdown 6.5%
Chance of 40% drawdown 0.2%
Chance of 50% drawdown 0%

2% position size:median result:$85,000? Median:$112,200
40% drawdown kill switch:4.4% chance of hitting
87.6% chance of double over 200 trades ($50,000)
65.8% chance of 200% over 200 trades ($75,000)
46.6% chance of 300% over 200 trades ($100,000)
29.6% chance of 400% over 200 trades ($125,000)
18.9% chance of 500% over 200 trades ($150,000)
13.8% chance of 600% over 200 trades ($175,000)
10.5% chance of 700% over 200 trades ($200,000)

Chance of 20% drawdown 75.1%
Chance of 30% drawdown 41.17%
Chance of 40% drawdown 4.8%
Chance of 50% drawdown 0.4%

3% position size: median result:$135,000? Mean: $234,500
78.3% chance of double over 200 trades ($50,000)
73.4% chance of 200% over 200 trades ($75,000)
64.6% chance of 300% over 200 trades ($100,000)
54% chance of 400% over 200 trades ($125,000)
49% chance of 500% over 200 trades ($150,000)
44.5% chance of 600% over 200 trades ($175,000)
38.8% chance of 700% over 200 trades ($200,000)

Chance of 20% drawdown 99.2%
Chance of 30% drawdown 66.6%
Chance of 40% drawdown 28.8%
Chance of 50% drawdown 8.3%

Comments »

Latest OABOT Addition – YOLO Trader

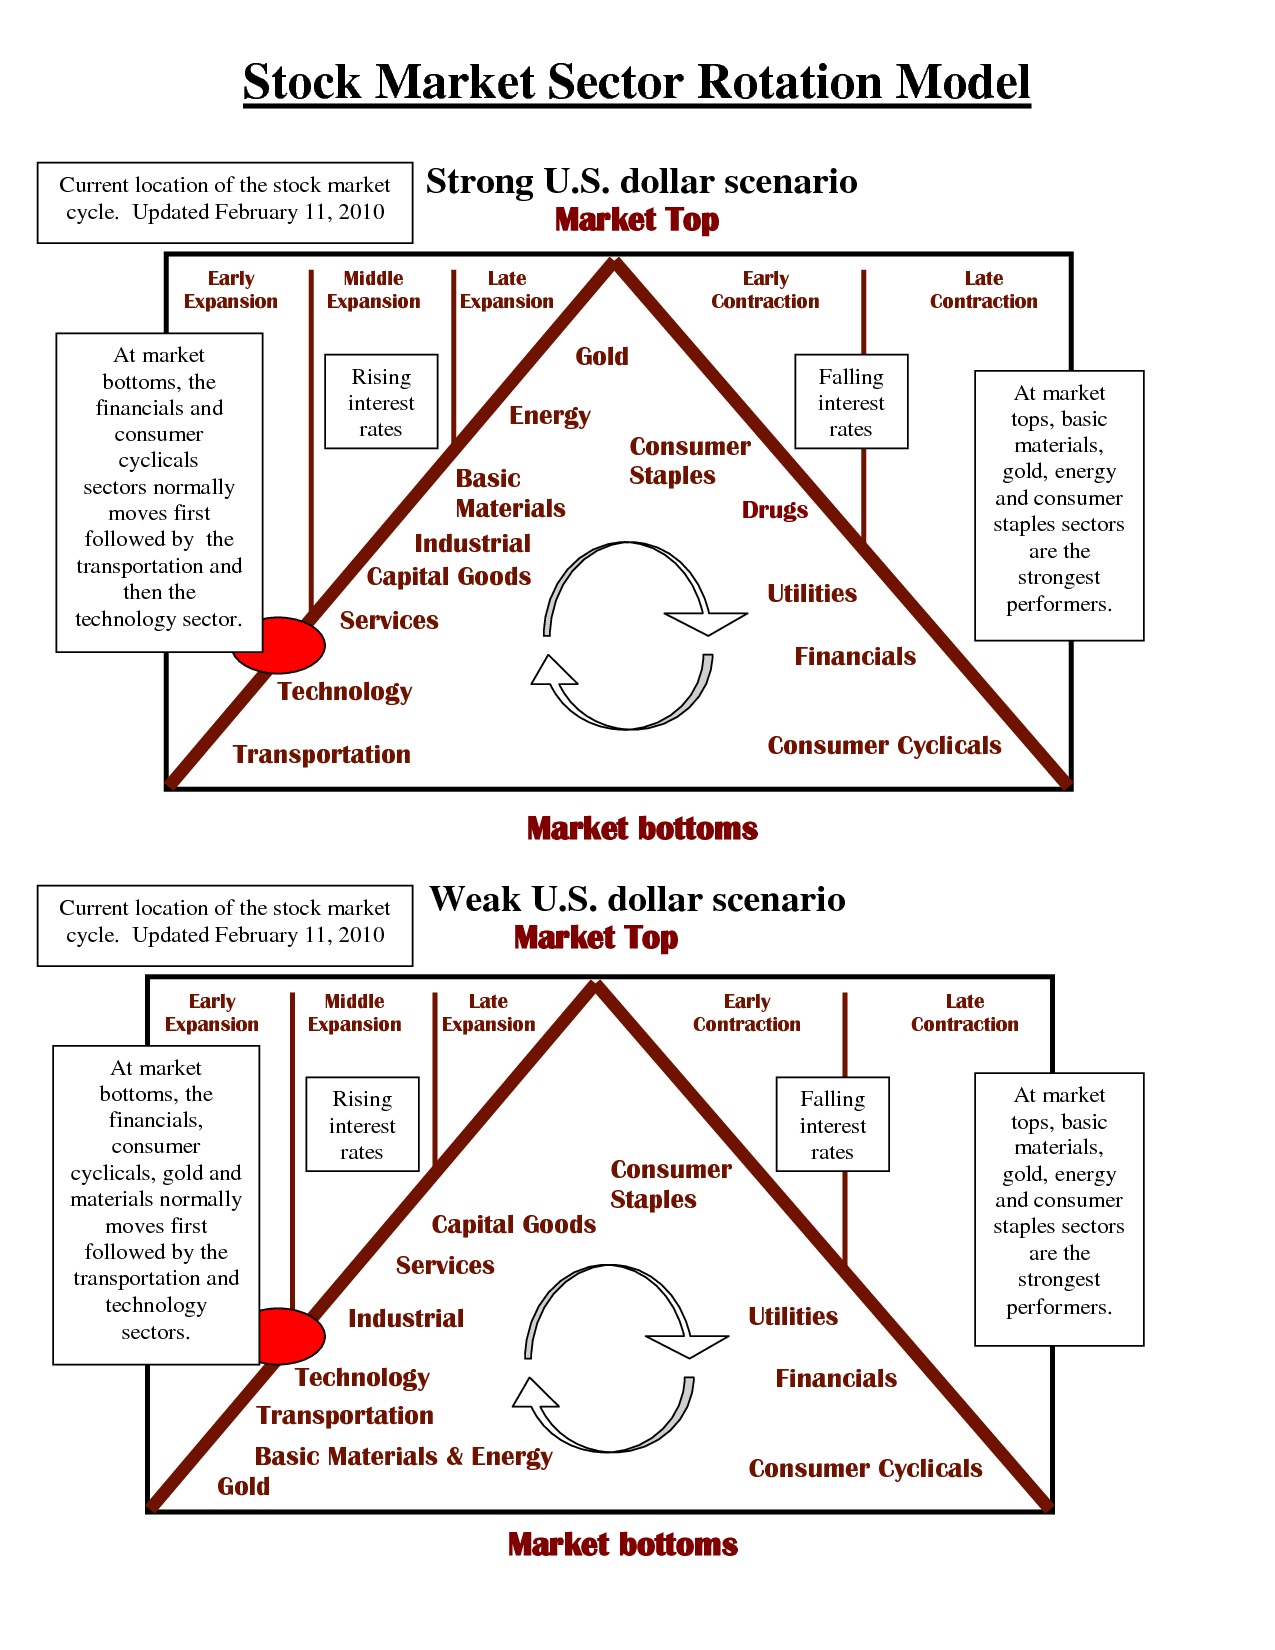
So I started  working on an addition to the OABOT today. What I want to do is identify shorter term 1-3 day trades.The strategy will be to ride the coattails of the capital flows of an industry rotation, by looking for stocks that are not yet extended in those industries. Since it’s a 1-3 day trade, I am not concerned about any of the usual weekly or monthly trend action (at least as a primary indicator).

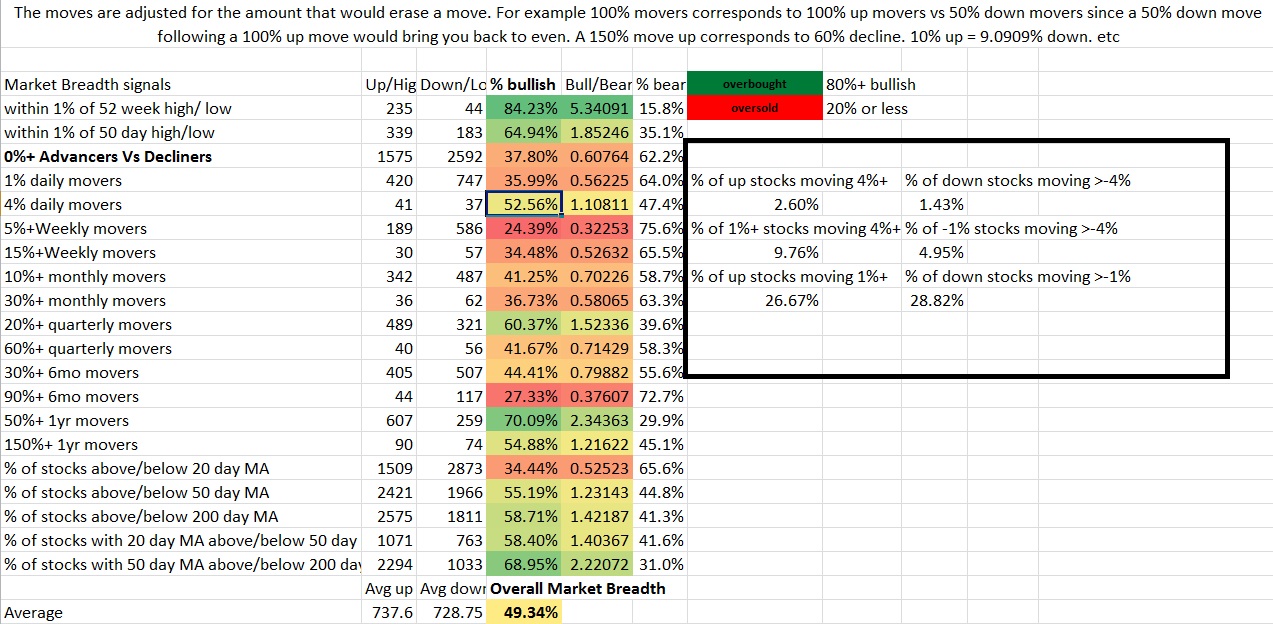
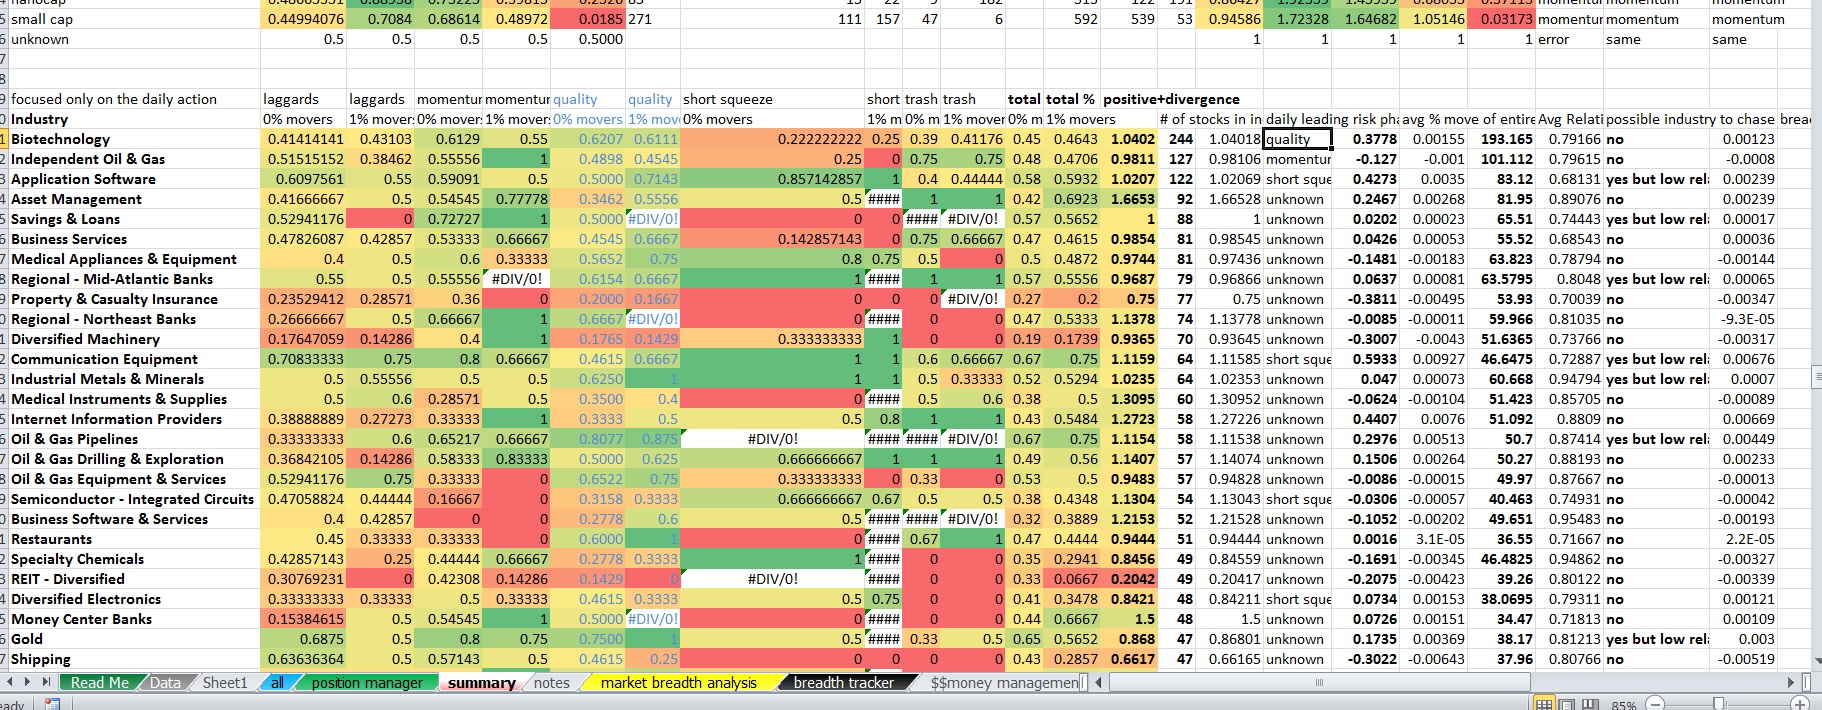
I start with an INDUSTRY scan of sorts. I want to actually identify industries with at least half of those names positive on the day, with at least a positive average stock move in the industry. I also want above average relative volume AND over 10 names in the industry, but may be willing to settle for results that don’t include those last two filters.

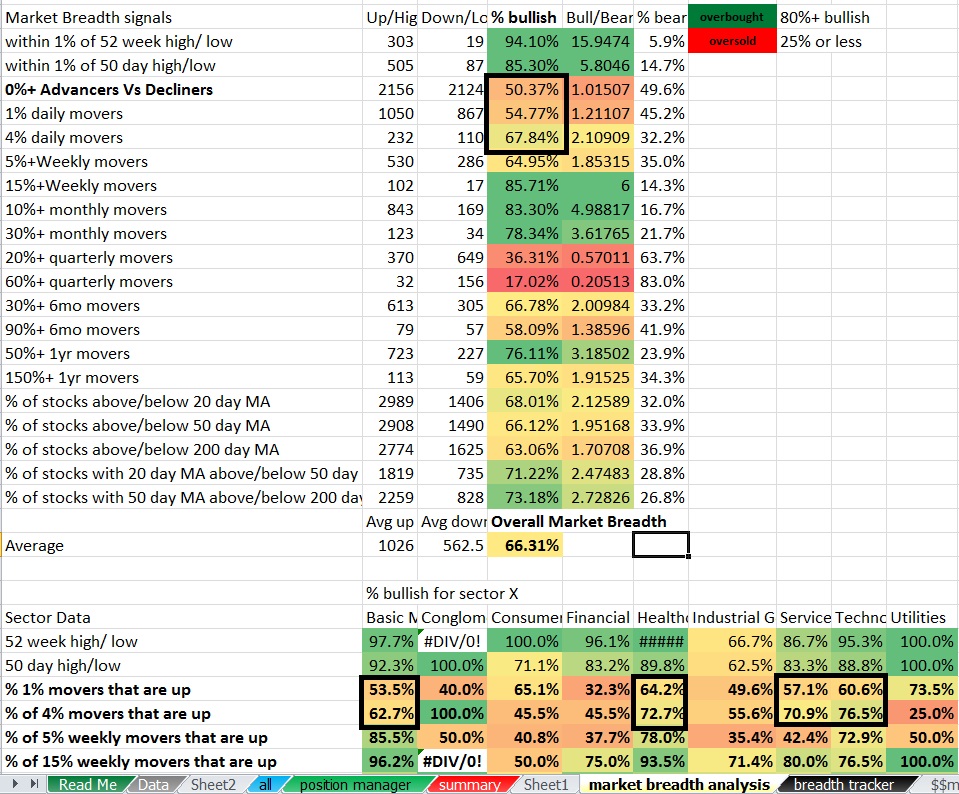
Meanwhile, I want a view on breadth 0% movers and 1% movers by TYPE across the industry, to identify what the daily action is signaling in terms of risk rotation which may later help confirm the anticipatory score and risk cycle that will be more designed for a 5-15 day trade.
oa1

What the primary purpose of this is, is to allow me to have a preset watchlist so that any of the stocks I am watching that start to show industry strength I can quickly check the charts and jump on if I like the action and the industry is taking off. I am really just going to watch the options that trade weeklies and then a list of a few smaller market cap stocks under $10 that tend to make large swings with decent balance sheets that I would consider for a day trade or quick swing, and possibly also a normal watchlist of a few names and use this tool to better help me time the intraday buy of stocks.

oa2

But there’s more. Even though a lot of the momentum move and rotation may retrace at some point, particularly if the longer term trend runs counter to the action, I hope that with a relatively few amount of details and information that I will be able to have some kind of edge in prediction direction just based upon 1-3 day momentum. The result of this action SHOULD change not only the individual scores AFTER this action occurs, BUT ALSO may indirectly set up certain themes for the 5-15 day time period. What I mean is this….
Say energy is down but solar is up. Lets say the larger cap solars have already rallied and may pull back while a result a number of Chinese solars, high beta, low float, high short interest, speculative smaller cap names are anticipated to rally and play catchup. As a result, we then can project that THIS action will provide not just a boost to those specific stocks, but in conjunction with all other anticipated moves, say the china names, the low float names, the high short interest names, the high beta names, etc will then begin to create a theme for the market that will provide a boost in score in 1-3 days . As a result of those themes providing a boost, names heavily tied to each of those themes, such as a few highly speculative, low float, high interest chinese internet names now will have a boost. The act of paying attention to the shorter term momentum will serve as CONFIRMATION on TIMING of not just china solar, but also increase the odds that chinese internet names sets up, and also potentially help anticipate a transition to higher risk into higher risk and a market wide boost to the short squeeze as and hopefully boost the accuracy rate in individual names as well as look into the future a bit farther by using multiple reference points to confirm the action.

In other words, where as normally you might look at a wedge pattern and can’t be sure if you are going to have a name breakout of a pattern, breakdown, consolidate sideways into a triangle, or begin a trend, with the 1-3 day momentum and short term action you have helped to better fine tune and boost the odds that the Chinese internet plays should be more likely to work on the 5-15 day time horizon based upon market’s tendency to herd on “what’s working” and then find the “closest cousin” as a derivative to what is currently in favor. Potentially you can see what others can’t and do it without even having any DIRECT evidence of Chinese internet doing anything but consolidating for the time being. By the time many of these start to break out, you normally may be too late, or you may end up chasing… Without factoring this in you are guessing which setups will work and to what extent. With this model, I hope that the short term action (and projecting an adjustment to the score as a result of the short term prediction) can strengthen the 5-15 day score into a prediction….. Then hopefully by using such a prediction I can use it in conjection with my setup score and boost the hit rate of the typical setups we like anyways.

A slight edge in the short term in a number of similar theme stocks even if the individual play and timing is wrong should play into the rotation that adds up into an edge of a greater theme, and may spot warnings of interruptions to that theme working (say all things china are extended or breaking down. A rotation into the US and out of china setting up might derail the rally at some point, until other china names can consolidate and prepare for the rotation back into china where it should be led at that time by the outperforming higher quality setups that by that point may still be emerging in china internet and china solar.

IN TURN, I hope to also use the same concept to project forward the 5-15 day action and look a few more stages ahead and have what may evolve in the distant future into a full stock market simulator that can be used to practice trading and give you real time adjustments to scores and stock prices after projecting a few periods forward at a time. If this works properly, a small edge on 1-3 day time horizon, in conjunction with a healthy edge with a 5-15 day ranking fined tune using the 5-15 day time horizon…. will then project forward to say a 10-30 day longer term swing/trend with one’s own chart reading ability, will allow you to see many moves ahead, plan out trades many moves ahead, and have already prepared for the gameplan to play the next likely rotation. Since options are priced to decay exponentially, capturing a move that moves 1% per day for 30 days straight on a 30 day option would be much more profitable than an option with 3 days left that moves 1% per day for 3 days straight. The hope is to find out stocks which are the most mispriced according to the market’s tendency to herd and chase, and rotate up risk and shift from industry to industry and assimilate “what’s working” and “what is similar to that which is working” in so many number of different groups. Imagine a contract on say GOOGL with 40 days left and capturing a 30% move on an option 10% OTM even a small percentage of the time when the implied volatility is near it’s lows. Grabbing that LARGER swing will be unbelievable if you can do it… For now, this is just a concept I am working towards, but the idea in itself is stunning and really eye opening to how the market may actually work. Some further fine tuning and tweaking may allow a full map of the entire stock market’s anticipated moves in every stock (with a certain margin of error and probability of occuring) for an entire leg of a larger sector rotation,and possibly beyond. Worst case scenario it at least would describe a market in theory that may be very valuable in setting up a simulated trading environment. Even if the theory doesn’t hold up in reality, by setting up short term movements and momentum rotating intraday and lasting 1-3 days and having each group influence one another, you can still setup a market simulator with 60000 moving parts, add in a random number generator to create a lot of noise and only a small edge to the predictability, or less randomness and less noise to simulate environments with a greater edge and you can practice trading a theoretical market that may or may not be all that different from one in the not too distant future.

Comments »

Breadth – A Market of Stocks Being Challenged?

Before the market was weak into 6/24 close the 4% movers were non existent, the correlated selloff could be displayed even if it was an only one day move and the vix remained around 12 it still potentially could be cause for concern going forward. On 6/24 85% or so of stocks were down to close out the day. Today 6/25 the 0 and 1% movers were moving and the 4% were but not by greater than the 1 and 0%. This could just be a return to a stock market rally rather than a market of stocks and the start of more correlated moves. But it is very early to say. An alternative, more optimistic view is that the leaders first made a strong move and lead and now are only moving in line with the rest of the market and the appetite towards risk is just approaching the accumulation more cautiously. I know, everyone hates people that hedge their predictions, so I will give another metric to look at. % of all up movers that moved 4%. When there was lots of leadership and the pickings were easy, about 10% of all stocks that were up were up 4% or more. Now we are down to 5.6% today. That’s still not terrible, but it requires a bit more skill to be a stock picker in this environment.

If I had to guess, I would say the reason we are still seeing some chop like this is because there is a lot of charts in the “aversion” and “denial” and “anxiety” for a smaller amount still not heading into their aversion points. This has the market a little bit on edge on both sides, and will display itself with a bit more chop and a little bit less leadership until we break right through. So in the next week or two, I would put these numbers in the context of continuing to display “aversion” (hence why you see a lot of weakness and lack of leadership to the upside for stocks over the last 3 months), for a bit longer in the longer term, while we will see some leadership emerge over the coming weeks months ahead but in the meantime, because of the volatility associated with these states, even as the VIX is down and on average volatility is low, there is still a lot of small jittery rotation back and forth as market may struggle to find leaders that stick until we enter more “returning confidence”. When you put the numbers into that context, the entire story adds up.
I’m still not going to go without mentioning that today as of the close the bearish moves caught on and stuck a bit better than the bullish ones GIVEN that they WERE down even though over 60% of all stocks were up. That may not be too alarming as it can be explained by the logic “if a stock can’t rally in this environment with all stocks up, I better sell it”, and without context around it to support cautiousness other than the move yesterday (6/24/14) signalling across the board selling

breadth

Either way, the environment suggests that it no longer is the type of market where you can be gung-ho long with much larger than usual positions that you let ride until expiration, and instead you should go back to the normal risk and normal management (or perhaps slightly larger position size with the VIX where it is if you can manage it more carefully)

Comments »

Breadth Signal: Dips are Being Bought, Advancers are Being Chased

6/16/2014 Just the action we look for in the market.


Dips are being bought and advancers are being chased (lots of positive up trend day for stocks).

breadth

While it was a relatively flat day in the market, there are signs of leaderships. The percentage of stocks advancing is only around 50%. However, filter that to be a 1% move to filter out some noise and you have nearly 55% advancing. Filter it to a +4% move to represent stocks showing signs of extreme strength and it jumps to nearly 68%. This kind of action is great for a good stock picker and swing trader as the winners will be chased, and buying the dip will offer a good chance of seeing the stock rebound. This has happened for several days the last few weeks.

The only real negative is that the last 3 months many stocks have declined big, while there haven’t been a lot of huge advancers. However, the ship has begun to turn around as the monthly data now shows really positive action, and many stocks have simply been building up a base for the next round of leadership.

rotation2

With that being said, the energy sector has lead, and now the solar sector, a derivative of the energy sector is starting to go while utilities are building a base from prior uptrend and may follow. This may support the view that we are in the “later innings”. Nevertheless, there are still individual opportunities out there. Keep an eye on the vix for signs of caution and the market detaching from risk.

Comments »