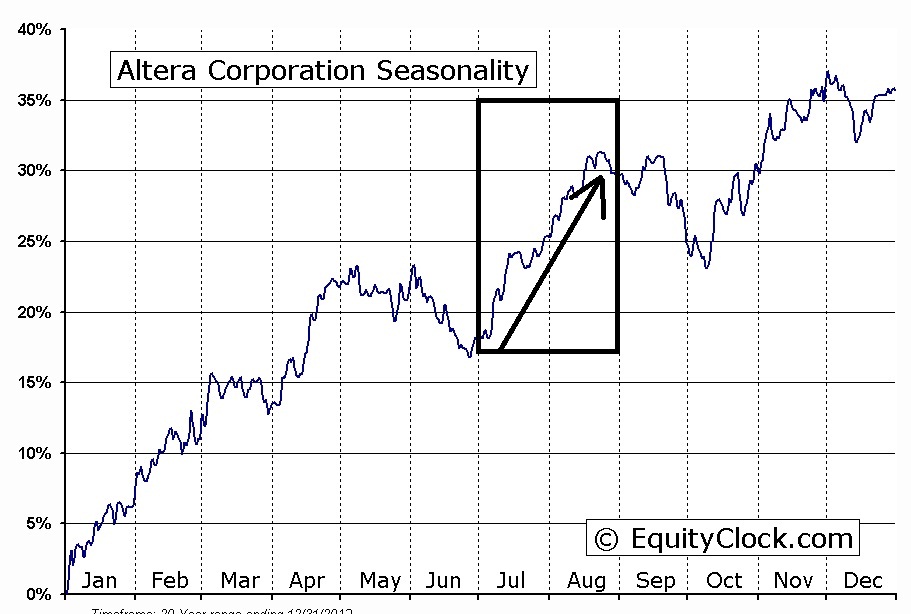
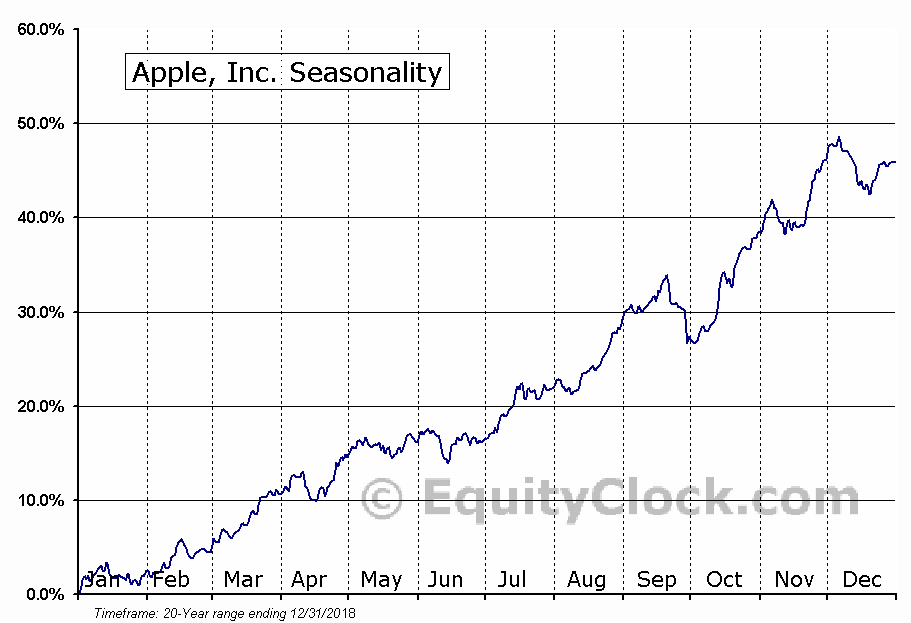
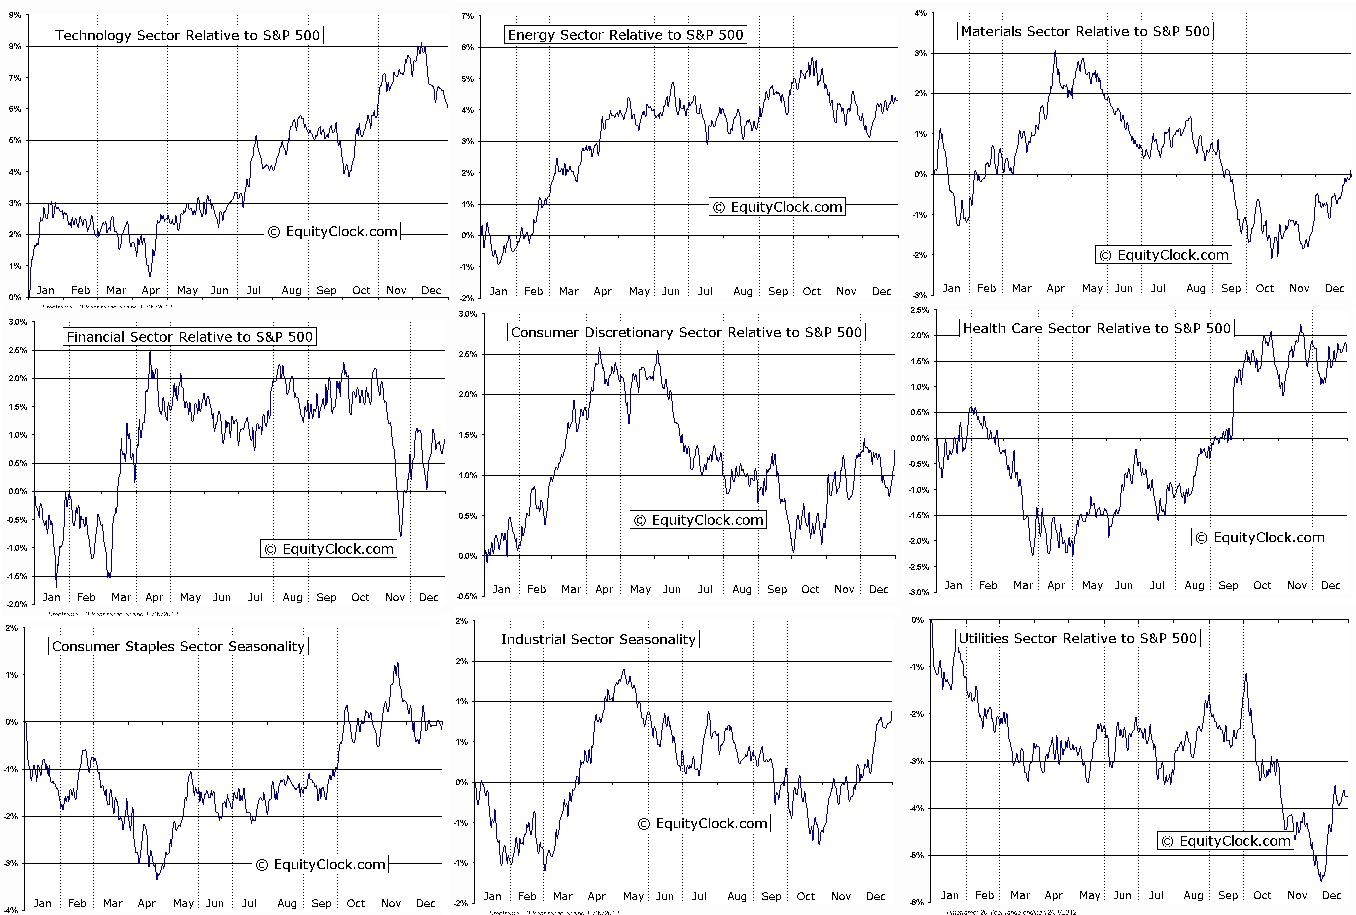
If the seasonal tendencies are any indication, you should get a real nice opportunity to buy Technology in October.
The sector data is very relevant because when an entire sector shows out-performance during seasonal data, you have an average of hundreds, or thousands of individual stocks that would have performed well enough over that period each year that the study is done.
That sample size is “statistically significant”… geek-speak for “relevant”. If you can show if the entire tech sector as a whole outperforms and offers an excellent entry early in October, then you can be very confident that this is likely not a case of being fooled by randomness. 6 out of 10 coins could end up heads or even 7 and fool you as to whether or not you have an edge, but if 650/1000 coins come up heads then you can with a confidence say that something the coin flipper is doing has given him an edge. That’s not to say that it isn’t possible that there is nothing to this particular set of data and it is just “luck”, but just that it’s much less likely with such a large sample.
That’s also not to say that I might not have a greater edge finding the specific seasonals that perform the best. Tech may outperform by 2% while GPS seasonals may outperform by say 5%, but I will have much more confidence in the data being relevant for the average technology company. And I want to solidify my edge before I look to enhance it.
Thus, I am not inclined to care as much about individual seasonals unless it is first supported by the sector since this could just be a case of a coinflip that came up heads 4 times out of 5. Not statistically unusual when you have so many individual stocks or “coin flippers”. One of them is bound to get heads 5 times in a row. So where is the proof of a mathematical edge? There is only a small level of confidence of an edge in individual names except for maybe a few companies trading for a handful of decades.
However, sample size quality rather than quantity is what determines relevance and usefulness of the data. Since I can be reasonably confident tech will outperform during the month of October and beyond, NOW I want data that I can use. In other words, since I know this coin flipper flips 650 out of 1000 coins, now I can compare when he flipped the coin with his left hand vs his right hand.
That is a metaphor for being able to use data with a smaller sample size, as long as it is in this case contained within the technology sector. Since I am starting with an edge, and then selecting individual seasonal data, I already have the confidence of outperformance, and now it’s just an attempt at improving upon that data.
Maybe because of the lower sample size at this point, you only end up with a 60% chance of improving your odds over the average 650/1000 or 65% chance. But that’s more confidence than if you randomly selected just any tech name, (50% chance of improving beyond the average chance) and you still have a much higher degree of confidence that this will outperform the S&P. Plus you have to narrow down the list of the 900 tech companies to select one of them anyways so using it as a filter after the sector/industry/stock is determined to have an edge to confirm the bias is fine.
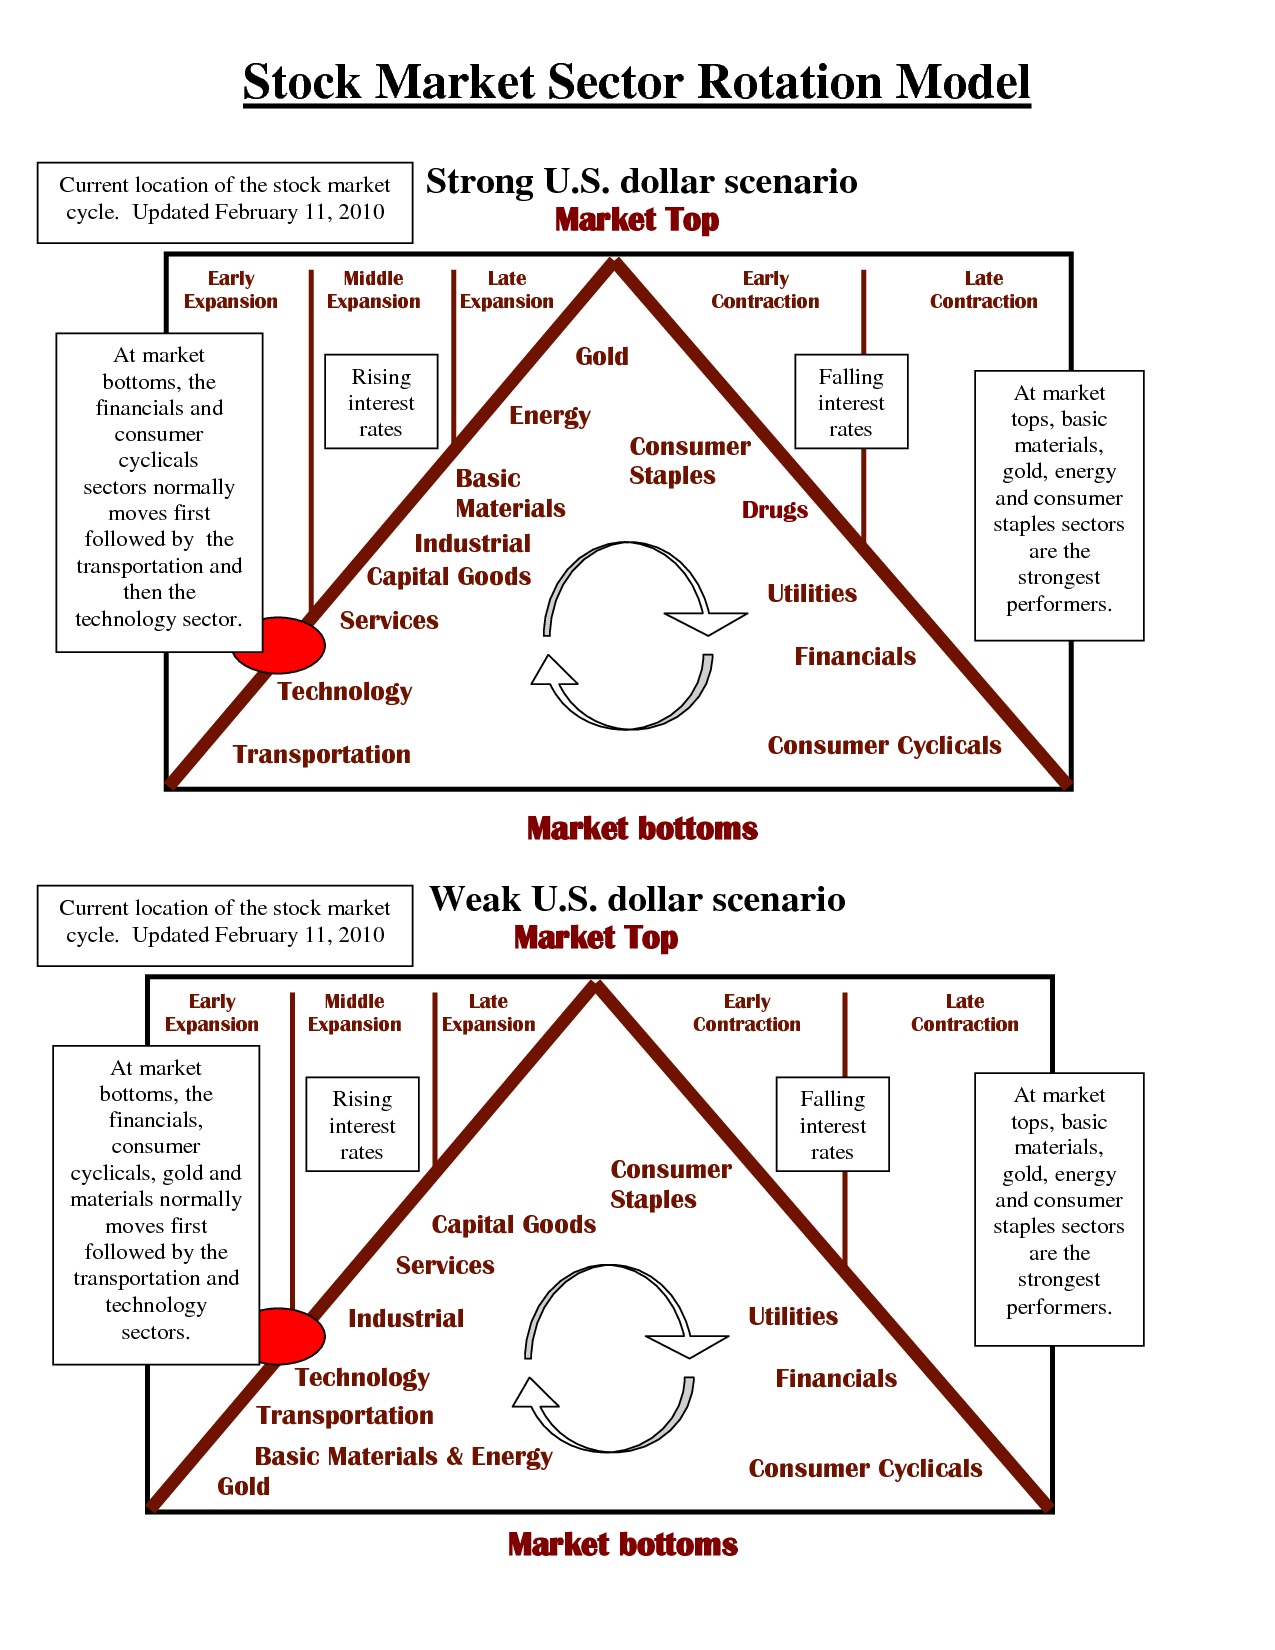
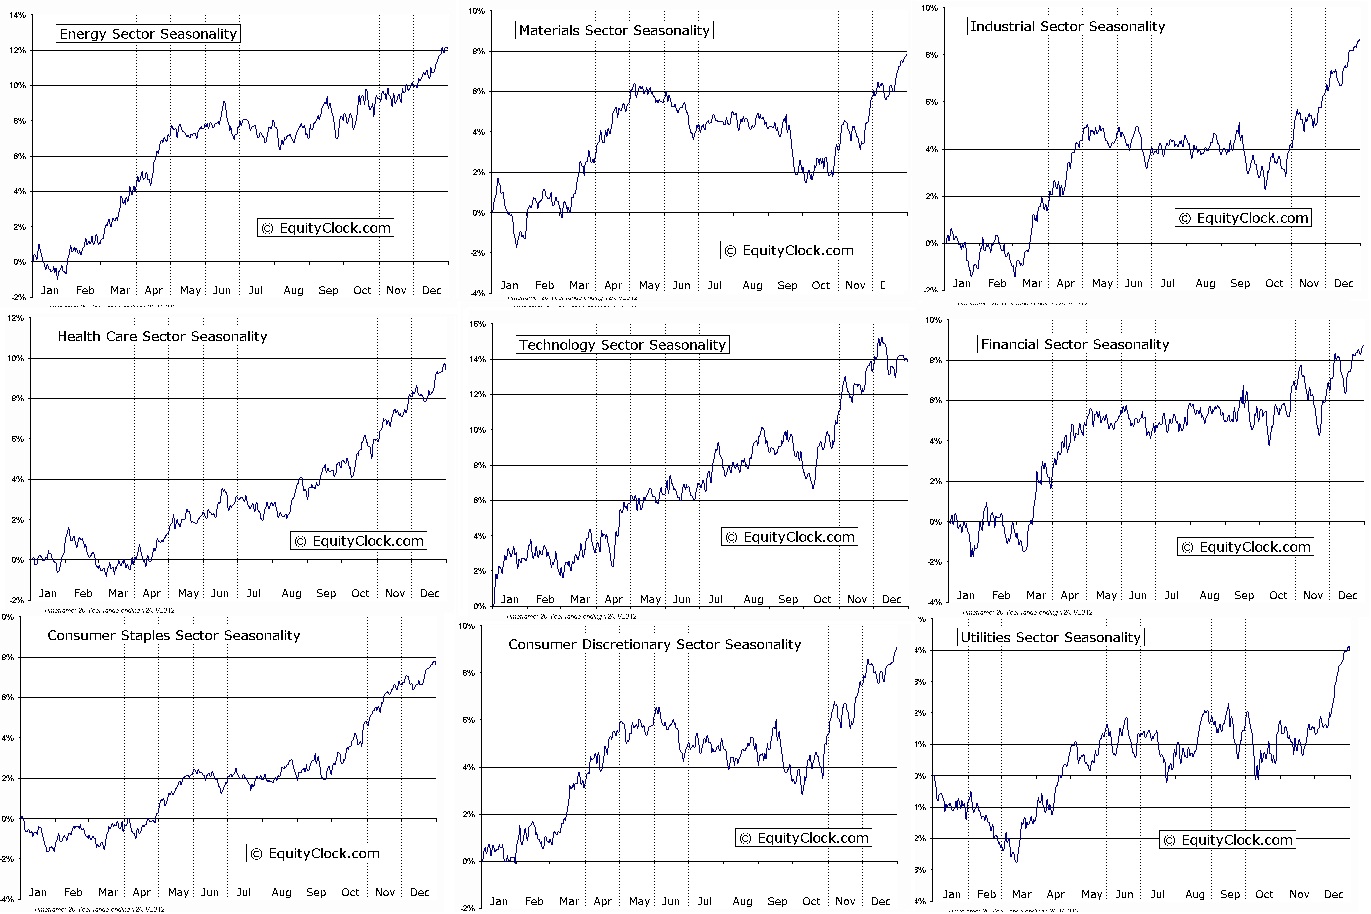
Side note: I like materials too because the seasonals are beginning a bottoming process (and individual materials may lead before the sector bottoms), and the sector rotation outlook also supports a rotation into materials soon as well.
All sectors in October: http://charts.equityclock.com/2012/10/page/24
Technology starting with those relevant in October: http://charts.equityclock.com/category/technology/page/6
Materials starting with those relevant in October: http://charts.equityclock.com/category/materials/page/6
(note: Dates are in reverse order)
Maybe you don’t care as much about individual seasonals as a filter. You can filter in other ways. There are 867 stocks in the technology sector via finviz. Put a filter of over 50k volume and it’s down to 675. Filter price over $10, Volume over 100k, optionable/shortable gives you 383 tech stocks. If you only look at those with weekly options, you get down to 49 weekly option tech companies.
Now maybe when you are looking for “short squeeze” candidates you add “float short” over 10%, and only look at those with a total float under 50M, as it won’t take as much buying pressure for these to have their supply of shares consumed. The idea behind this is since you expect tech out-performance, if the sector is being bought up, the shorts will get under water, and the thin supply could mean very explosive price moves accompanied by a major short squeeze.
Low FLOAT:
UNXL,QIHU,SCTY,YELP,VHC,
I also like to include those with a float/market cap under 2% so I may add a couple. In other words, less than 2% of the market cap floats. This is also a recipe for a short squeeze. It is a measure of scarcity of float relative to market cap. A mega cap 100B company having only 60M shares that float is more likely to see a short squeeze than a 80M company with 60M shares that float. That includes the following
QIHU,VMW,YELP,SCTY,DDD,FSLR
Combine the two and that gives you the trading list:UNXL,QIHU,SCTY,YELP,VHC,VMW,DDD,FSLR
So then you can just look for the technical setups you like the best or whatever ultimate filter from that list you want to use.
If you are not looking for low float, short squeezes, but instead laggards, you can come up with another screen for those. I think knowing what the market appetite for risk is, really can improve the trading as you narrow down to individual names as we have all seen Option Addict do it. The point is, you start with an edge, and now you are just trying to improve that while narrowing it down and simplifying the names you look for to trade.
There are plenty of other ways to develop the list and you may want to start from the initial 867 stocks in the tech sector and apply your own filters or manually look for the best setups. I personally really like the names of the results I got above. Yet If you are looking for some specific kind of trigger such as a bull flag or a specific candlestick pattern and stick to trading those, or an oversold RSI you may want a larger list than that and filter it down on your own, perhaps including a manual visual look at all the thumbnails.
I am not suggesting you should just use the statistical edge as the only reason to trade tech. Instead I am adding a “priority” on the sector. If I get any specific setup I like at all, I will make sure to trade them. If I am between two names, I will go with the tech company. If given a close choice, I will be overweight in tech and have more tech. Just a slight bias or extra focus towards scanning through the sector is all you need. How you find an entry point and determine whether the trade qualifies is up to the individual.
Some might want fundamental screens, or go through all the charts to find technical set ups, or copy and paste all those with seasonal data that provides a relevant opportunity in the month of October into the tickers to only go through those. Some may also want to run through fundamental analysis. I find the site wikiwealth.com useful for fundamental analysis, and of course finviz screens.
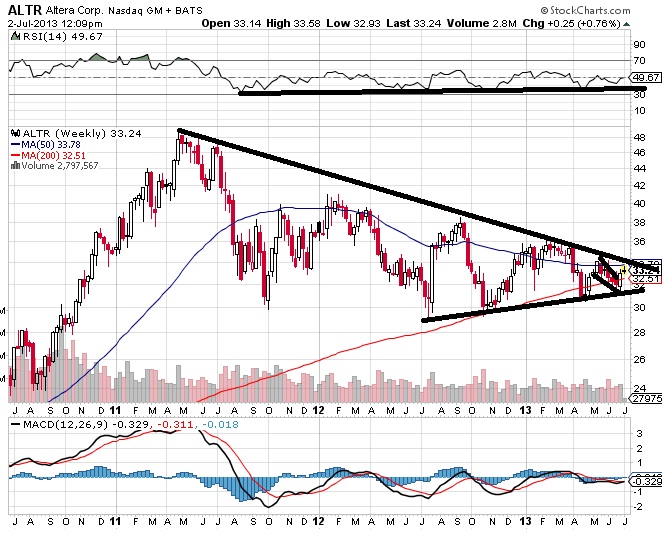
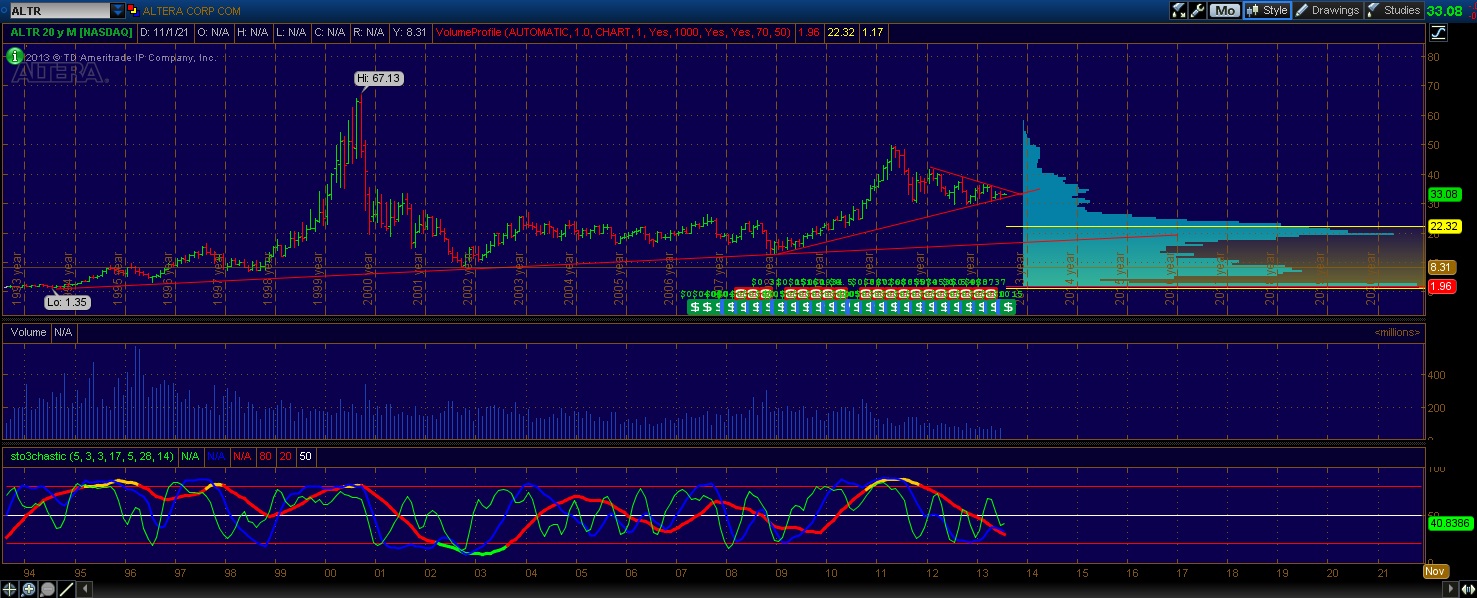
Putting up relevant filters is about increasing your odds, and trading with multiple tailwinds at your back (as we outlined with ALTR and others). It is about finding the stocks that will move enough, that you have an edge on, that you have confidence will work.
Comments »