iBankCoin
Home / market outlook

market outlook

Breadth Is A Little Too Strong

breadth

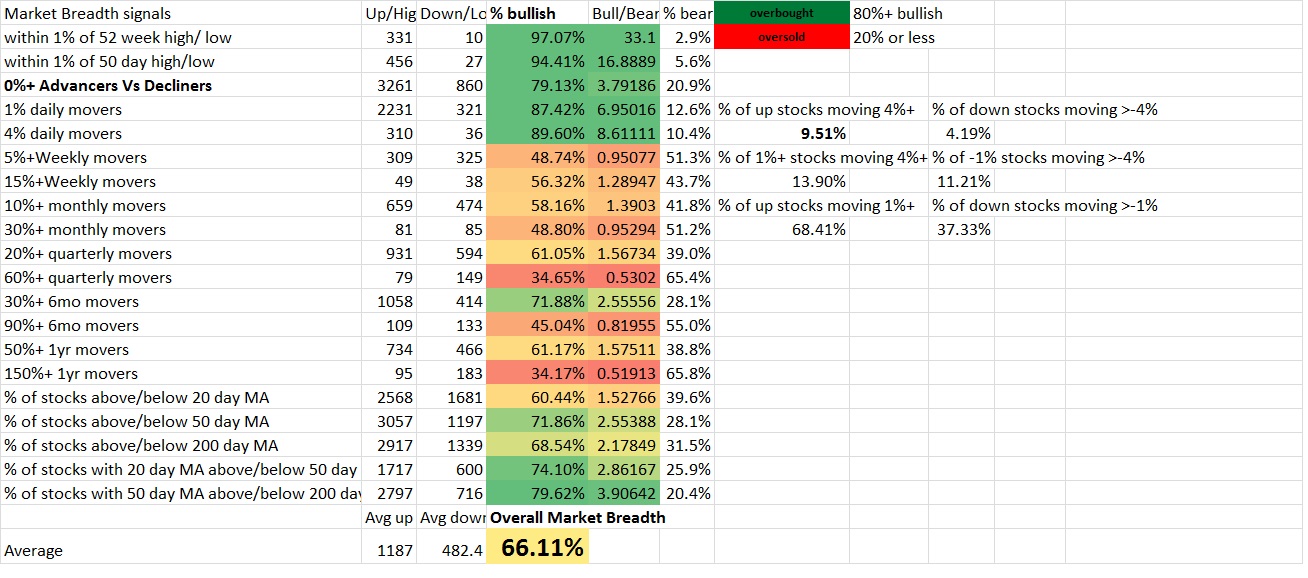
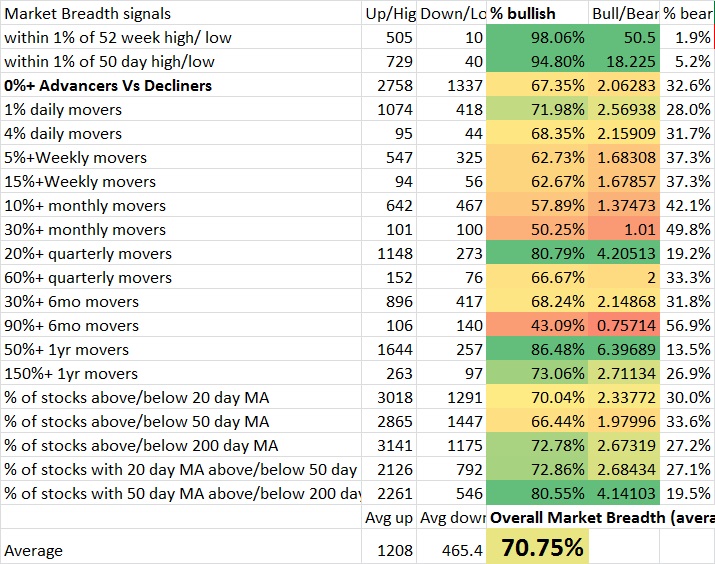
Right now it seems that the breadth reading over various time frames is coming into the range where you need to be cognizant of any potential sell signals. Overbought can stay that way for a long time, but keep in mind that the more overbought a market becomes, the more amount of new buying it requires to sustain the newly established prices. Some strong markets can stay overbought for a long time as people wait for dips that aren’t available and people chase and even go on margin until they are flushed out.

As Charles Ponzi eventually learned, you need increasingly more new money to pay off the old. Don’t get me wrong, I’m not suggesting the market is a ponzi scheme, but that in certain ways the mechanism will operate the same way. More buying demand, higher prices and new investors… but too much buying demand and too many investors to pay off and suddenly prices are unsustainable for the time being. In a ponzi scheme the gig is probably up, but in an actual market backed by earnings the bullish trend can resume after a repositioning period.
The market is backed by solid earnings, but earnings are less important than how the market reacts to them. Price is governed only by buying demand and selling supply, everything else is a rationalization of WHY the buying occurs. It just so happens that strong earnings and valuations happens to be one of the more persuasive rationalizations for people to buy. However, should investors reach a point where they’re all tapped out long and can’t recruit any more buyers, the market will have to rest or sell off until people can come up with more cash and credit or more capital from new money enters the market or shifts from another asset.

In Paul Tudor Jone’s “Trader” documentary I believe he said something about how this occurred throughout the 80s in a strong bull market. It’d rally up overbought as people chased until they were over levered long and then it’d gap down. The market would force everyone to be leveraged long and then the crashes would be bullish as it would flush people out and they’d quickly try to chase after satisfying the margin clerks. PTJ’s take was that the market was governed by private and public debt and margin. Each had a cycle of when payment was due and when cash would leave the system, as well as the introduction of new debt that would inject capital into the system. This eventually lead up to the 1987 crash which many feared was a sign of a new depression on the way until it eventually took out the high.

So to be clear I am not, nor is the breadth predicting a crash, but I’m saying the market is backing itself into a corner where should this buying pressure continue, a selloff is perhaps the only healthy move left, an alternative is a buying mania that gets money off of the sideline and enters a more of a bubble market, or increased debt and margin so that buying persists and the market becomes increasingly vulnerable to a crash. The Feb 1st print of a VIX under 10 also may have signaled complacency.

I’m a little concerned about a correlated selloff ahead as the market has had such little correlation, such low VIX, and so many more stocks moving higher than moving lower over various time frames.

Breadth is usually more of a concern when it begins diverging from the market and showing decreased interest and increased selling under the surface from high levels, but be aware.

Comments »

Take A Big Breadth


broad-breadth breadth

Taken from early this morning less than an hour after the open. We sold off since then and the breadth is less overbought on daily basis now.


Most recent signal pulled nearly 2 and a half hours after market open. Still seeing bullish activity even as Russel reversed the gains and turned negative on the day. Seems like market is just digesting gains for now, and market is still largely in chase/short squeeze mode on the day.

breadth2


Comments »

Topping Pattern

In the post titled The Unconfirmed Top, I went into why I thought the risk/reward favored the bears.

I sitll believe that to be the case, and now am thinking there’s a real good entry right here.

Take a look at the dow.

dow

Major markets as a whole
toppy

The silver lining is in the optimistic line drawn in the dow and that this is a giant fakeout combined without having a euphoric, huge volume top.

However, with such thin volume, it also wouldn’t take a lot for the stock market to move upwards or downwards quickly with significant buying or selling pressure.

acwi

The all world index looks bearish as well…

However, again, there’s a silver lining. In this case, it looks like the market swiftly rejected head and shoulder breakdowns across the board.

The failure to breakdown can be very bullish IF the buying pressure allows us to take out highs. This could trap a lot of shorts and provides fuel for an explosive rally over the coming several months.

The alternative is that we fail to get past highs, bears reinitiate and eventually the buyers that bought the breakdown give up buying and capitulate which leads to swift selling.

So it’s about risk/reward, and I believe for the time being the entry can be managed most effectively to the downside here.

Comments »

The Unconfirmed Top

I believe the market provides superior risk/reward for the bears than the bulls at this time, even if the current momentum is in the bull’s favor, and even if there is no confirmed bear market yet. The IWM shows about $25 potential reward to $5 risk. I don’t think the full $25 potential will materialize, but even if you only get $10, the trade has profitable expected value as long if the market produces a win more than 1/3rd of the time.

unconfirmed

unconfirmed2

On an intermediate time horizon, the trendline starting from the 2011 low created a 1-2-3 topping signal which set up sometime around November 2015. This was also a retest of a triangle top which probably moved too fast for most to react to.

Unfortunately, the decline failed to take out the prior low in every market, on both a weekly and daily closing basis, so there’s some confusion as to whether we have entered bear market or bull market.

For now we actually have a couple bearish trend channels that have begun to form and either remains a viable sign of a bear market. However, the more conservative bullish trend channel has not been breached, nor has the trendline starting from the 2009 low. Additionally, the other possible bullish channel was breached briefly, however in the rally we have regained support.

So that leaves us caught between a rock and a hard place as far as predicting price goes. Fortunately, there are still clear areas from which the risk reward favors one side over the other, and risk/reward is the name of the game.

Right now we are overbought entering supply zones where the bears who sold will defend the break even and the bulls may look to sell while they have a buyer in positions that are underwater.

The areas of supply are at 205-212 range in the SPY, 110-117 in the IWM, 107-110 in the QQQ (not top heavy) and the 175-180 range in the DIA.

The QQQ actually has a more bullish volume profile in that it has history of volume from 101-106 where the bulls directly below seem to outnumber the bears directly above. Nevertheless, with the other markets suggesting greater risk of running into resistance and selling off, the nasdaq bulls could quickly end up under water and the bulls could pile on and if prices move below the 101 level things could very quickly shift to where the sellers are in control.

The overhead supply provides an easy out for sellers to get back there shares at a slightly higher price while the gap below provides potential for gains. Past price history and volume suggest the amount of future transactions that take place as well as the speed of the price movement away from volume clusters and towards price discovery through volume pockets until new transactions are found.

Apply this principal to the IWM.iwm

You can see there is risk of a fast move below. There was very few transactions as the IWM rose above 85 to 110.. There are enough transactions at and above 110 that are underwater and bears that may look to reinitiate at similar prices. This creates the conditions for selling, and without much history of transaction below, prices move until it finds new buyers. The volume profile suggest that unless new money that wasn’t interested in buying on the way up in the 85-110 range suddenly decides to on the way down, or unless short sellers begin to take profits and establish a bid, you could see the market continue to move downwards as there will likely be more selling supply than buying demand.

Even if the profile won’t tell us what will happen, it can establish an objective measurement of risk and reward locations. For selling to be a bad idea, you’d have to be wrong a much larger percentage of the time than 50/50 if you manage risk so that you have the markets moving as much as $25 down when you’re right and no more than $5 upwards when you’re wrong. Certainly it’s possible that the market catches a bid and you have to close out your gains short of the $25 reward at the $5 risk, and certainly you may be right less than 50% of the time, but the odds are in your favor that you have a profitable trade on the bearish side.

Comments »

Possible Long Entry Signal

“When a man looks into the abyss he finds his character… And it’s his character which prevents him from falling into the abyss” -Gordon Gecko

Right now the markets are overlooking an abyss. I’m sure many have noticed. And perhaps it’s fueled pessimism. The question is whether or not we will fall into the abyss. If/when there’s evidence we won’t, there may be a good bullish entry in development.

Victor Sperandeo In his book Trader Vic discussed 2B  bottom and topping pattern. There’s good stuff on it here. (insert 2B or not 2B joke here)

There’s always a debate on whether or not to use intraday signals, or to wait until the session closes, and whether or not to use daily or weekly signals.

2b

Since I’m limited in time, I will stick to the more significant signals which tend to provide a bit higher confidence in their success, but provide fewer opportunities to take a trade.

Right now we have a week that potentially will close below significant levels (depending on which prior “low” you consider relevant, and which market you are looking at.)  If it does, one way to plan a trade is to use this week’s high as the trigger (a close above it), and this week’s low as the stop.

You’d then typically target the recent high.

This signal is nothing magical, and I want to make sure you understand the psychology behind it.

The strategy works because of a few keys. The psychology is such that you can trigger a chase, following the market getting too one sided. In this case we are looking at the bullish signal, so the market gets too bearish, a breakdown signal occurs, and then we move above the session high during that signal. The tendency of the market to trend from extremes is combined with manageable entries. Basically, recent session high/low can often act as support and resistance providing a manageable entry and manageable exits. The prior low is also a significant psychological barrier which can trap a lot of people short, and the move above that session’s high can trigger some chasing to cover as the short term traders covering or getting long can trigger some of the longer term technical traders who bet on a top and witness it move beyond their pain tolerance levels to the upside, causing a bit of a short squeeze.

Volume profiles can also be used to better understand the psychological breaking points, and you can modify an exit contingent upon what the volume profile looks like to fine tune the trade to the psychology of a stock or broad market…

Right now this signal is unconfirmed, but I have noticed enough pessimism for this to be a decent signal, and the volume profile supports it being a manageable entry with better likelihood of a move due to less price history in the areas above the entry and below the stop.

SPY

AN ALTERNATIVE way to trade it is to get short at some point between here and the signal and use the “buy entry” as a stop. The volume profile also suggests a fast move to the downside is possible. That supports the importance of the stop below if you buy a move above, but also allows for the reverse signal… Taking a bearish position while using the upside volume profile risk and “buy signal” to close out a bearish position. You would and target a downside move to fill the thin profile below.

How can both bearish and Bullish be right? Ultimately, only one trade will win, but the reason either trade can be profitable is the risk and reward is such that the probability of success doesn’t need to be 50% to win. As long as the psychological litmus of the volume profile and tendcy of the markets to move to and from extremes exist, this trade carries with it an edge on either side.

Broad Market Signal vs Portfolio Management

I’m using the broad markets for the signal as more of an idea of how to shift portfolio allocations and position sizes. If the market is in buy signal, perhaps increase position sizes or increase risk allocation (number of positions long). If it’s a sell signal, perhaps decrease position sizes or reduce risk allocation. Or perhaps if you’re aggressive shift from net long to net short depending on the anticipated market direction.

Since there’s fast zones above and even faster below, you could also strategically hedge using the broad markets in either direction so you aren’t overexposed to one side.

Note: This is being posted 2/11, but images are from 2/10.


Comments »

Market Outlook

Let’s start with the transports which are the greatest sign for concern for the general markets.
transports warning

You can see a failure to make new highs, a breach of prior lows, and a breach of the long term trend channel. However, in order for markets to be confirmed bear market, you need ALL major markets to show the same thing.
So let’s look at the S&P

spx

If you were to draw a single trendline from the lowest low to the most recent low, you certainly have a trendline breach. However, the trend channel appears to be intact, and because the most recent low didn’t close the week below prior low, it remains unconfirmed by some definitions. However, the weekly close of week ending 1/16/16 was a lower weekly close than the prior weekly low (on closing basis), we have a lower weekly close than the 1/16 close, so it’s definitely leaning towards confirmed breach of recent lows. Nevertheless, the oversold conditions near a long term trend channel support is certainly a historically a good location to be a buyer, not a seller.

Let’s look at the dow.

dow

The long term broadening pattern formed resistance that temporarily was broken to the upside but failed to stay above. As we zoom in we can see that the long term trend channel has been breached. The rest is a little confusing once again because the daily/intraday shows a higher lows, but on a weekly closing basis we have the current recent low lower than the last 2 and a pattern of lower lows and lower highs on a weekly closing basis.

Finally, I saved the most fun chart for last, the nasdaq.
nasdaqWe can see that the all time high of 5132.52 acted as resistance, even though we surpassed these highs briefly. Also interesting is that the next high following the 2000 top is acting as support. The recent low is above the October 2014 closing lows, but below the August-September 2015 closing low despite being above the open of August 24.

In conclusion, there isn’t a clear, decisive bear market underway just yet. There is some evidence for a range bound market, some evidence for a short term bounce, and some evidence that an intermediate term, or even long term correction may be in development (unconfirmed).

However, the signs suggest considering caution into strength moving forward. There certainly is evidence pointing towards a short term correction if you are judging off of the weekly closes of the lows. The fact that ALL markets are showing a lower low on a weekly closing basis than the low made in the August-September 2015 time range is significant enough to create cause for concern and a minimum of lighter position sizes and/or number of positions moving forwards. This concern is increased by the fact that the July 2015 high has not been breached, but in the current position (short term) are somewhat mitigated by the location of stocks still in an oversold condition near long term trend channel support.

If you were to draw a single trendline from the 2009 low to the most recent significant low, all markets show a breach. You would thus consider selling the next bounce or the retest of this breached trendline in a 1-2-3 trend change. The retest would probably correspond to up to a 3-5% rise in the dow.

Comments »