Some people like to short breakdowns of bearish patterns or “shorting into the hole”. Let me show you why that has been a terrible idea at least during a bull market.
The following is the results of simply buying the breakdown and holding for 3 months. No stop. No targets. No complicated additional signals. Virtually every bearish “breakdown” reverses so hard it ends up positive and many of them actually beat the market. You could have bought the broadening top breakdown or a bearish pennant breakdown or a diamond top or double top breakdown and end up beating the market.
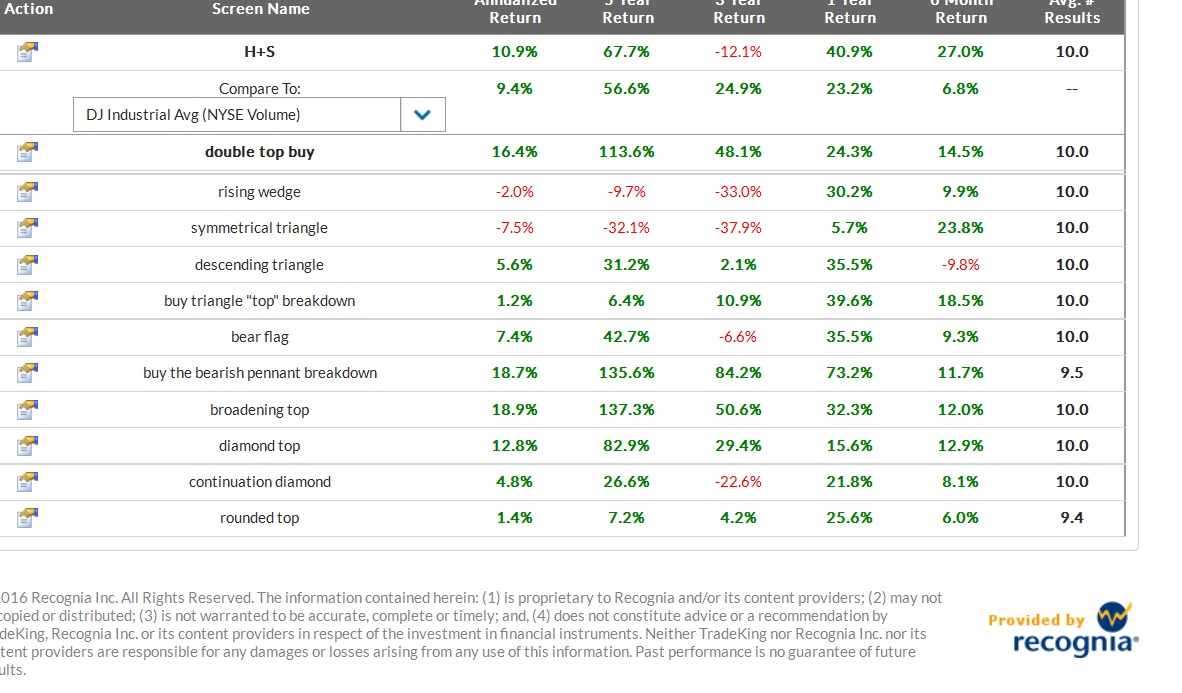
These results of course are volatile and ever changing, so don’t expect the future to necessarily resemble the past. Still it’s a good reminder of why fighting bull markets by “shorting into the hole” is probably a terrible idea.
Certainly you might argue that you’ll be in and out much sooner than 3 months, but had I put another criteria on it I’m sure the results would also have been bad for the short. Maybe you’ll find the one exit strategy that works for this strategy, but I’m not going to bet on it.
Let’s look at some bullish patterns of buying after the stock breaks out.(buying late)
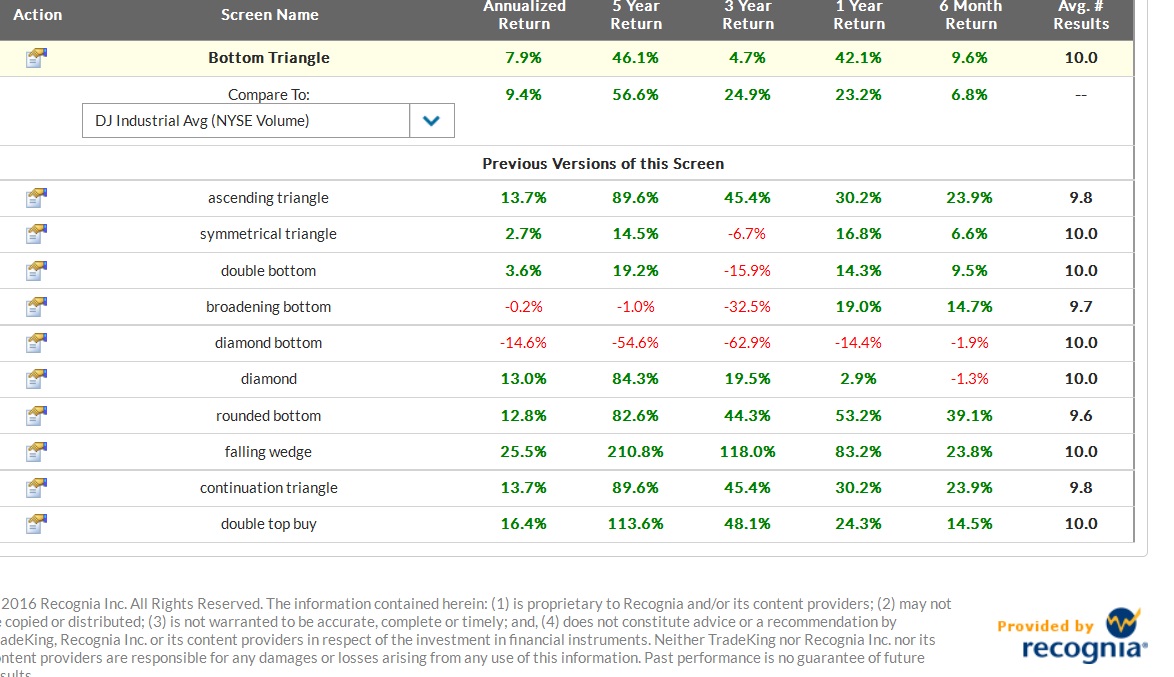
Only falling wedges (which has been an awesome pattern) beat buying the top 3 traditionally bearish patterns after the breakdown. Some of them didn’t even beat the dow. Buying falling wedges BEFORE they breakout is probably better still.
I don’t know if anything is necessarily actionable here in terms of adjusting your strategy because there was a time when diamond bottoms were one of the top patterns and falling wedges were only slightly above average at least if you bought from the breakout. There also was a time when inverse H+S worked brilliantly and times when it didn’t work very well.
But there is a lesson here.
Be early or don’t bother. (Generally).
Also, since the strategy is to be early, we could work to try to fine tune what exactly triggers an entrypoint and how we prioritize which stocks to enter in a watchlist. We can look at setup quality to some extent but that’s a little subjective and might only help us narrow down a large list to a smaller one.
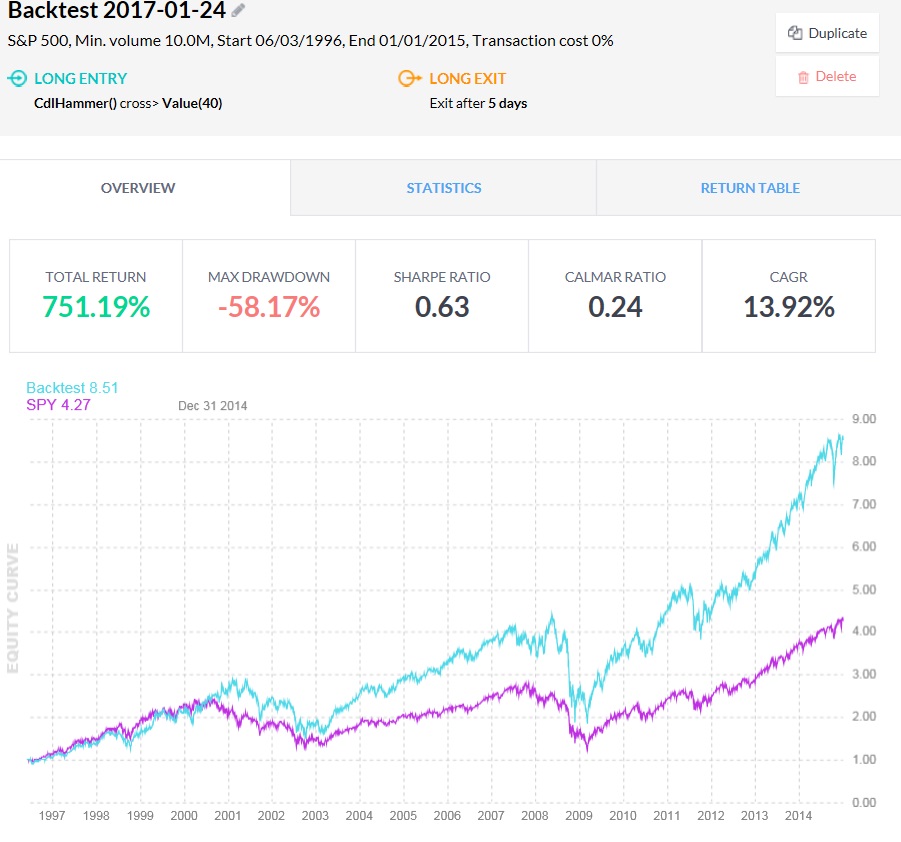
So we can use backtesting for looking at “triggers”. If you can find a simple signal to trigger a trade within the context of a developing pattern and backtest it, it should beat the market if it’s a better signal than just “randomly” buying.
The bullish hammer candlestick pattern:
And the RSI(5) crossing below 20 (buying oversold).
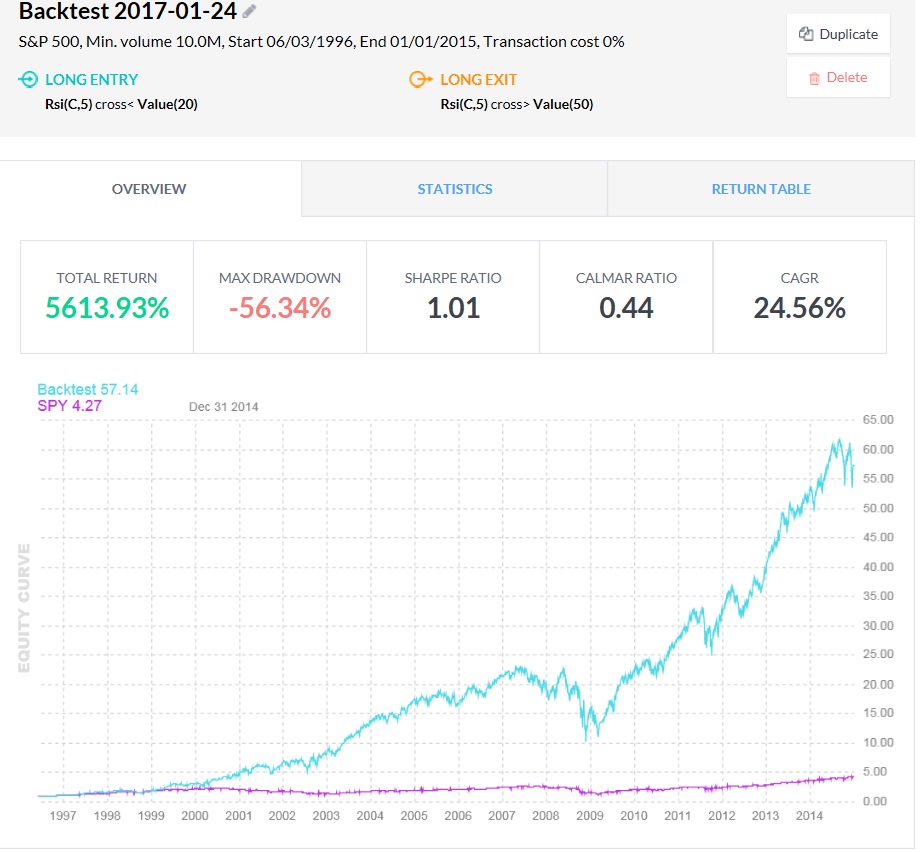
The RSI particularly is not a good signal to use on it’s own even though the results are good. This only backtested S&P stocks which reduces the risk of holding a stock going down to zero as a removal from the S&P would constitute a sell. There’s really no risk management if you’re buying something oversold without likely selling it more oversold. However, if you buy oversold with a developing pattern providing a clear support area, you can manage the stock by selling a failure to hold support and that actually probably makes some sense since there’s still a range of buyers now selling. Also, if we are using OTM options to buy we have a built in risk management mechanism of the full premium so we still have exposure after the pattern breaks down and it still can reverse.
A candlestick pattern can be used on its own in some regards since only holding it for 5 days limits the probability of it going down too far and has a proportional chance at an equal upside. Also, if you had to you could sell on a close below the candlestick pattern low itself or find a candlestick near support of other candles and sell on a close below one of those. Nevertheless, the only time I like using candlestick patterns on their own for a signal is as a hedge. It can be hard to find a bearish pattern worth trading during a bull market unless you have a process to quickly identify one that will at least underperform and reduce risk exposure, if not actually decline in a bull market.
There are other worthwhile triggers from your watchlist to activate a trade.
The purpose of a trigger should be one of the following (or more)
1)To increase chances of the trade working in your favor (the signal should have better than 50% chance of an equal move to the upside as to the downside).
2)To increase the risk/reward (the entry should be lower or closer to support).
3)To decrease the time waiting for the trade to work (The entry should be closer to the breakout point).
4)To narrow down a group of stocks to the one that is most likely to provide the best risk adjusted return.
Aside from RSI oversold or a hammer candlestick there are a few more triggers:
-Buy at support or near support or even below support intraday and exit on a close below support (better R/R)
-Pattern within pattern setup. (momentum of intraday pattern may trigger the actual pattern you’re trading to break out… plus this generally means greater consolidation and greater volatility/range expansion usually results)
-Breakout of pattern within pattern (Rather than buying before the intraday pattern goes you wait until it starts to move and this way you may get it closer to the regular pattern’s breakout point)
-Break above prior day low in bottom half of pattern (usually a move above the prior candle leads to some sort of short term price movement that may trigger a breakout)
-Tight multiday range (volatility compression leads to volatility expansion A.K.A. breakouts)
-Near Apex of pattern (shortens your holding period waiting for the pattern to develop and break)
If you are still having trouble deciding which stock to add from a watchlist, there are other factors you may consider:
-Picking the stock from your watchlist with the highest short interest
-Picking the highest reward/risk
-Looking at the underlying options and finding the option with the best reward/risk
-Using the best reward/risk and calculating the amount you have to pay to get that reward/risk for every remaining stock and putting a good till canceled limit order there and then just watching to make sure the pattern is still in tact and canceling the trade if it breaks.
Not all of these ideas are easily testable with the available backtesting tools, but you should at least have a process that clearly defines or provides rough guidelines for a method to decide which trade to enter, how many trades you can enter with the same expiry, how much max option exposure (current portfolio), max exposure (by initial purchase), max number of purchases in a single day/week/month… and a checklist to go through in the morning before trading and before placing each trade to help you navigate these decisions.
I’m still working on defining this, and I’ve been trading for >10 years so it isn’t a must… but I’m pretty sure I’d have better results if I was more organized and had a more precise process… At a minimum it’d bother me less if I missed a buy… because this way it won’t be because of lack of organization, but instead just because of the way I chose to define the system.
update: Here’s an outline of a trading system I’m working on to more clearly define decisions and to eliminate uncertainty with regards to decisions.
Generally you should aim for the best R/R on the trade you make itself if any one trade is clearly above the others… outside of that.
Here’s a possible priority list:
1)RSI (5) combined with intraday RSI oversold (1m,5m, or 30m) while in the lower half of the pattern and near support.
2)RSI(5) combined with hammer candlestick at support (rejecting breakdown of support)
3)Hammer candlestick at support
4)At pattern support independent of any other signal.
5)RSI (5)
6)Tight day range
7)Hammer candlestick somewhere near support
8)Pattern within pattern
9)Close above prior day
10)Breakout of pattern within pattern
11)Buy the failure of the pattern (breakdown) and wait longer.
12)Breakout of actual pattern but within 3% of breakout point and 10% of low.
I still kind of think that calculating the cost of an option at support at the current day and prioritizing by the risk/reward at that price (and then canceling the remaining orders if you hit your maximum) might be the best approach… but with multiple strike prices and expiry cycles and different targets depending on expiry cycles that can be a little challenging too.
Even having this priority list isn’t really enough to tell you how patient to be waiting for a priority 1 vs whether or not you should just take any one of these triggers. It can tell you if you have 5 stocks you like and only want to buy 2 how to decide which ones to choose, but it is only a small part of the trading system.
Comments »