There are various themes that can put the “wind at your sail” so to speak.
There’s fundamentals suggesting a stock worth more than the price.
There’s technicals suggesting a good setup to manage risk and also an increased likelihood of a big directional move in your favor.
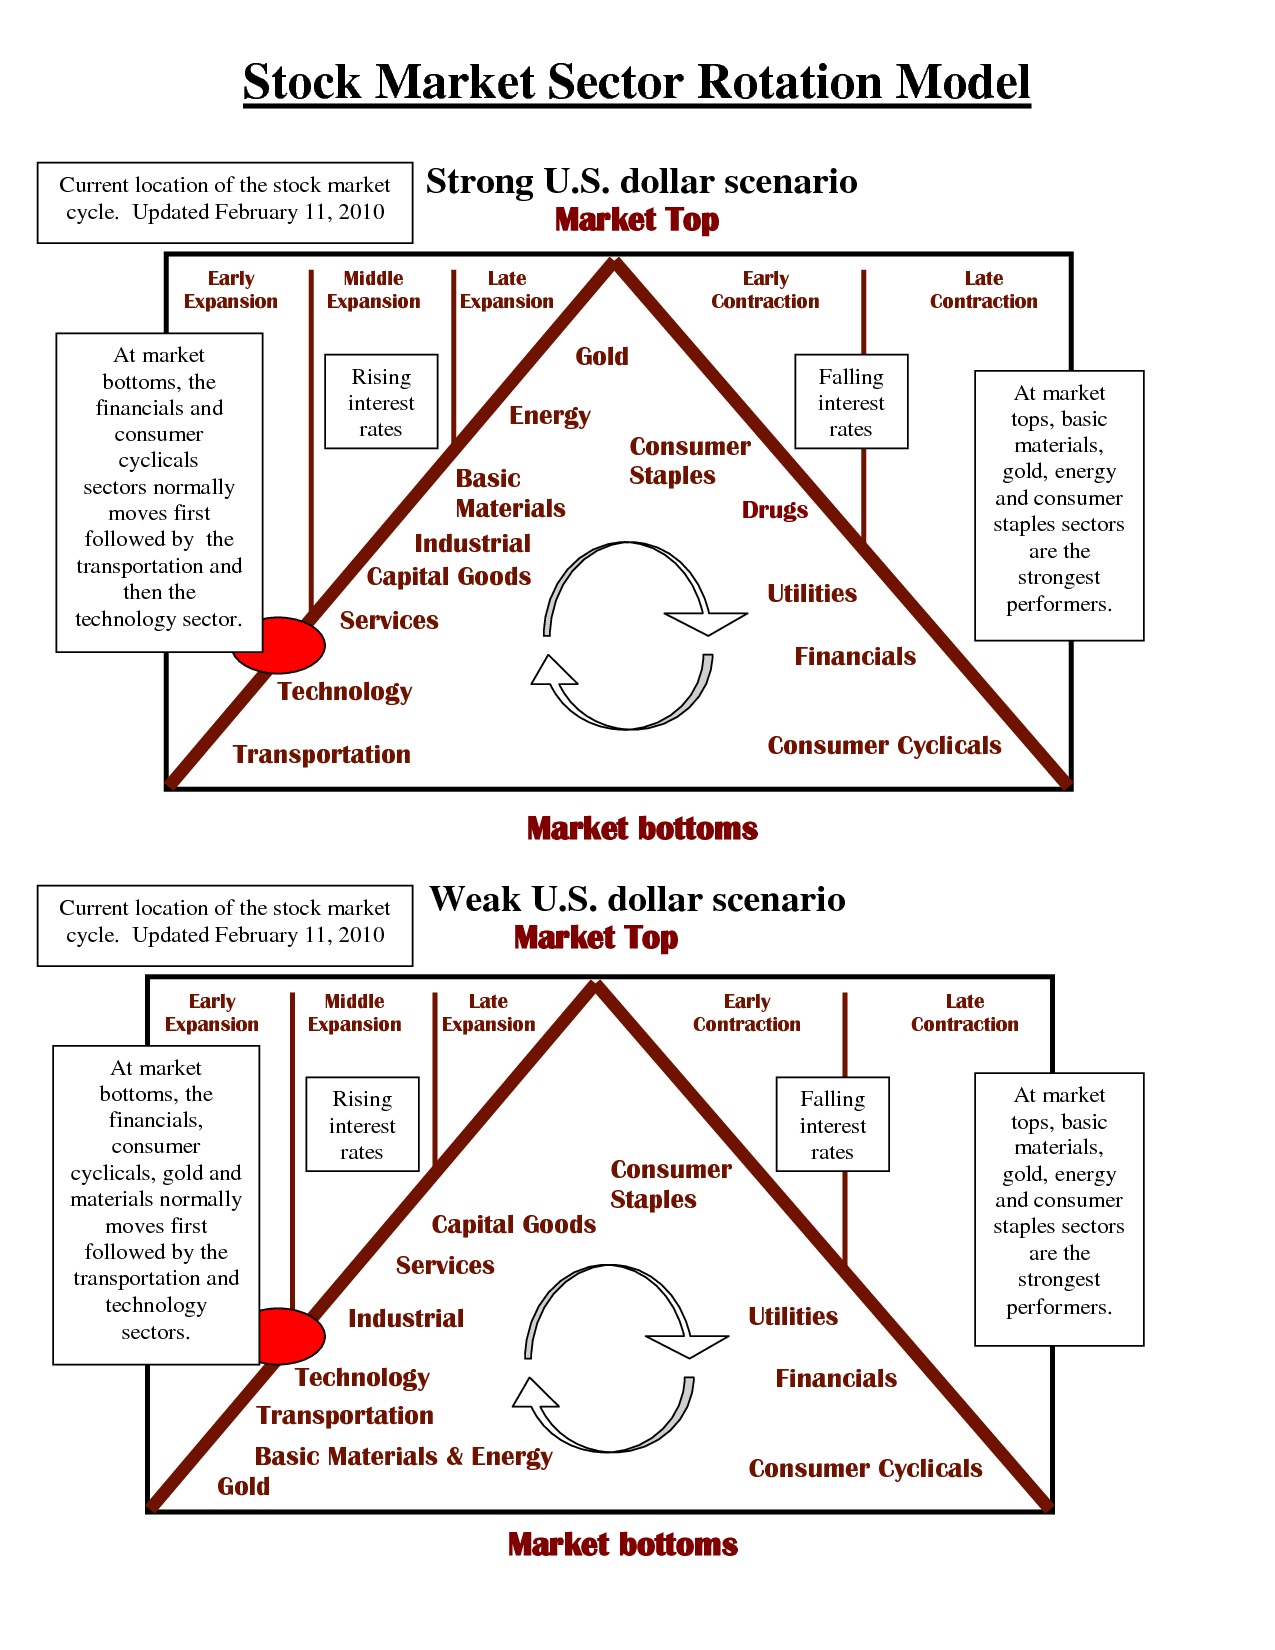
There’s the general business cycle timing and the sector rotation into specific areas that go with it.
Then there’s the broad view of the sector setting up with the fundamentals and technicals (in the right part of the cycle)
And then there are seasonals for the sector as well as the individual security.
Tech sector rotation
Tech Seasonal

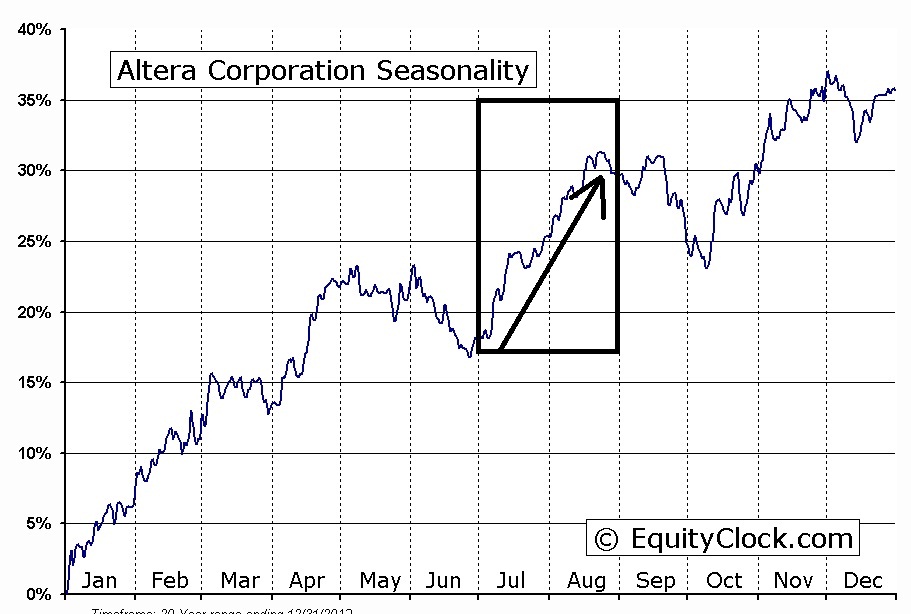
Not great, but offers a reasonable window for a nice swing into the July spike plus after the dip still swings up again into August offering a nice uptrend
ALTR seasonal
Tech sector fundamentals
ALTR fundamentals
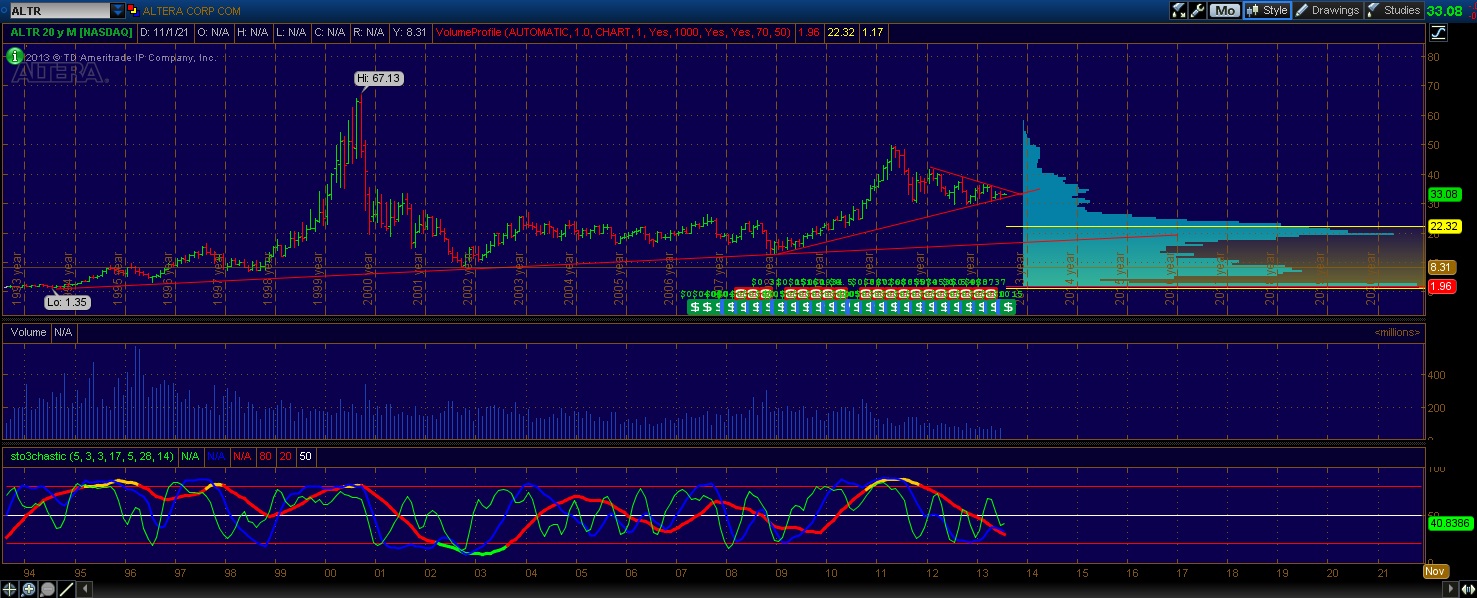
ALTR technicals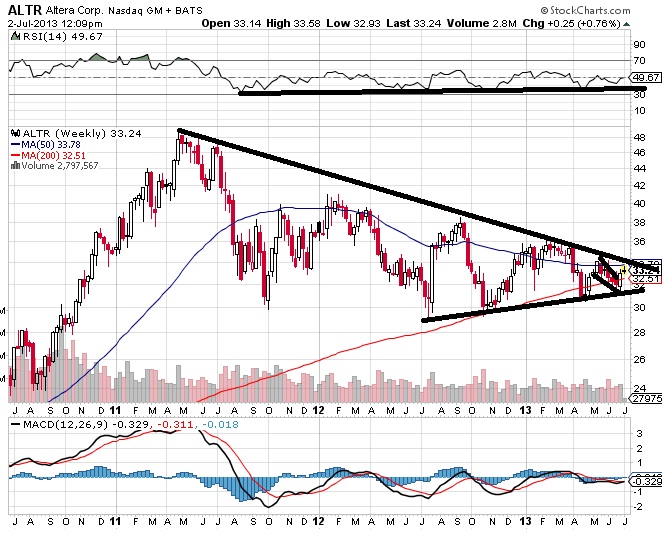
The consolidation was all on lower volume, the pattern has tightened up considerably, the RSI made higher lows.You could wait for a breakout, but I prefer to anticipate the breakout and the seasonal is just one of those things that can help boost your edge.
I am long ALTR.
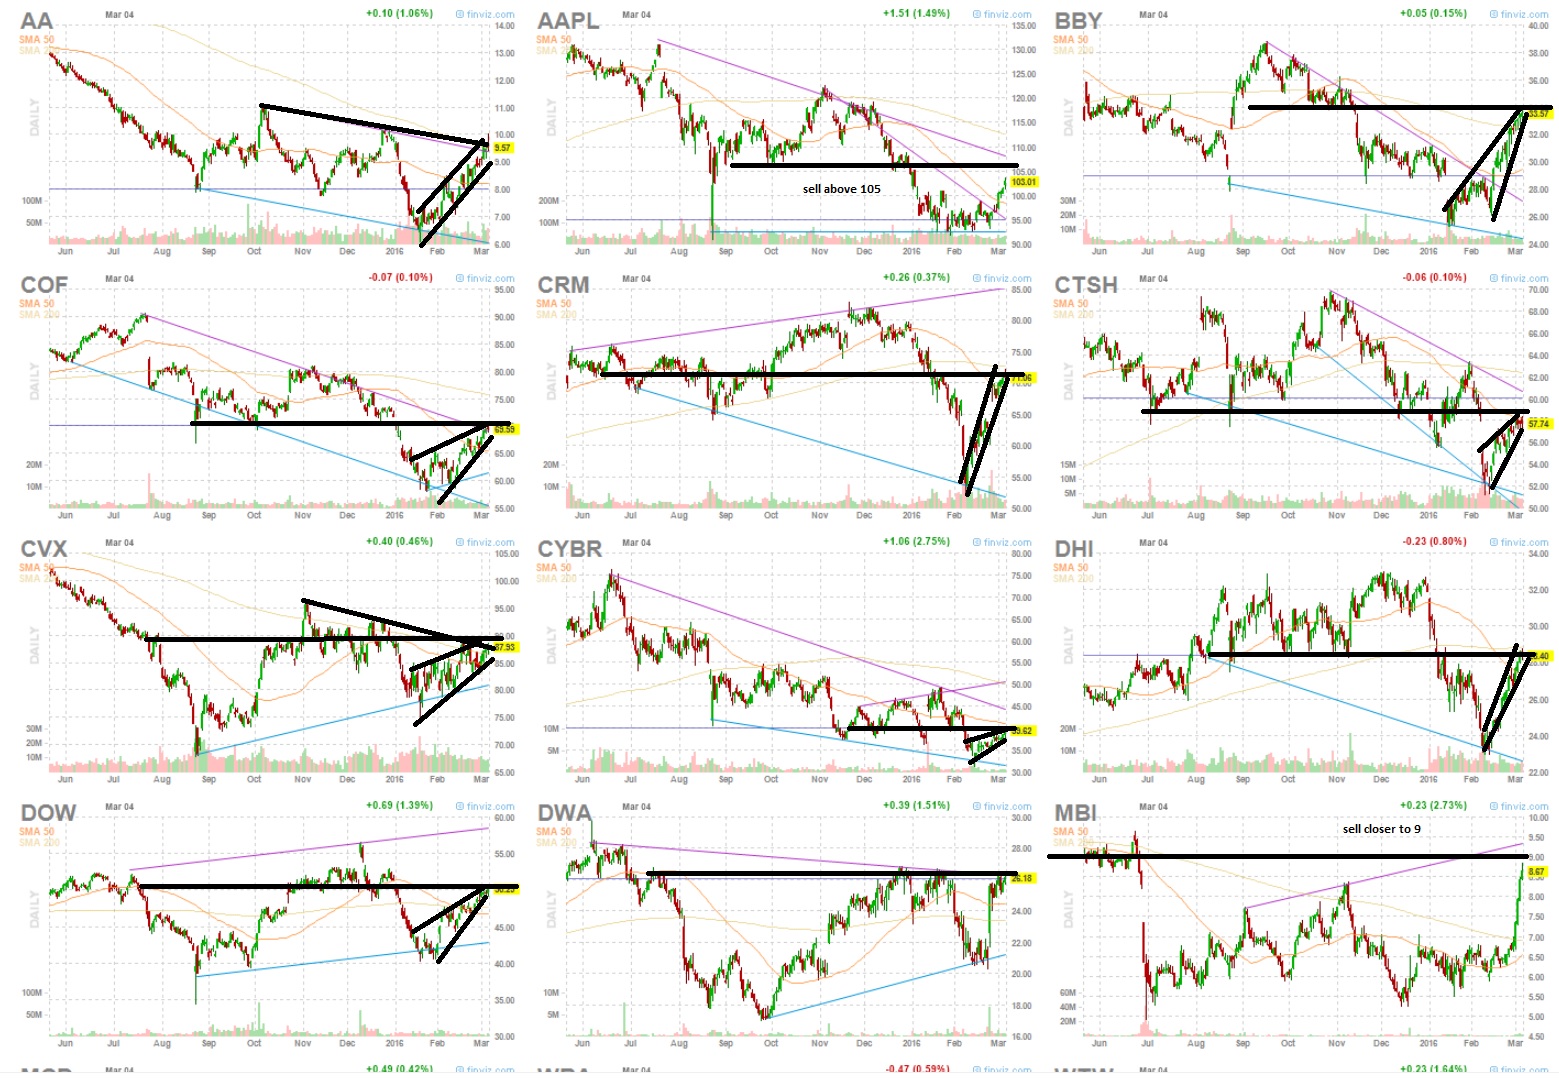
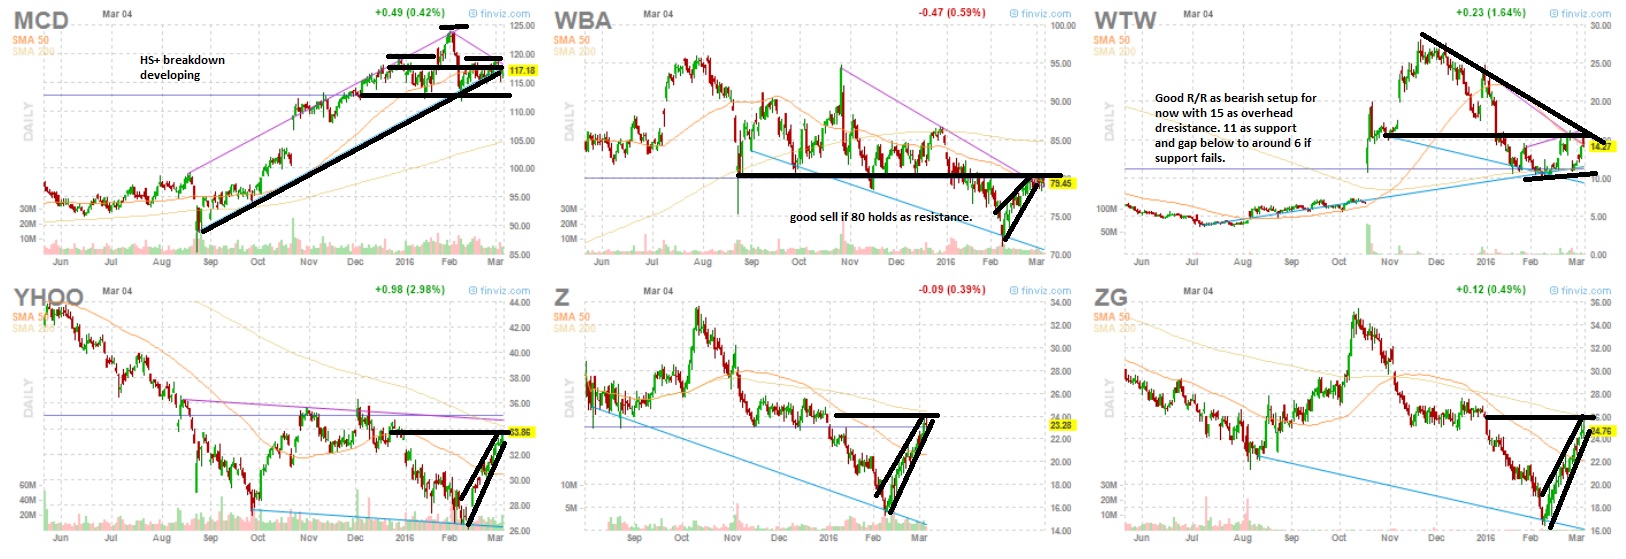
This is just as much an individual stock pick as well as it showcases how you might be able to increase your chances or maybe avoid a few names you would normally trade if there is “wind in your face”. You don’t want to “go against the grain” if you can help it. If perhaps it’s only moderately bullish or bearish in one of the areas like seasonals or technicals or fundamentals,etc but the rest of them line up fine then it should not be too much of a concern. But if the seasonal is telling you the market should decline sharply and the technicals can be interpreted more than one way, you may want to rethink it.
Seasonals are more used to help me keep on the lookout, and give me a better picture of if I want to ride the breakout for a larger trend, or just take my profits and plan the trade to just get a quick bounce.
You certainly can play them based upon the strongest month where the move is dramatic. Or you can look for a “low” or just a multi-month trend in your favor.
In this particular trade I may try to anticipate a breakout a few times and maybe trade the pullbacks a few times but as we approach mid-late August I may begin to look elsewhere.
Aapl was an example of a strong seasonal play. I was watching Aapl looking to catch a bottom.
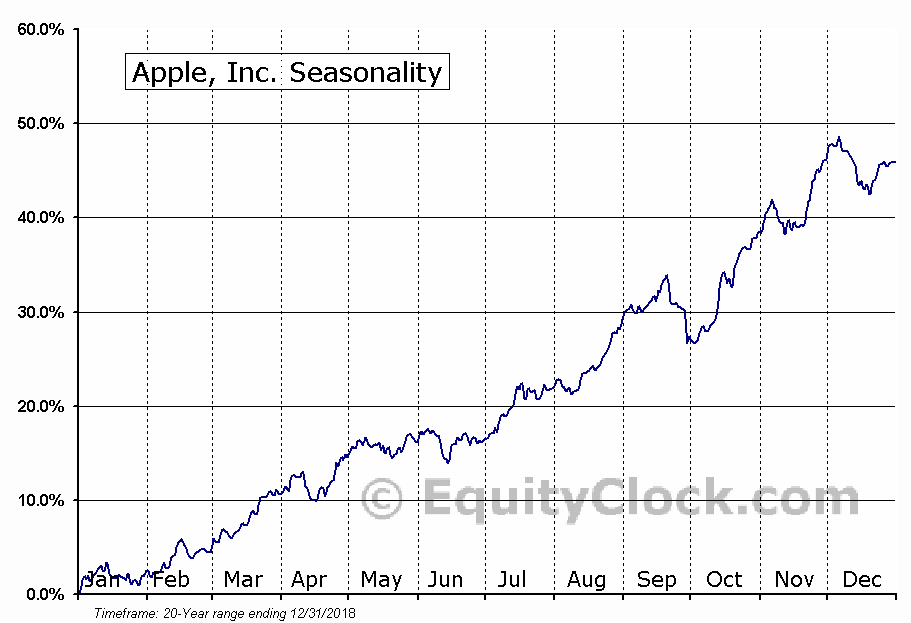
I really got “caught looking” on this one, but by now most of you are probably aware of the great upside potential in apple for a good trade to $500 mentioned by optionaddict.
If I was aware of this site charts.equityclock.com earlier, I may have seen that the bottom could have been near. I would see that it was offering a great upside trade according to the seasonals. I believed a price under $400 offered a reasonable entry, but felt the way the stock had been behaving that there wasn’t too much of a need to rush. I believe I may have had more of a sense of urgency as the seasonal suggested a dramatic move higher over the next 2 months. One could easily argue that the pattern is broken and it won’t see new highs and perhaps they’re right, but a seasonal rush in July-August and maybe September at least could potentially offer a great move to $500 before it goes lower or chops sideways.
You also may have had a chance to notice the pattern that was forming in WPRT and in determining if it will breakout or fail have seen the seasonal that mid June to mid-late July there is a monster run up seasonally.

That supports the likelihood of a breakout. You could have made a case that it should have happened in May-June. The weekly chart showed this stock coiled up tight for weeks similar to ALTR. However, it doesn’t automatically go up just because seasonals are strong. At times it may diverge, at other times, it will wait and then play catch up later. It merely provides supporting evidence to your perceived technical setup to allow you to be a bit more anticipatory and have a timeframe for the trade. Even though it didn’t go May-June, the trend lasts until Mid July, suggesting you may want to be willing to hang in for more time, or have sold early June and re entered on the June dip.
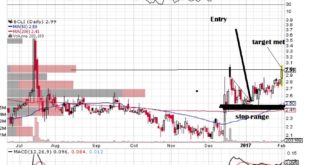
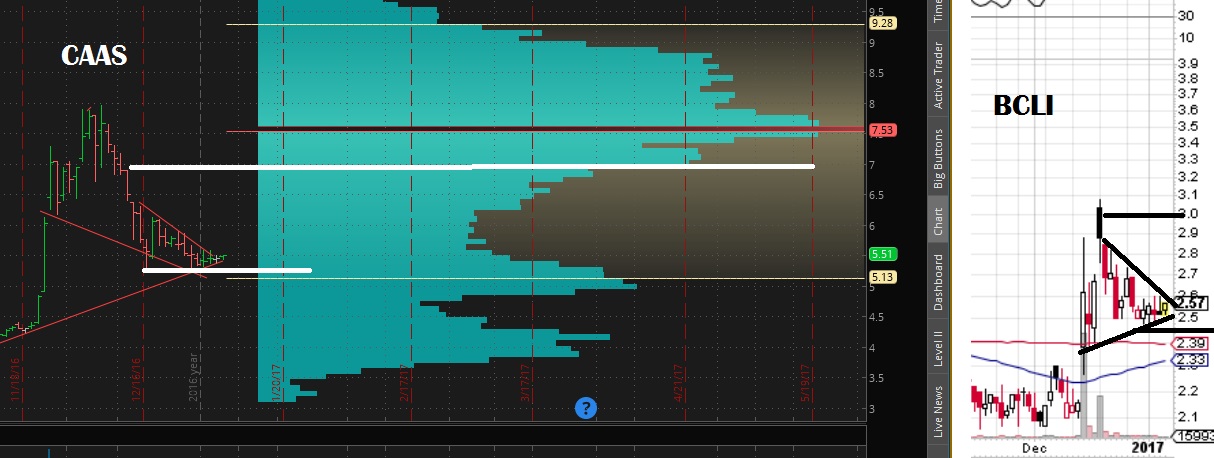
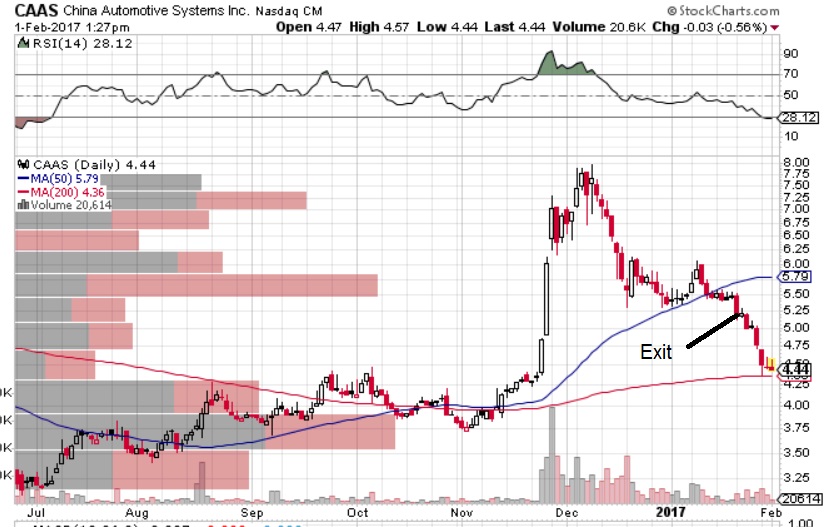
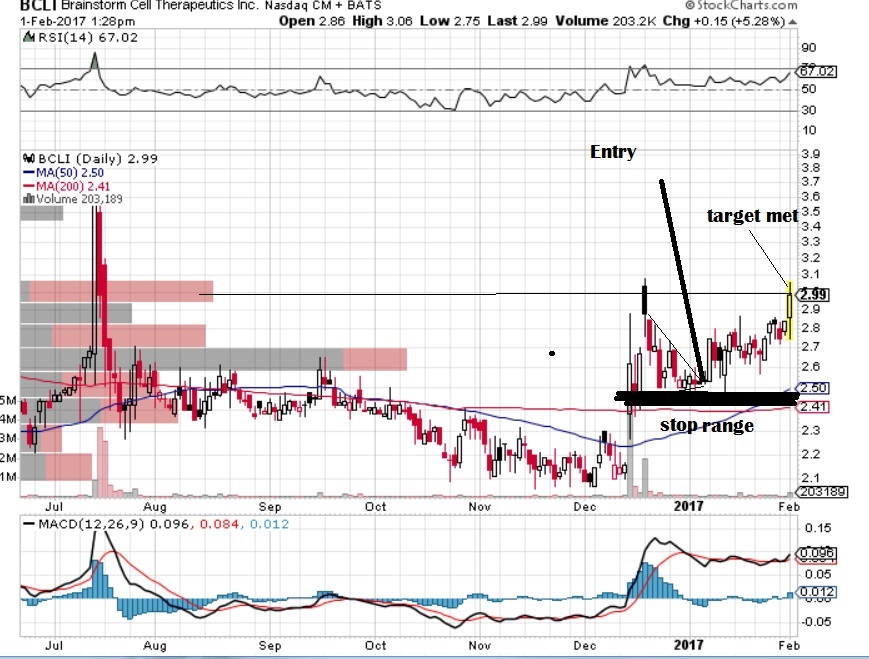
The volume pocket above, and/or technical setup, PLUS strong seasonals, PLUS a nearby spot to manage your risk is just one of those extra things that may be able to boost your win percentage and be enough to convince you to get long when you should often enough and keep you more patient when the seasonals go against you to get you slightly better timing. Just because a volume pocket exists doesn’t mean the stock enters it, it doesn’t mean it has a strong chance of entering it. Instead it means if it does, it offers tremendous upside potential to “fill” the volume pocket quickly.
I will have more on volume pockets in a bit going over various examples and show you what they looked at before and after they filled.
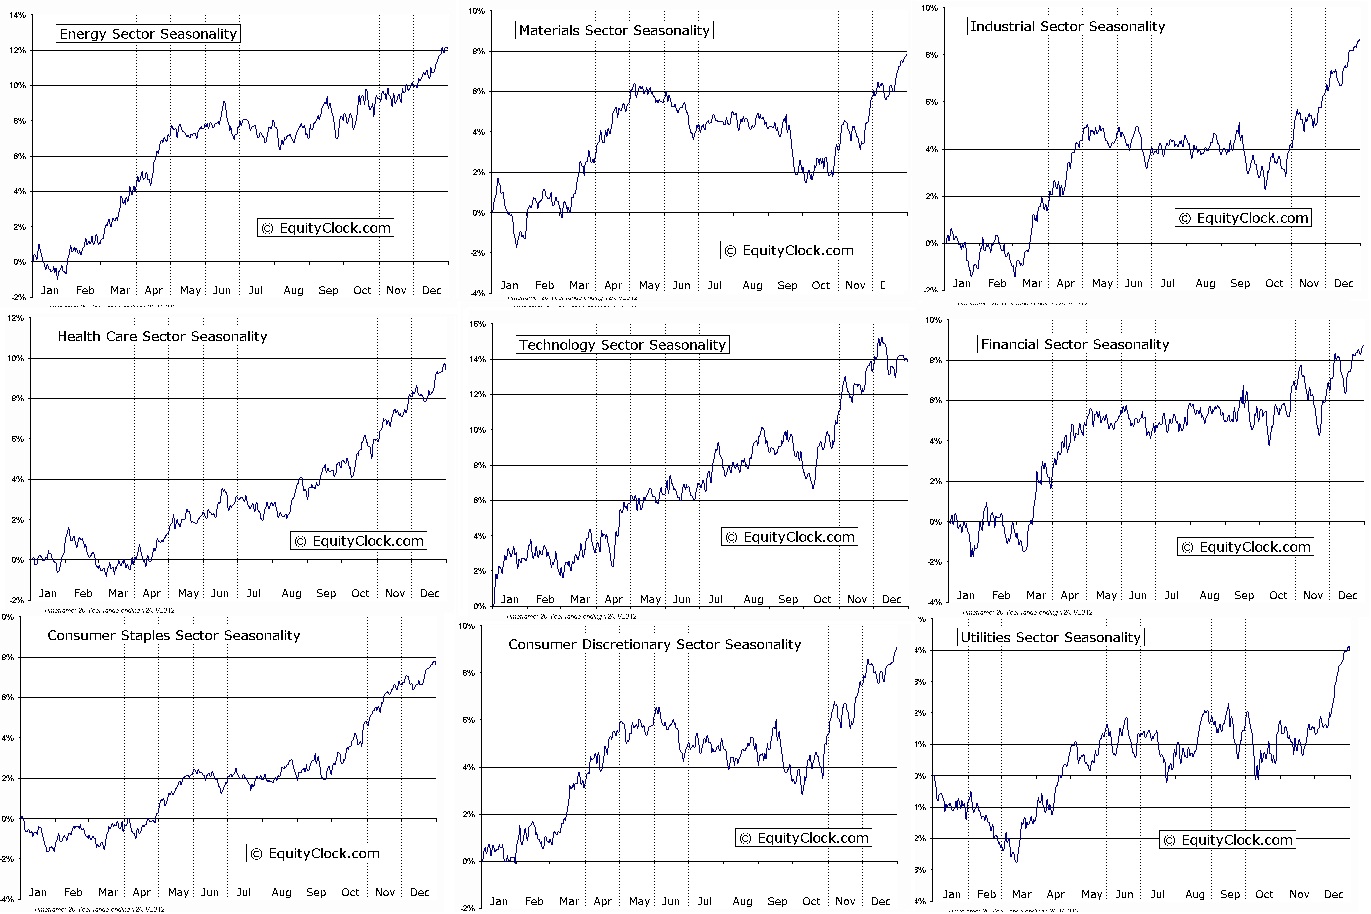
For now just consider adding seasonal charts to your arsenal. Here’s a quick view of sectors I compiled which is a great starting point for building a watchlist in the sector that sets up properly for a low or prior to a large move after a big sideways period of time.
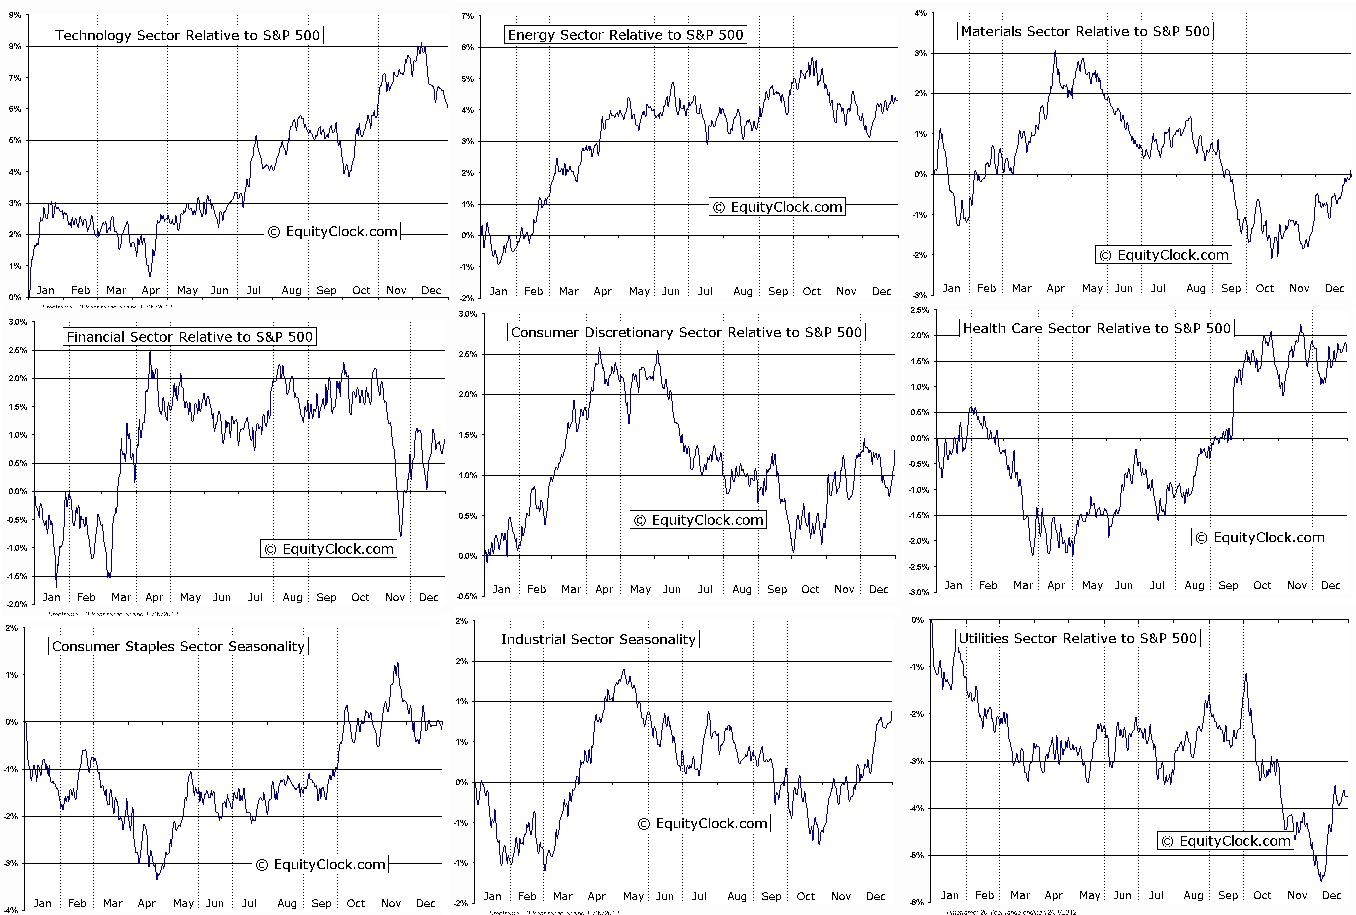
You also may prefer to look at the charts based upon their expected “outperformance” vs the S&P instead.
Comments »