
Perhaps the very most time effective things I’ve done with the OABOT is the Consolidation score.
The consolidation score looks to reward stocks that are consolidating with higher scores. It looks to avoid stocks that have already started the breakout, and identify stocks that have shown at least some evidence of consolidation. Not all of the stocks with a good consolidation score will have the look I want, but it certainly significantly helps narrow the field.
By applying a consolidation rank individually, it helps identify and rank the stocks in order of those who have the most coiled up setups.
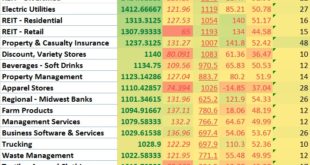
By slicing a stock into numerous classification and then looking at each of those classifications, you can then apply an “average classification” for each category. You can also look at the total count of stocks in that classification and the number of stocks with a consolidation score in the top 20%, and come up with a percentage out of 100 that each “theme” has. You can then use excel to sort industries (or sectors, market cap size, risk classification, etc) to see which “themes” are setting up.
When I created OABOT the first time I complicated things a little bit by evaluating stocks differently based upon where they were in relationship to their 52week high, moving averages, from lows, and performance in the days, weeks, month, quarter, year, % of shares that float, short float %, and other factors to label each stock into categories. I still think that’s valuable, but in the process, I think I got a little bit away from the ability to quickly find “themes” in that I combined “what’s working now” with relative volume of themes to multiply scores and combined everything together.
The reboot of OABOT will possibly look to simplify and just keep it contained to identifying
1)consolidation rank on short, medium and long term basis as well as overall consolidation score
2)Consolidation score by “groups” or “themes” (sectors, industry, market cap size, Location, etc)
3)The number of themes that have a certain NUMBER of scores over certain thresholds (For example, what percentage of stocks in each industry have a consolidation score over 80? Over 90?).
If every stock on average has a better score than the rest, OR if there are multiple stocks in the best 20% of setups or best 10% of setups, (even if the others are bad and skew the average to be low setup score for the theme) these metrics will help confirm that institutional capital is likely being prepared to enter a theme, even if they perhaps are being a bit more selective about how many within the theme they’re looking to enter.
This time around, I want to make sure I compartmentalize different aspects of what I’m looking at.
- I want to quickly identify the next theme rotation based upon consolidation score only. At some point I might also be able to separately look at theme performance and what’s working well now so I can manually glance at them and see if they have anything in common “beneath the surface” (are they all showing a particular technical chart pattern or candlestick pattern? Is there a fundamental reason or news related reason why certain stocks are outperforming? Is there some idea that might be next based on this knowledge?)
- Then I want to separately look at the top stocks in some of these top performing themes only; as well as separately looking at the top consolidation setups within themes that are working; as well as the top overall consolidation scores independent of industry.
- It will eventually be valuable to also look at the risk rotation of stocks, and the “What risk cycle is working” vs “what risk cycle is next” in each theme in a more anticipatory fashion. Although this is far more time consuming as it requires a layer of classification, analysis of the theme, and then reclassification providing a second layer of classification.
- And then look at the holistic score that factors in everything as an average.
The consolidation score has to look at a lot of different variables and apply them in different ways. Of the finviz stats could be used in a way that makes them relevant to consolidation:
1)Monthly Volatility
2)Weekly Volatility
3)ATR
4)Change (daily)
5)Beta
6)Weekly performance
7)Price
8)Monthly Performance
9)[Distance of price from moving averages]
10)Ratios and multiples of one score to the other.
I don’t believe I will be using the distance from moving averages, but It’s interesting to think about. A stock near the 20 day moving average relative to the ATR suggests movement in the last 20 days has been either quiet or nearly evenly distributed among the upper and lower range over the last 20 days. Or a stock above it’s 50 day but below it’s 20 day may suggest the trend has turned upwards, but the stock has recently begun moving downward slightly… If backed up by consolidation score, then it might be a wedge pattern or flag pattern… but it’s hard to tell just based upon this data if it’s a pullback or a orderly bullish consolidation or a sharp declined FOLLOWED by orderly consolidation (bear flag).
On it’s own it doesn’t necessarily suggest consolidation, but combined with consolidation it suggests recent order or that the stock may be near the apex of the consolidation. Perhaps instead sorting stocks over a certain score by distance away from 20 day moving average might be a better approach than factoring it into the score.
Additionally, it’s possible that a stock far above the 20 day moving average that is consolidating substantially in the last week might be bullish while the stock far below the 20 day may not. This is because the one far above that is consolidating may be a bull flag, while one far below is possibly a bear flag. So if you are going to use moving averages, you have to combine them with other data and possibly create separate classifications that combine certain elements.
I will probably do without the moving average data.
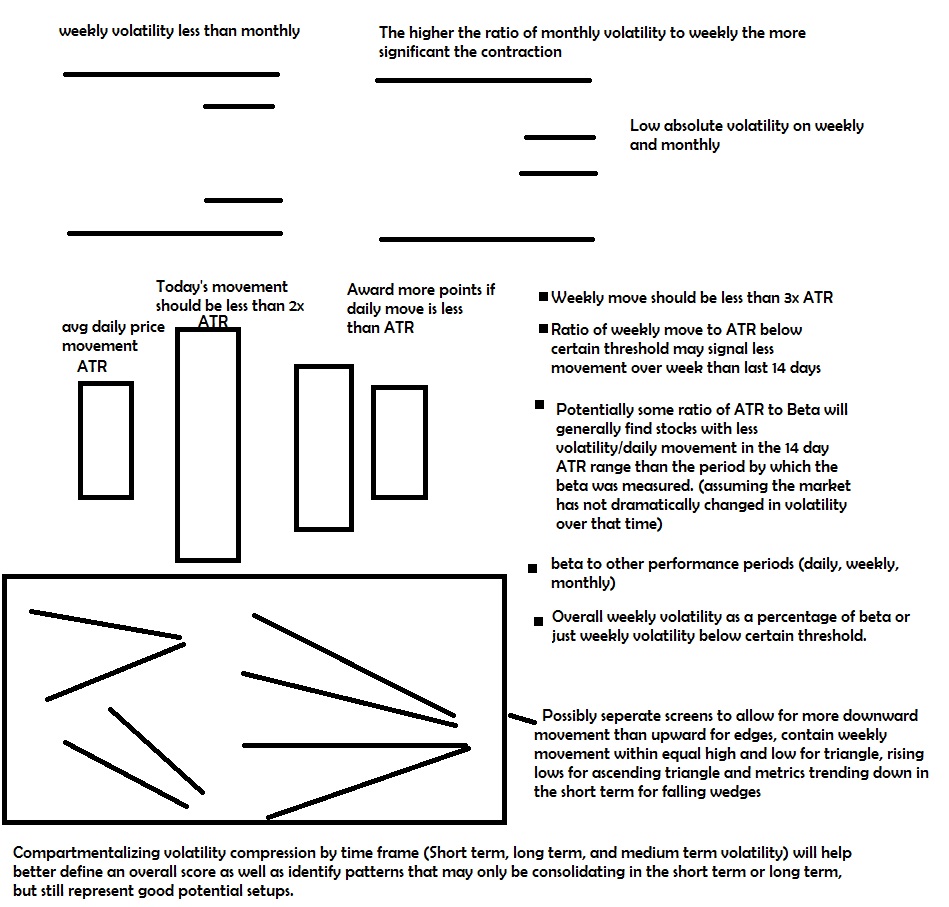
You want weekly volatility less than monthly volatility, price change less than 2x ATR but more than -2xATR, weekly change less than some multiple of ATR and more than the negative. When using ATR you either need to convert the change in % terms to $ terms or convert the ATR to a percentage terms. Daily and monthly volatility under a particular amount. Higher weekly and monthly volatility may be acceptable if the beta is higher, so you might adjust beta.
The ratio of weekly volatility to monthly volatility can influence how much you score the stock. The smaller the weekly and the larger the monthly, the more consolidation that’s taking place in the last week relative to the month.
The way you create a consolidation score is using IF formulas and possibly “AND”, as well as “OR” formulas in excel. For example One formula in excel would allow you to say
“IF weekly consolidation is less than monthly consolidation then add 20 points, if not take away 5 points.” This could be expressed in a format like this
=IF(AY2<AZ2,20,-5)+[other parts of formula that add or subtract a score]
where AY2 is the cell that lists the weekly consolidation, AZ2 is the cell that lists the monthly consolidation, and the brackets just represents a placeholder for other parts of the consolidation score formula.
You continue to apply certain rules that reward or punish, but not eliminate stocks. Once you are done, you can filter out stocks with a total score below a particular threshold.
Rewarding the monthly, weekly, and daily performance above negative absolute thresholds and below positive absolute thresholds as well as ATR or beta adjusted thresholds would be another way to punish stocks that are acting too fast and loose over a particular time frame. You could use quarterly and yearly if you wanted to as well, but that should be devalued or excluded to a long term consolidation score that doesn’t apply very much if at all to the overall score.
I welcome any challenge on my ideas or alternative ideas on how best to convert data into a system that rewards stocks that consolidate to try to filter out stocks that are definitely not consolidating, and rewarding stocks that probably are.
A lot of the ATR vs daily score, absolute daily scores above a particular negative and below a particular positive will apply towards the short term data. Possibly if weekly move is above a particular amount, if the daily movement is greater than weekly, apply a penalty. A lot of the weekly data and weekly vs monthly and ATR (14 day) can apply to the intermediate term. The long term can be mostly monthly data and later.
If you enjoy the content at iBankCoin, please follow us on Twitter

One comment
Pingback: Short Term Consolidation Score – Daily – Hattery's Monthly Trend Report