So when it comes to picking stocks, OA teaches that there’s certain points of the market where the appetite for risk is different. Right now I don’t have a great way with the OABOT 2.0 to capture that without making some changes. However, I am experimenting with a way I can modify the score of the screen I ran to make a quick list that approximates some higher risk names. So far it worked pretty well as I will demonstrate.
The original OABOT was designed to mostly focus on where a stock is in relationship to its highs or lows (and in some cases what the short interest and fundamentals were) except you could only classify it once, and because the stocks were ranked according to a limited amount of factors, the classifications were not all that good. However, what the classifications were good at doing was an adaptive scoring model that graded stocks near the highs with a different criteria once they were classified as “laggards” or “trash” so it did some good things.
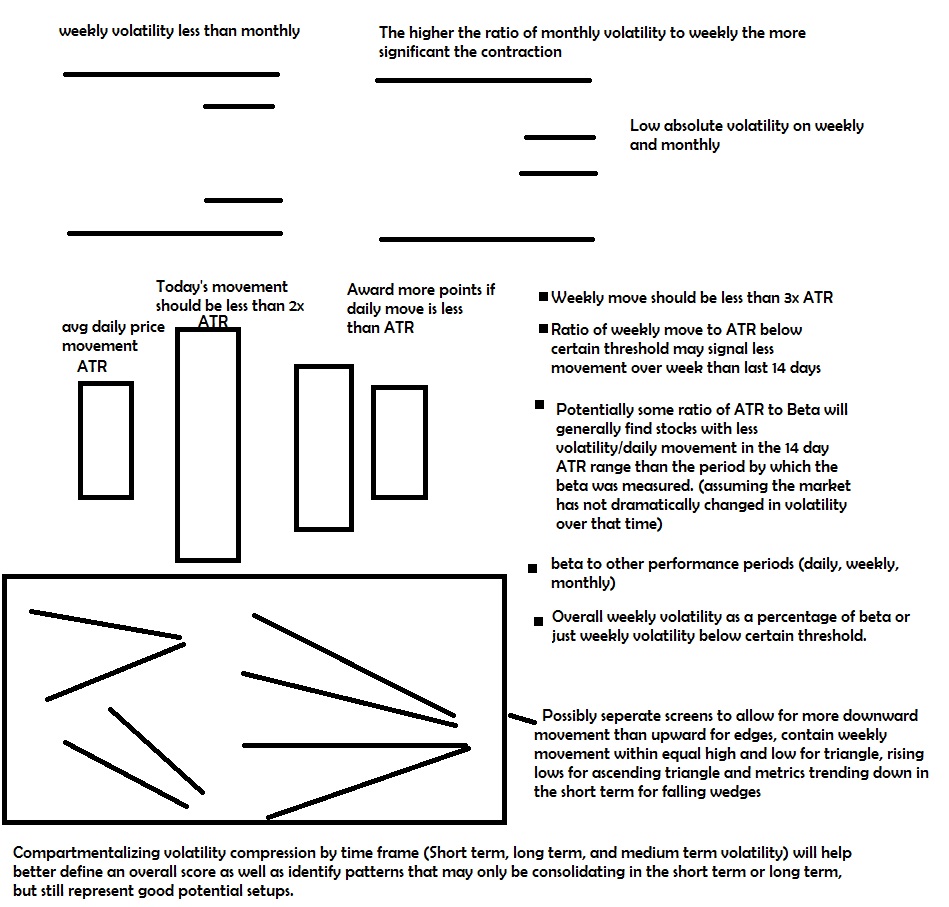
The current version of the OABOT needs to be changed to somehow capture a measurement of risk. I suppose I could try regularly altering some of the exact numbers. For example when I’m looking for low risk stocks, I’d score absolute low volatility higher than relative volatility. When I’m looking for higher I’d flip that on the head. Or I could add a reward for stocks that have high total volatility relative to the amount of volatility compression. However, for the time being I have another idea.
In order to capture the higher risk names, I decided to make a pivot table and then copy and paste the names that hadn’t been filtered out by liquidity filters and error filters (I’m not real strict about these filters, they’re just to eliminate the stuff that has no pattern or errors in data that prevent me from scoring them)
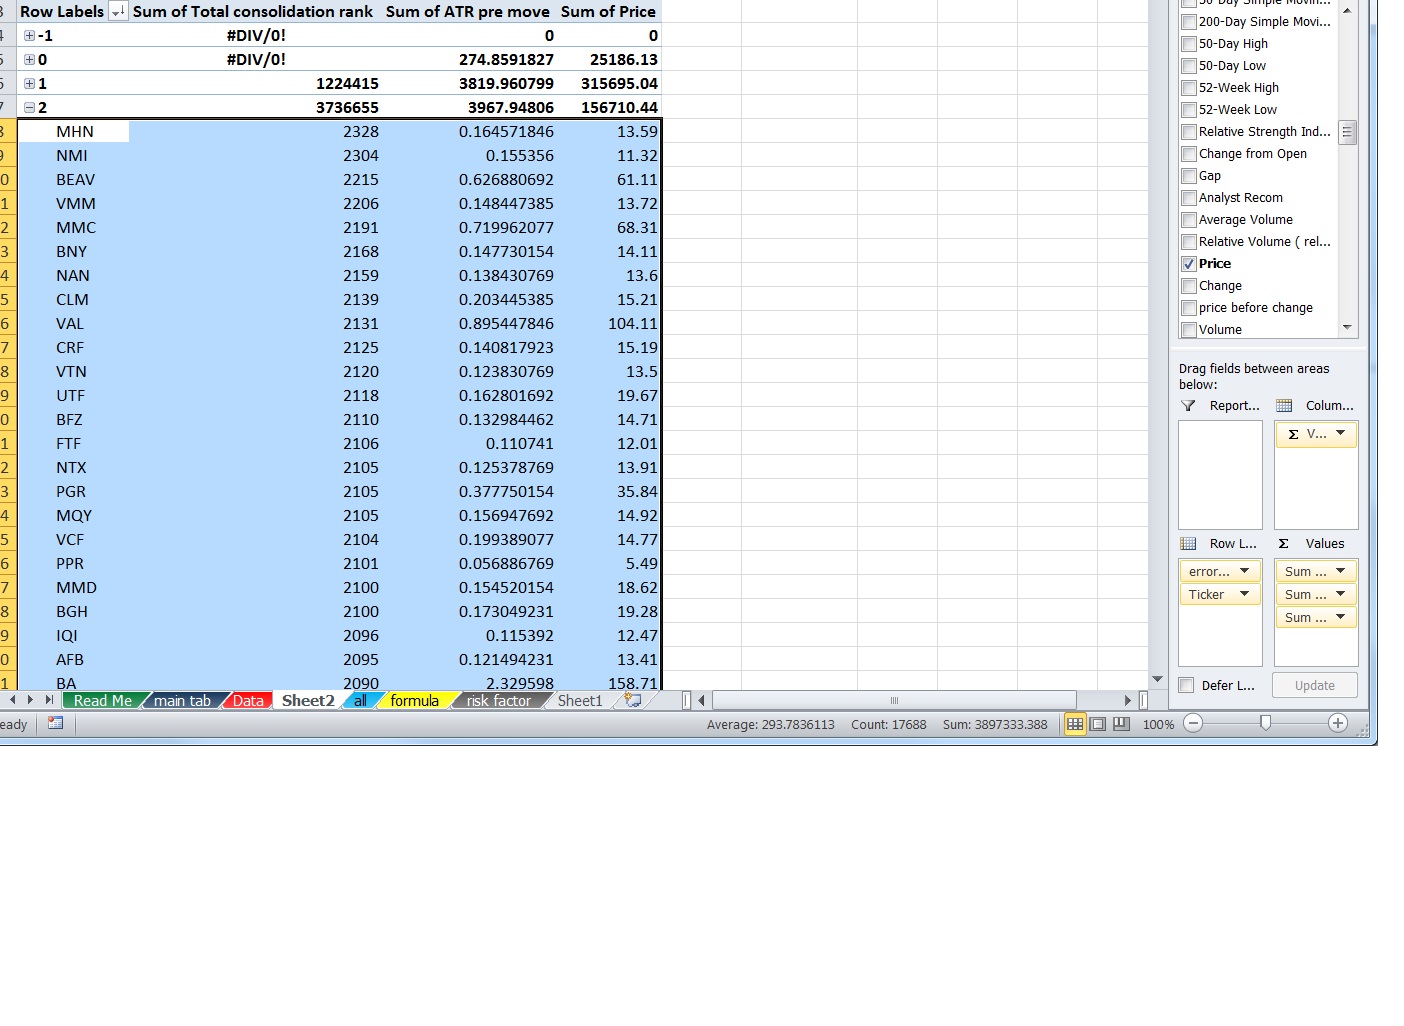
Then I eliminated the worst 1000 or so consolidation score stocks No real reason for this amount.

Then from the remaining 3000 or so I chose to incorporate a stock’s ATR divided by price or average % movement in the last 14 days. Since these are usually numbers like 0.014 or 0.022, I multiplied the result by 70,000 which mostly gives you a number about equal or less than the consolidation score except for a few and combined it with the total consolidation score to give me a total score that favors the stocks who’s relative consolidation still represents a lot of movement.
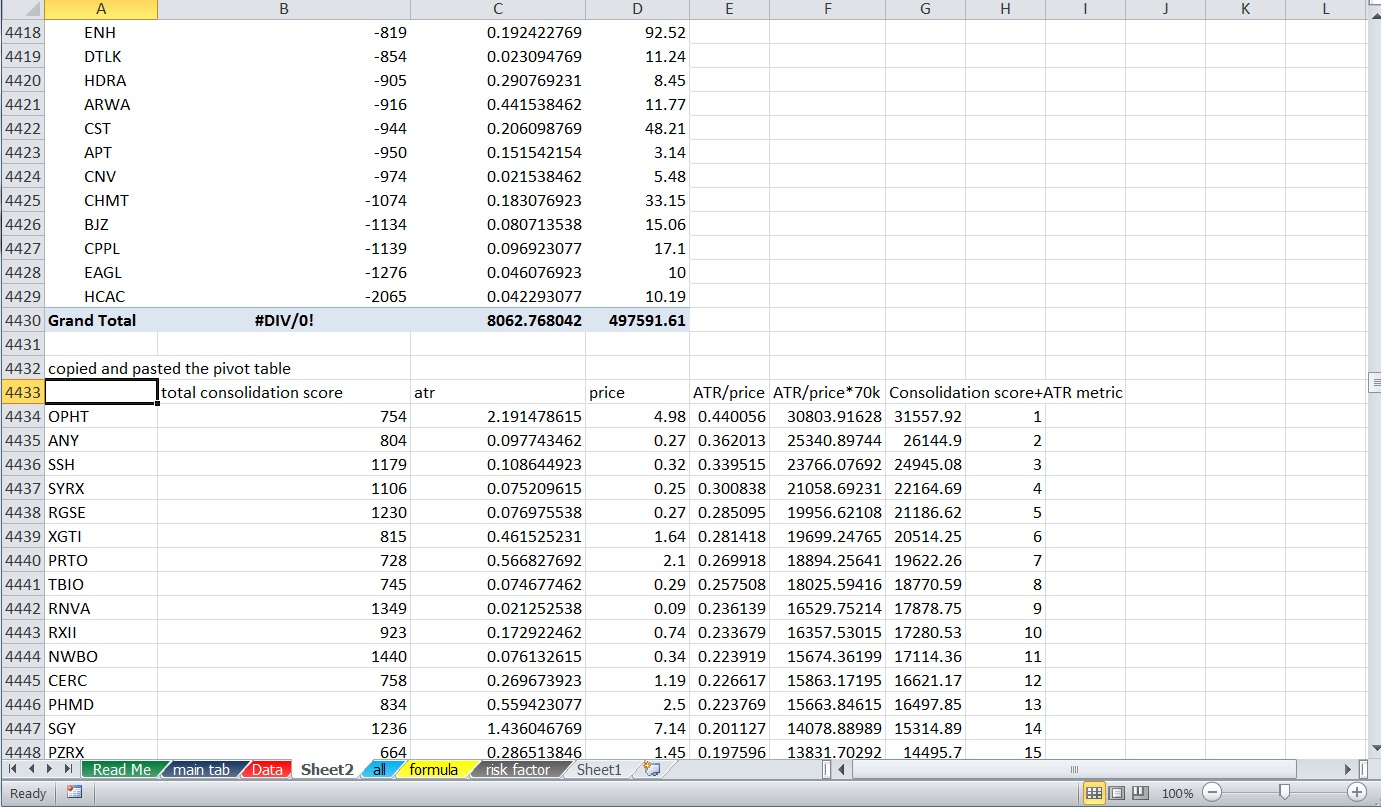
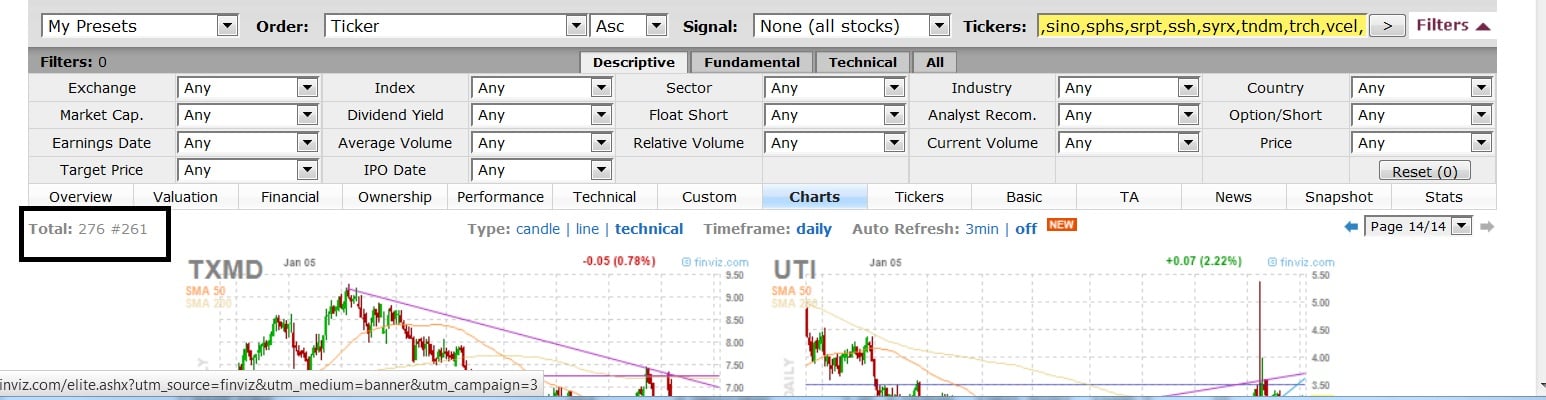
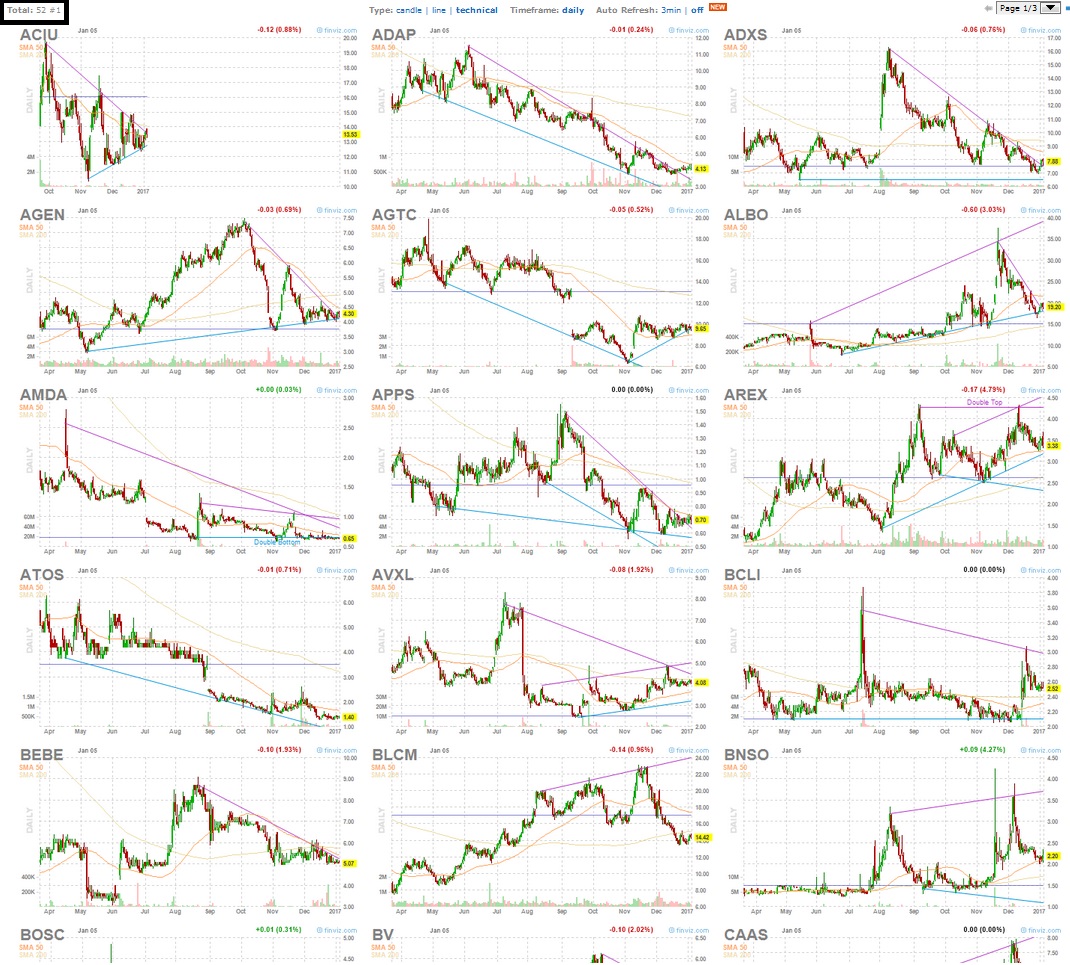
Then I imported a few hundred names it ended up being 276 names (just done randomly). From this list I manually skimmed through looking for setups because there are still going to be false positives. I came up with 52 names that looked interesting enough to think about over the next week and posted them for viewing in After Hours chat. 18.8% of the names from the top 276 I liked enough for a closer look. I could have done more but I’m not really into bull flag patterns just yet and have not tried to filter out rising wedge patterns. For now I don’t mind the false positives because I’m looking to just make this a research tool.Should I choose to make this more about being more of a trading system or process I’ll want to be much more strict and just want a list of a few dozen only and then simply monitor them for some kind of buy signal on the intraday chart or else some sort of buy point.
Sample of list (full list in AH /w OA chat)
I’m thinking moving forward I may be able to use various indications of how much a stock has moved between beta and ATR and maybe some other indicators to indicate “risk” It isn’t perfect yet, but I basically just arbitrarily picked the standard. I can easily put some formula to create limits and criteria to cap a score or remove it from consideration of “higher beta” names and then seek to optimize those numbers (and this was follow up. I’d probably also create some sort of metric based upon days since it had its IPO which might also be a good method to identify names that represent a higher risk appetite.
Certainly this screen does pretty good at capturing the “4’s and 5’s” of the market that have not yet moved. It didn’t take a ton of additional effort. For now I’m not sure whether a lot of change is needed, but I certainly could send the time as I’m curious as to how the names with certain classifications are doing curently and have in terms of their consolidation score would change as a group.
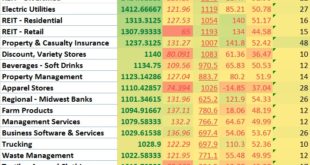
For now I just have categorized stocks by market cap, indices/exchange averages, sector, industry,etc and am only looking at the consolidation rank on various timeframes and using the old version when I want to run breadth or look at where the capital is moving.
There’s a current small bias due to the way I created the score that favors the lower beta setup and this “hack” eliminates it completely by rewarding the stocks that have moved a lot per day on average in the 14 days but still have a generally high consolidation score.
If you enjoy the content at iBankCoin, please follow us on Twitter