If the heart of the OABOT is the consolidation score, than the short term consolidation score are the aorta and other major arteries, and the intermediate term is the blood, with the long term being the veins.
Although there’s not too many possible data points that go into a daily score, there’s a surprising number of pieces of the formula that can be applied by combining these variables. The short term consolidation rank helps punish stocks that are breaking down or breaking out, while rewarding stocks that are moving less today than recent average movement over various periods of time. When combined with high intermediate scores, this generally allows you to identify stocks that are closer to the apex. The stocks that show an “inside day” tend to rise to the top a little more often with all other things being equal. It also avoids looking at stocks that may be consolidating, but either are breaking out or aren’t “quiet” today, potentially suggesting they may need more sideways work, or that it may be too late to chase.
Before I get into the nuts and bolts of how I am preparing the daily score, I want to show you how this spreadsheet will be “cleaner” than the last one, and thus, much easier to tweak.
I have a “data” tab (where the data can be updated and replaced with new data completely), an “all tab” where all the data is repeated so that formulas can be applied, scores can be added (and re-added if/when I put the summary tab back on), and the “formula tab” where specific numbers and details within the formula can be tweaked.
Rather than looking at some nonsense like:
=IF(OR((all!BO2*BN2)>(formula!C43*all!AX2),(all!BO2*BN2)<(-formula!C43*all!AX2)),formula!C44,formula!C45)+IF(OR((all!BO2*BN2)>(formula!C46*all!AX2),(all!BO2*BN2)<(-formula!C46*all!AX2)),formula!C47,formula!C48)+IF(OR((all!BO2*BN2)>(formula!C49*all!AX2),(all!BO2*BN2)<(-formula!C49*all!AX2)),formula!C50,formula!C51)
and then having to interpret the nonsense and substitute certain variables and change the formula itself, I have instead set it up so the “all” tab pulls from both the data and the formula tab where necessary. Even though the formula still looks like crazy nonsense, I don’t have to look at it and deconstruct it.
If I want to make tweaks, I look at this clean version where I can read what’s happening, and I can make adjustments without adjusting the formula entirely. If I want to make structural changes to how the rule is applied or apply a different rule, I can more easily read what’s actually taking place and what cell on the all tab contains this formula.
Now we can resume talking about the short term consolidation rank tab….
For the time being, I broke the short term consolidation range into 3 subsections. Ultimately I am combining them all, but if later I decide I want a weighted average so that one of them count more towards the final score I can do that.
The categories are:
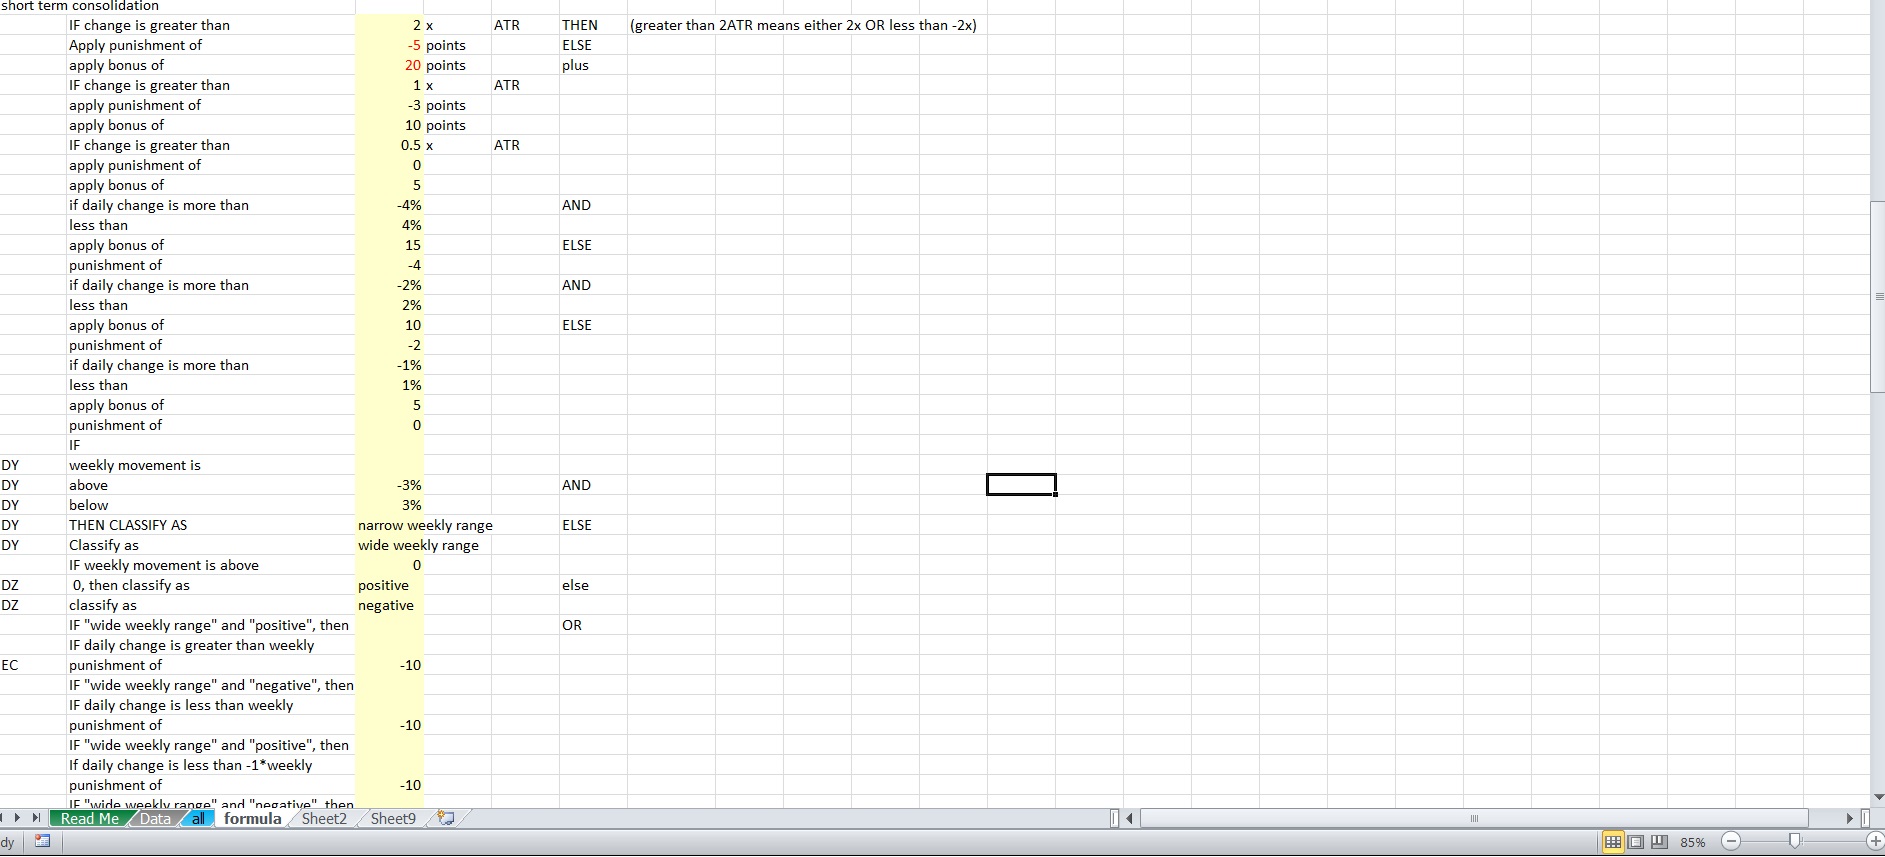
1)Changes as a multiple of the ATR (A stock that moves less than 0.5 times the ATR will score more than a stock that moves more than 2x the ATR)
2)Absolute Changes (A stock that moves somewhere between -1% and 1% will score more than a stock that moves between -4.5% and 4.5%)
3)Changes relative to the weekly performance.
The 3rd variable is the trickiest, but important. To avoid confusion, I chose to classify the weekly performance as “narrow weekly range” for a smaller weekly move in either direction or “wide weekly range” for a larger weekly move in either direction. I also classify it as “positive” for a stock that is up on the week, and “negative” so I don’t get in trouble with the less than and greater than sign when negatives get involved.
This helps me avoid confusion in making the formula since you may have a weekly positive but a daily negative or vise versa and writing the formula without separating these gets tricky.
Let’s say you want the daily range to be within the weekly move. Let’s say a stock moved a positive 1% on the week. If a stock moves less than 1% but more than -1% it represents consolidation. However if instead the number is negative the same formula would say less than -1% but more than 1% and represent the opposite of what you are trying to express. So by setting up separate formulas for positive and negative numbers it makes things a bit easier.
If a stock is not moving strongly on the week, and is showing signs of the stock moving less today than that weekly action, it’s probably looking like a better target. This is more true if the daily action is less than half of the weekly move, and more true if the daily action is less than 0.25 of the daily move.
While it’s possible a stock started the week moving up 10% and then went down 8% to finish only up 1.2% suggesting less volatility than there actually is, if the stock on the day is only moving 0.30%, you are still looking at a stock that is less volatile on the day than over the course of that week. Not all stocks that show less movement on the day than the week will be consolidating, but most stocks consolidating will see less movement on the day than the week.
When backed by weekly (last 7 days) being less than a multiple of the ATR, it begins to paint a picture of stocks that are in narrowing ranges, even if that contraction may not be orderly.
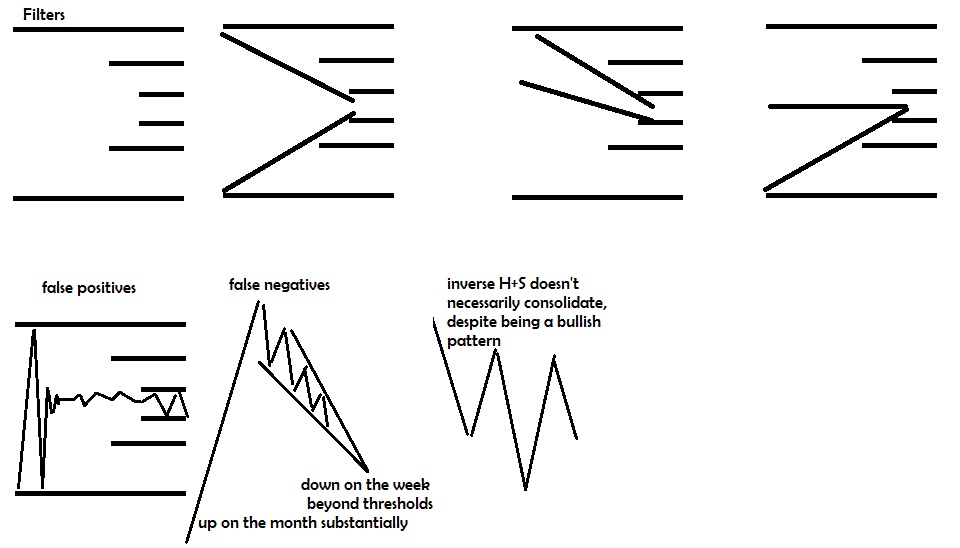
The above graphic shows that inverse head and shoulder patterns as well as the really steep moves with significant declines on the week in falling wedges may not always pass with a high consolidation score. Also there may be some stocks that pass within the thresholds set but don’t actually show a pattern.
We can try to get the falling wedges after significant increases in price to have a boost by relative comparisons of monthly volatility relative to weekly volatility and movement relative to others.
Capturing the inverse head and shoulders look from a low can actually be done by classifying stocks properly ahead of time so that it’s near the low but has started to see recent strength, but there will be a lot of false positives and a few false negatives. For example, if you have a stock that is close to the low, has seen some movement from the low, is above 20 day moving average with recent weekly move not surpassing a certain amount and hasn’t declined too much and a very mild boost for weekly volatility being less than monthly, and daily volatility data doesn’t matter, you may capture a few that have that look… However, I won’t be using OABOT to try to create a special formula to try to find these patterns at this time.
We are looking for stocks that have not passed certain thresholds on different timelines and getting a bit more strict about the movement as the time range decreases, and using different criteria and different measurements for volatility and movement.
We are looking for contracting volatility. That doesn’t necessarily imply there will always be a pattern of contracting volatility just because volatility on the month is less than the week and the day is less, and the ranges are contained, and the ATR is small, and the beta adjusted movement on all time frames is low. But it’s an excellent start.
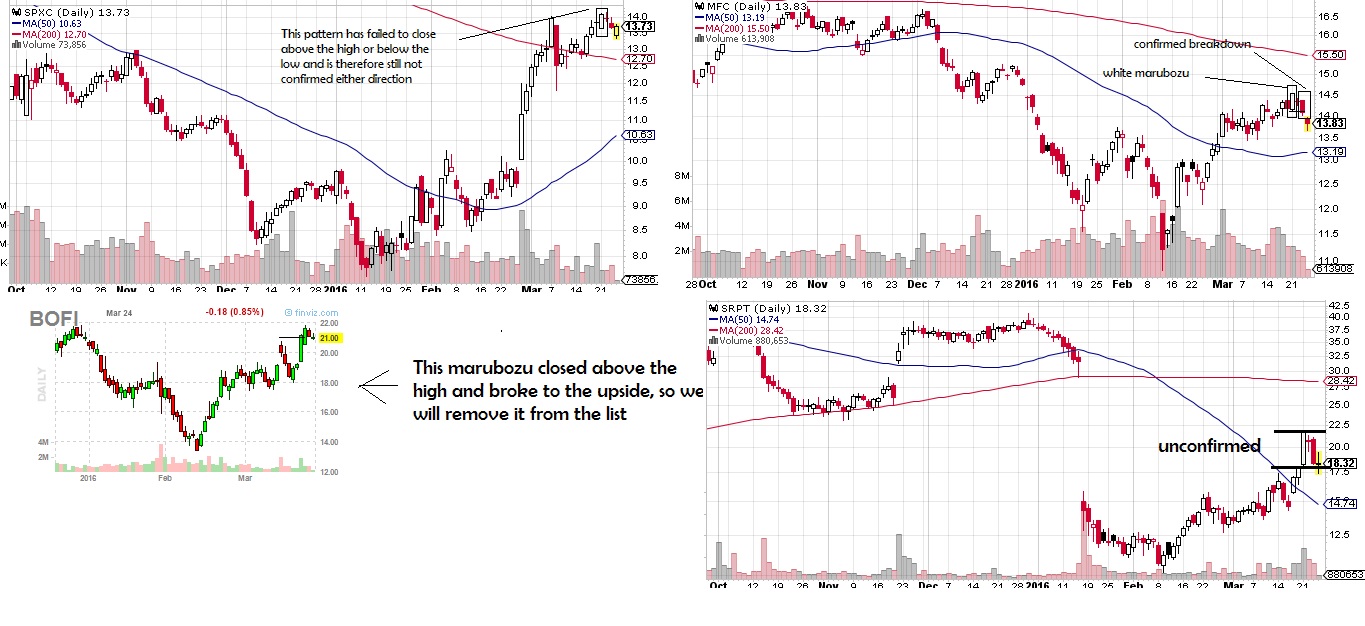
This is also why we must look at the same question in different ways. It’s not enough that a stock passes a filter of not breaking out to the upside, but also that the daily movement relative to absolute terms, recent average volatility on the day, and relative to the week suggests consolidation. As the data suggests more consolidation we continue to improve the value of stocks with a high consolidation score.
A stock may have started it’s consolidation awhile after the cutoff. For example a high tight flag will see the stock advance for 3 months straight before it consolidates so both the quarterly and monthly performances may not be suggesting consolidation. If the consolidation has only just started midway through the week, the weekly may not even capture it.
Nevertheless, in terms of finding stocks in consolidation patterns with good setups near the apex, I was able to get about a 40% hit rate on stocks with very high consolidation scores the first time around, and that’s when I wasn’t as nuanced with the short term, intermediate term and long term consolidation scores. However, the VIX at that time I believe was under 12 so setups were abundant.
That was when I also started to included separate criteria to evaluate stocks near the high differently than near the low, but I actually think I can eventually get it to where I have a higher hit rate than that.
This means in the right conditions can look through the top 100 stocks and find around 40 that are at least starting to set up or show some kind of consolidation. Not all of these 40 are going to be worth trading, and certainly many of them won’t trigger a trade, but they at least capture the “look” I was going for.
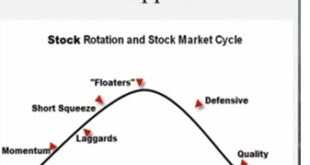
I don’t really need it to be that high, even in low volatility environments. However, starting out that high gives me the flexibility to be strict about other data that will represent other things I like about the stock such as being in an industry with a good score as well, or being in an industry that has performed well in the long run that is starting to show weakness AND a high setup score, or focusing on the higher beta stocks or better swings in the past, or looking at a separate filter to evaluate a stock’s “risk” and compare it to the phase of the risk cycle.
Reducing the workload from 7000 stocks to 400 or less nearly automatically is the intention, while also tracking a few things that may be useful in providing a “market overview”.
If you enjoy the content at iBankCoin, please follow us on Twitter

One comment
Pingback: Intermediate Term Consolidation – Hattery's Monthly Trend Report