One of the common trends that we all have heard is “sell and may and go away” but should one really sell in May?
It is an election year, so perhaps we are better looking at the normalized performance during election years.

In an election year, buy in may looks like a better strategy…

In the decade cycle, it looks like the low will occur after May, but that 2012, maybe sometime in the summer, is a great time to buy.
The last 40 years:

Sell in May is not a bad strategy, the amount gained from May to October or November is almost nothing, and perhaps it’s not worth the volatility. However, Selling in early June or late August can produce a bit stronger results.
Unless we are looking at the Nasdaq:

It looks as if Nasdaq will be good until July.
There may be something too this Sell in May strategy as buying in October and selling in May certainly produces results, Additionally many won’t manage the volatility through the summer as well, so avoiding that may provide superior results from a return on risk perspective. However, I don’t know that the sell in May is strong enough to overlook a “sell in August” strategy. But stocks aren’t the only thing we are looking at here.
However, certain areas certainly show selling has been best in may, such as Copper, although March or April would also have been good selling months.

Or Coffee:

Or Corn:

Or Live Cattle:

Soybeans in June:

Perhaps another reason to sell in May is that bond interest rates are higher at the end of May

Now the mutual fund cash levels are lower
July 2011 3.3% cash
August 2011: 3.4% cash
Sept 2011 3.8%R
Oct 2011 3.5%
Nov 2011 3.5%
December 2011 3.5%
January 2012 3.6%
Feb 2012 3.6
March 2012 3.3% (compared to 3.4% in March 2011)
Mutual fund cash levels have not been this low since July 2011, before stocks dropped 15-20% in a short time period. At this point, other than increased liquidity from the Fed, which isn’t happening yet, the only thing that can push the market higher is corporate cash being put to work, and the retail investor sending more money in. However, there’s a problem with this…. The “turn of month effect” is ending right now (5/3 after close), turning things negative.

Turn of month effect is the effect of stocks outperforming during the last 4 trading days of the previous month and first 3 of this month.
Here’s a look at the average daily gains.
| Day | Daily Gain | Stand Dev |
| Fourth to Last | 0.068% | 1.064% |
| Third to Last | 0.021% | 1.055% |
| Second to Last | 0.071% | 1.037% |
| Last | 0.088% | 0.997% |
| First | 0.118% | 1.117% |
| Second | 0.168% | 1.065% |
| Third | 0.155% | 1.077% |
For non stat buffs, standard deviation measures the range. As a general rule of thumb results have a 68.5% of performing within 1 standard deviation of the sample mean and a 90% chance of performing within 2 standard deviations, and a 95% chance of performing within 3. Each of those can be broken in half, so that a 34.25% of the results occur on the lower end and 34.25% on the higher end of the 1 standard deviation range. What’s more, that assumes “normal distribution”. In other words…
| Day | Low Range | High Range |
| Fourth to Last | -0.996% | 1.132% |
| Third to Last | -1.034% | 1.076% |
| Second to Last | -0.966% | 1.108% |
| Last | -0.909% | 1.085% |
| First | -0.999% | 1.235% |
| Second | -0.897% | 1.233% |
| Third | -0.922% | 1.232% |
Basically, a fancy way of saying, we really don’t have enough evidence to conclude with any sort of confidence that the turn of month effect really exists and is not just an anomaly that has occurred. If you look at enough data, you’re bound to find a mild correlation. You could flip a coin several thousand times while looking at your watch, and if whenever the second hand is on 30 heads occurs 60% of the time, you could easily think that the time has something to do with it, but it could be nothing. But there is a greater probability than not, that there at least is a positive return over this range, and a return that is greater than over the remaining time period. So although we can’t make any conclusions, the odds are slightly better that you may have an edge over this time period. The edge isn’t even that great if it’s true, but it’s still slightly more probable than not that one exists.
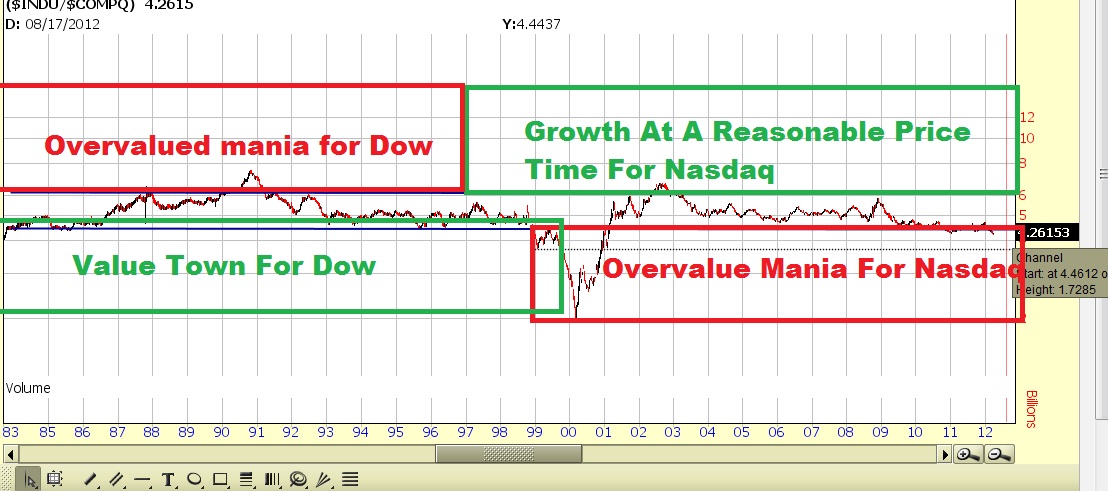
One Trend that is Shaping up is dow/nasdaq. Dow is very cheap relative to nasdaq as it was last month.
10 year Treasury prices remain around at all time highs as yields are below 2%. Bond Yields are in “contrarian” range in that they will eventually rise as they have fallen very significantly so since the early 80s.
Now technicals point to monthly overbought and possibly starting a downtrend. Weekly mixed signals so we will call it neutral, daily possibly about to turn bearish from overbought on further weakness. Early-Mid June points to a turning point.
If you enjoy the content at iBankCoin, please follow us on Twitter

One comment
Pingback: ALWAYS SELL IN MAY (or when people are too clever for their own good) | The Reformed Broker