Mutual fund cash levels
July 2011 3.3% cash
August 2011: 3.4% cash
Sept 2011 3.8%R
Oct 2011 3.5%
Nov 2011 3.5%
December 2011 3.5%
historically very low
10 year PE 22.47 (EP yield 4.45%) Historically slightly higher but still reasonable.
S&P div yield 1.97 (historically low)
10 year treasury around 2% (historically near all time lows)
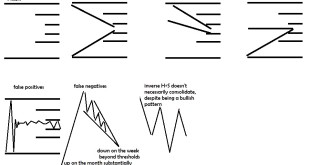
The stock market has recently taken off. Although the monthly chart is now confirmed bullish on the parabolic SAR and MACD histogram is close to turning bullish, the monthly chart is overbought at the same time it is turning bullish. Meanwhile the daily and weekly charts are egregiously overbought.
So although there may have been a very brief period of time to get a bit less cautious, that time is quickly changing.
Holding treasuries is perhaps even more vulnerable as the RSI as well as the slow stoch is overbought.
So what is one to do? This is where focused effort can be placed into looking at correlation and a margin of safety. Risk off should remain a fairly large portion of your portfolio, profits should be taken in both risk on and risk off and cash should be raised.
If you seek to trade, you can use daily, weekly and to some extent monthly signals on individual etfs. However, if you are less concerned about trying to time the market and less inclined to rotate your portfolio through trades, you should look to find a margin of safety and undervalued names as well as look at the monthly chart. A bit of both methods perhaps is ideal as it will cut down the correlation of your portfolio even more, and allow you to invest with multiple time perspectives in one portfolio.
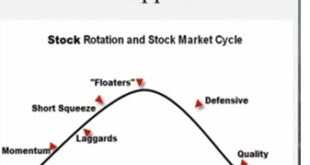
Your long term return should seek 3 things things. One is a high Alpha at all times. You want to identify securities that are trading well below their value to buy. (You also may seek those that are trading well above their value to sell) This is “seeking the outliers” in the following chart. It is buying $1 for 50 cents.

The 2nd thing is basically to shift the beta based on market conditions. This is timing the market as a whole. You can either shift into selling a greater percentage of assets that are overpriced, and out of those that you own that are underpriced, or you can use index ETFs to shift assets.
You want a higher beta when the probability of the market trading higher is large, and a small or negative beta when the probability of the market trading higher is low, assuming all else is equal.
I prefer to monitor my correlation to the S&P and aim to reduce it when the market is vulnerable, but also I use a balancing act between general ETFs such as the TLT, UUP (and other currency etfs) and SPY,QQQ,FXI and other index etfs.
Generally you want to watch the market trend and the overbought/oversold signals on multiple time frames to keep everything in perspective and to reduce your position size of risk assets when the market is vulnerable to a correction, and shift into more aggressive holdings and a larger beta when the capital is shifting into the market.

The third thing is to monitor overall correlations among your assets. This is often overlooked, but the thing that is important is to reduce your correlation. When the markets crash, the people that do best are those that have assets that are not strongly correlated with the market. Many assumed the subprime mortgage crisis would not effect everything else, but in fact it did. There was a greater correlation than people realized and those that thought they were diversified by holding stocks of different kinds were in trouble.
This can be illustrated by the following using a bit of thought.

You get a greater return by 2 independent bets at 1/2 the "optimal" bet. Therefore, more independent bets provides superior long term returns. In the stock market everything has a correlation, so no bets are really completely independent at the same time. However the closer the correlation between multiple assets to zero and the closer the return/risk of these bets, the more these principals come into play. So aside from shifting your beta while maintaining a high alpha, you also must be diligent to be sure you can do your best to reduce correlation. If the future were completely known and you knew where every stock and every asset would be, there would be no need for diversification and reduction of correlation. If the future were completely random, that would be all that matters, so some of just how correlated you are depends upon how accurate you are as a prognosticator and how clear your crystal ball is. The same goes to how much you ramp up your beta when you see the future in stocks as a bright one, and your individual skill as a stock picker should depend on how much effrt you spend in selecting individual names vs broad index funds. I will try to reserve the trend report for helping assess where we are and how to plan (beta, allocations among large general classifications, correlations), where as the trend trader will be reserved for assessing individual assets among those groups.
I would continue to remain defensive. Your beta should remain low. Your correlation to the market should be low or even negative at this time. You should run through each asset you own relative to every other asset.
There are two types of correlation, one how your overall portfolio correlates to the market. The other being how your overall portfolio correlates to itself. Unless you have certainties about where stock will go or a high level of confidence or an extreme amount of difference in value, you generally always want your portfolio to have close to zero correlation with itself with multiple assets.
But the shift of risk relative to the market sometimes referred to in some situations as "beta" has to do with the conditions. Bullish conditions should have a higher beta and higher correlation with the market. Beta also refers to leverage where this correlation calculation does not.
http://www.sectorspdr.com/correlation/
How much you shift your beta depends not only on conditions but on how aggressive you want to be. Generally I might say that a uptrend monthly chart with an uptrend weekly chart with both overbought should be perhaps slightly more bullish than a downtrending monthly chart with an uptrend and overbought weekly chart. However we are more overbought than before on a weekly and daily level so it’s relatively moot.
If you find it difficult to reduce your positions, one way to do it is through shorting an index ETF. I tend to try to avoid owning overbought markets so I will sell them and do my best to rotate into somewhere less overbought. Regardless, the art involves alpha, beta, and the right balance of correlation. It is no easy feat, but if it were easy, there would be no one to take the other sides of our trades, and no fiscally irresponsible money manager to lose through volatility over time for us to gain. Which brings up the question, why help other traders? First, sometimes a little information does the people you teach more harm then good if they do not apply it correctly, or only apply some of your teachings. There is a saying that a little knowledge is more dangerous than none at all, because it can result in the overconfidence that leads to ruin. Secondly, because there are trillions of dollars in the stock market, many people already know this so the damage you do by helping is negligible, and the gain you get from sharing and learning the knowledge yourself is worth it. The people who teach the information they learn, learn better and recall the information better. This is why I don’t mind blogging from time to time, while giving myself a journal of sorts to look back on as well.
February
| commodity valuations |
http://www.wikiwealth.com/commodity |
| commodity etfs |
http://etf.stock-encyclopedia.com/category/commodity-etfs.html |
| currency valuations |
http://www.wikiwealth.com/country |
| currency etfs |
http://etf.stock-encyclopedia.com/category/currency-etfs.html |
| bond etfs | http://etf.stock-encyclopedia.com/category/bond-etfs.html |
| reits etfs |
http://etf.stock-encyclopedia.com/category/real-estate-etfs-reits.html |
| resource etfs | http://etf.stock-encyclopedia.com/category/resource-etfs.html |
| asset allocation etfs |
http://etf.stock-encyclopedia.com/category/asset-allocation-etfs.html |