We all most likely have some sort of psychological breaking point in which we would give up on the system, or in which we should probably re-examine our strategies, and in some cases, in which people go crazy and “break” to the point where they start revenge trading and no longer are actually trading their system. The prior risk management modeling I’ve done using a spreadsheet has not taken into account fees or how one handles draw downs. I have modified the spreadsheet such that there WILL be a fixed fee involved with trading (thus if you have a significant drawdown fees play a much bigger role as a percentage of your account), and I have added the ability to add a “kill switch”. Since I added fees at minimum, it’s necessary to have at least a kill switch of 100% (loss) so you don’t go on calculating $12 fees when your account is less than $12 and continue to go negative. In the meantime I set it up for 1000 hypothetical trades since we now have a more practical model I can simulate it for much longer time periods if need be.
So my hypothesis is people will give up after a drawdown of varying amounts. This drawdown is from the account HIGHS, not from the starting amount. Thus, for some people the end result after 1000 trading periods (whether they participate in all 1000 using the given strategy or not) will actually sometimes be better if they risk less to avoid this breaking point.
PLEASE understand that this simulator only uses one trade at a time as if you only play a single OTM option trade at a time and hold no trades simultaneously. In reality having more relatively uncorrelated trades at a smaller risk % per trade can often improve results at less risk, especially if you have multiple systems such as profitable investing and trading stocks and other asset classes in combination with your options. I will get around to testing partially correlated trades simultaneously and possibly entirely different systems in the future. For now the expectancy is based upon
| p1 | 17% |
| p2 | 20% |
| p3 | 16% |
| p4 | 23% |
| p5 | 24% |
| w1 | 294% |
| w2 | 52% |
| w3 | 0% |
| w4 | -64% |
| w5 | -100% |
My 2013 OTM option trading results at various risk levels and various kill switches to see a distribution of simulated results. For all accounts I will use a $10,000 starting portfolio and $12 for completed transaction (buy fee plus sell fee) just to use round numbers and so that fees is somewhat significant to the equation.
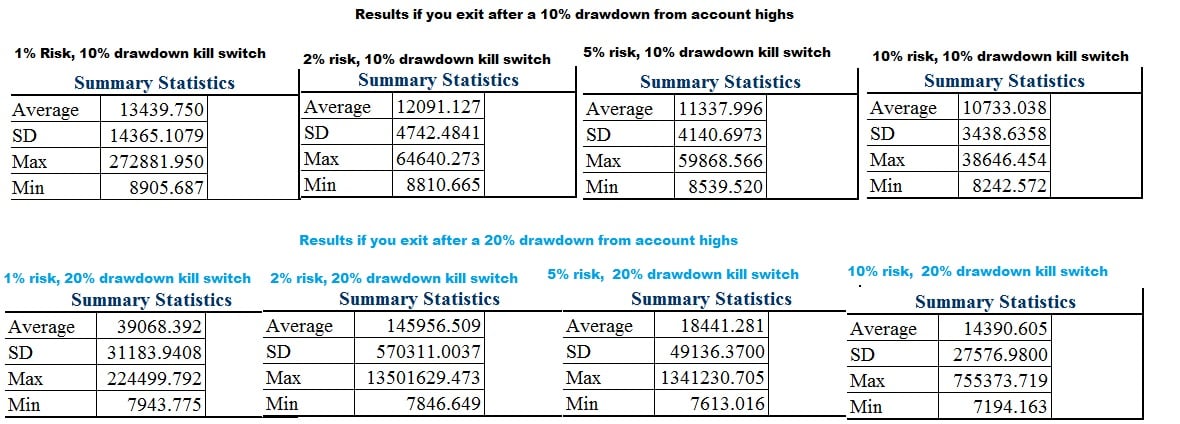
First let’s start with someone who is very risk averse and cannot handle even a 5% drawdown without feeling incredibly nervous and emotional and plans to quit at a 10%.
I had to think about the results and double check them at first, because I was surprisingly getting a significant skew right with only 1% risk.The mean is greater than the median. (i.e. the “average” is skewed by a smaller number of outliers such that the majority of the people are actually below the “mean”)
The reason was that at 1% with a 10% drawdown, you not only have too little capital at risk to the point where fees will eat away and a large percentage won’t get off the ground, but also that it is extremely common that at some point within the first 200 trades of those 1000 that you will hit the kill switch and very few will make it through all 1000 to produce significant gains which on average will be pretty high even with 1% risk (given that you can last that long). The overall average was still above the starting amount of $10,000, but in most cases, the fear of drawing down killed the traders hope of making money and taking risk. Increasing beyond 1% actually reduced average results because more risk = more volatility and greater probability that you will drawdown before giving your system a chance to compound it’s gains. 10% in theory is around “optimal” in terms of maximizing geometric return, but to someone who is risk adverse, it is probably less than 1%.
I then decided someone who is mildly risk adverse and doesn’t like 10% drawdowns, really starts to go crazy after 15% and ultimately feels compelled to shut down the account after a 20% drawdown. This was interesting because the average ending amount really increased from 1% to 2% but then decreased to from 2% to 5% to the point where you are better off risking 1% than 5% if you can’t handle a 20% drawdown.
I didn’t gather the histograms yet but here are the data points for 1000 monte carlo simulations of 1000 trades under each given condition.
30% and 40% drawdown was up next.
As you increase risk and become more lax on the “kill switch”, the worst case scenario gets worse, but so does the best case scenario. The skew actually becomes less noticable with a larger drawdown switch AND less risk per trade. Over the long run if you LET the trading system work, the results begin to normalize and cluster around the average. However increased risk increases the skew and depending on the drawdown kill switch may not improve even the MEAN average results. With these trades the approximate kelly criterion is 15% of capital but with even the risk aversion to withstand a 30% drawdown from high you are still best risking less than 1/3rd of the kelly.
So that brings us back to the kelly criterion graph which is entirely misleading if you are not aware of the other variables including personal aversion to risk, sample size, time period, etc. This graph is with the assumption of infinite time on your side because it was mathematically convenient. However, based upon some understanding of real data in a finite number of time given certain psychological barriers one has to cross among other things you know that for practical application even risking 1/3rd of this amount is incredibly aggressive when using an option based market strategy assuming one single uncorrelated bet at a time. We are also assuming KNOWN information and a fixed edge as opposed to a more uncertain one, both of which favor more caution. On the other hand, I believe I left a lot of money on the table and can improve my system by executing it and managing it more efficiently, and that eventually I will get around to testing how multiple trading systems work on the account. My theory is you can reduce risk and increase return by using complimentary systems (a stable consistent risk adverse system combined with an aggressive one both of which are relatively uncorrelated with the right mixture will compliment each other and both improve return and reduce risk while “normalizing the returns” over a finite number of time)

Hopefully this post is enlightening and helps you really analyze and understand risk, and I look forward to advancing my spreadsheet in the future to help me more thoroughly analyze a more multi-dimentional (synergistic) approach to risk.
If you enjoy the content at iBankCoin, please follow us on Twitter


Since 1/2 the kelly produces 3/4ths the result with half the volatility; theoretically many many zero correlation positions simultaneously at a very small risk percentage would be best to maximize expectations AND reduce drawdown if you could find enough with a positive expectation and do so without fees becoming a greater issue. Realistically though, there is a balance between many different variables.
Account size, fees, correlation, profitability of each trade, availability of capital, time horizon, ability to add/subtract capital,etc. It is a monumental task to really analyze properly, but I will work to slice it up into different pieces and analyze it as objectively as I can while providing the best look at the “big picture” as I can.