So In the last few post I have really focused in on objectively modeling risk within a portfolio given a particular system. Before I go and amend the heck out of the spreadsheet to upgrade it to include the possible input of fees, of monthly addition of new capital to combat some of the decay, adding a “kill switch” input/function where the results are automatically capped at a particular loss if you draw down below a certain amount of your initial risk, and possible other features at some point I may add, I wanted to actually use it as is using objective numbers rather than an arbitrary 20% probability of a particular result with a set expectation.
So I have set up all my trading results not including open positions over 2013 using options while setting stock trades aside separately. I chose to include hedges in the calculation. I did not update a few trades including my 1200% gain in twitter calls. Here are how I looked at the results. I had 281 closed trades since I started tracking. I have room for 5 inputs of theoretical “results” so how I break this down may create a slight difference from reality and theory here, but this is just a model. I want to keep all 100% losses together separately. I have 71 trades that expired worthless. That is 71/281=~25.267%. That is better than I thought I would get because of the aggressiveness of the options.
Now, I want to take a few slightly better than break even and slightly worse that average zero%. I basically took any option trade that made between -18 to 18% and got 33 trades that effectively equal a scratch 33/281=~11.744%
Then I want to average all of the remaining losses not included in the “scratch” area. These most likely will be premium that I salvaged to avoid the 100% loss and those nearing expiration that had failed to move enough.. The average loss here is ~63.8143% and there were 74 trades in this category 74/281=~26.3345% The actual expectation was positive but less than 1% but I will round down to 0%
Now the WINS. Any win over 100% deserves its own category. There are 43 of these 43/281=~15.3025% of all trades with average ROI of ~293.0585%.
And the remaining WINS. These were most likely trades that either I managed poorly and took off before it reached my target, or ones in which I sold and/or rolled out as expiration forced the issue. There are 60 of these 60/281=~21.3523% for an average ROI of ~53.87795%.
So… Now we can define our system. I like to list the GAINS from highest to lowest for easy and consistent interpretation when I look at other systems or modify the expectations.
This is one way to show what the system looks like.
P1=.153025
P2=.213523
P3=.117438
P4=.263345
P5=.252669
W1=2.930585
W2=.5387795
W3=0.000000
W4=-.638143
W5=-1.00000
We confirm that the probabilities are correct because these all add up to one. 37% of my trades produce a win, 48% win or approximately break even. But the largest gains clearly outweigh the losses.
The old way I used to do things would plug this in a kelly criterion calculator, find out that a full kelly I could risk 10% per trade if traded a single trade at a time, and then use my own calculator that factored in fees and correlation and multiple bets at the same time and fees and based upon a $10,000 account would conclude that the “optimal” number of trades at a 60% combined correlation would be 14 trades at 2.6% risk per trade for total of 36.4% capital at risk. Then I would curb that to aim for maybe 7 trades at 2% each.
But now I have learned that 10% resembles more of a “lotto ticket” even after 300 trades. But, I have my baseline of 10% as the max and can make an entirely new distribution at 1% 2% 5% and 10% to show you the difference between this system and one with a 20% probability of either 150% 50% 0% -50% or -100%.
First let us redisplay the results from the arbitrarily determined system
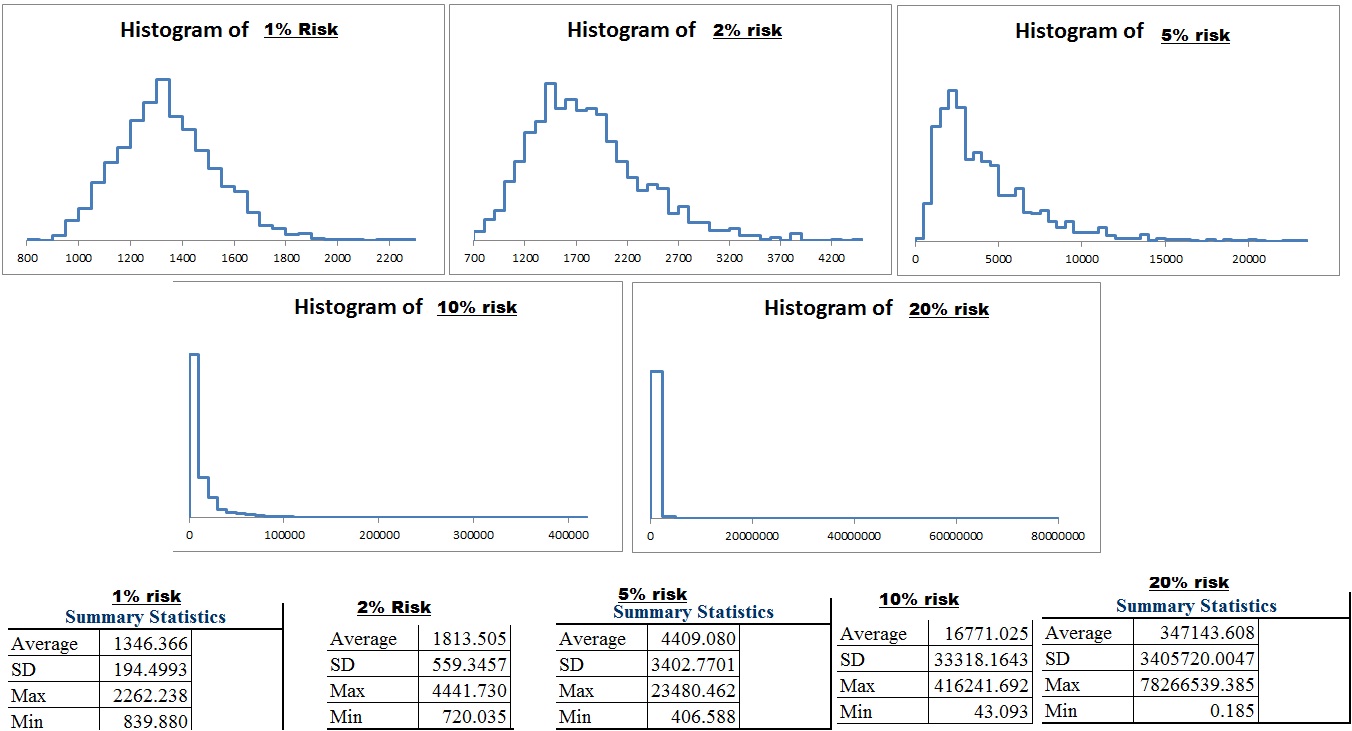
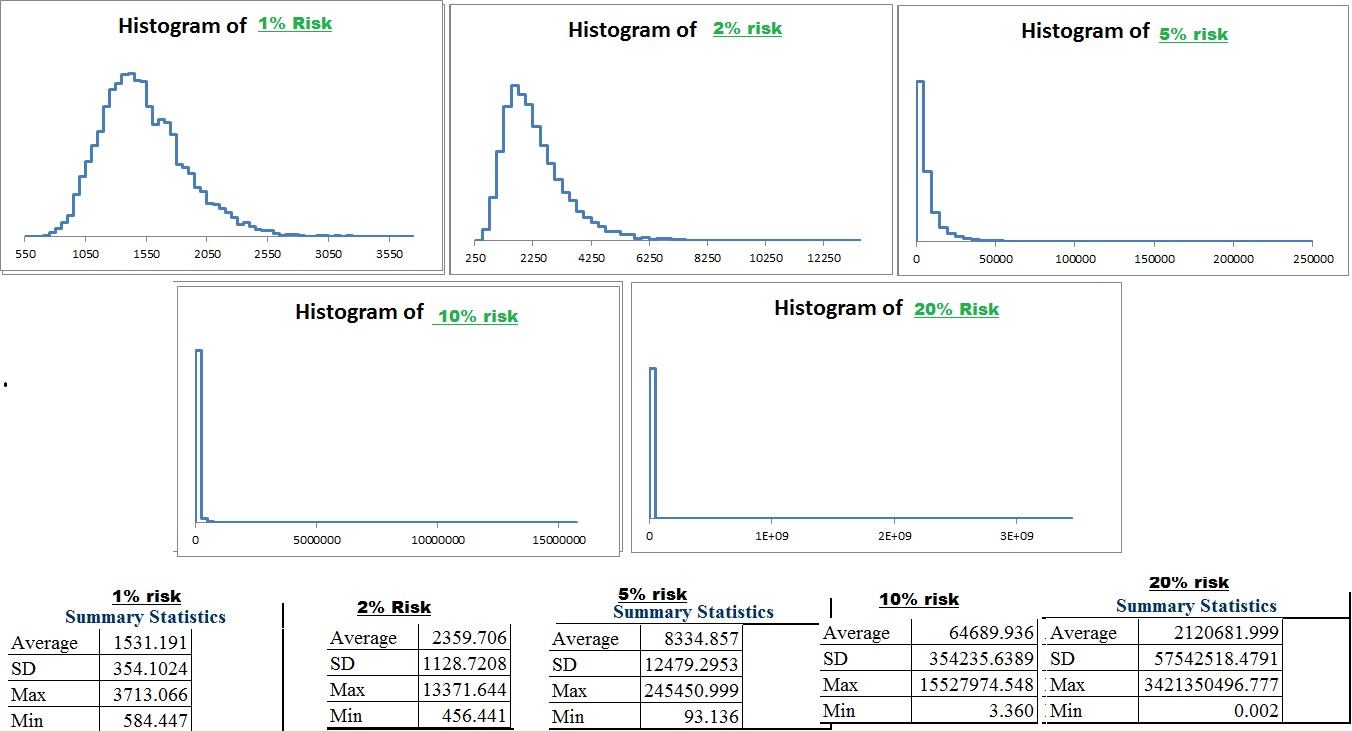
Now that we have real numbers, I want to be a bit more thorough than just using 1000 simulations. I will bump it up to 10,000 simulations per risk level. I will leave it at 1,000 just so the numbers remain the same. Keep in mind that the kelly criterion for my trades in reality is 10% vs the theoretical system is 14% so 1% risk actually is MORE aggressive with my system than the theoretical one. As a result you should expect a higher standard deviation and a higher average. With a larger simulation alone you will get a larger minimum and a larger maximum as well anyways.
And here is what the histograms and data looks like
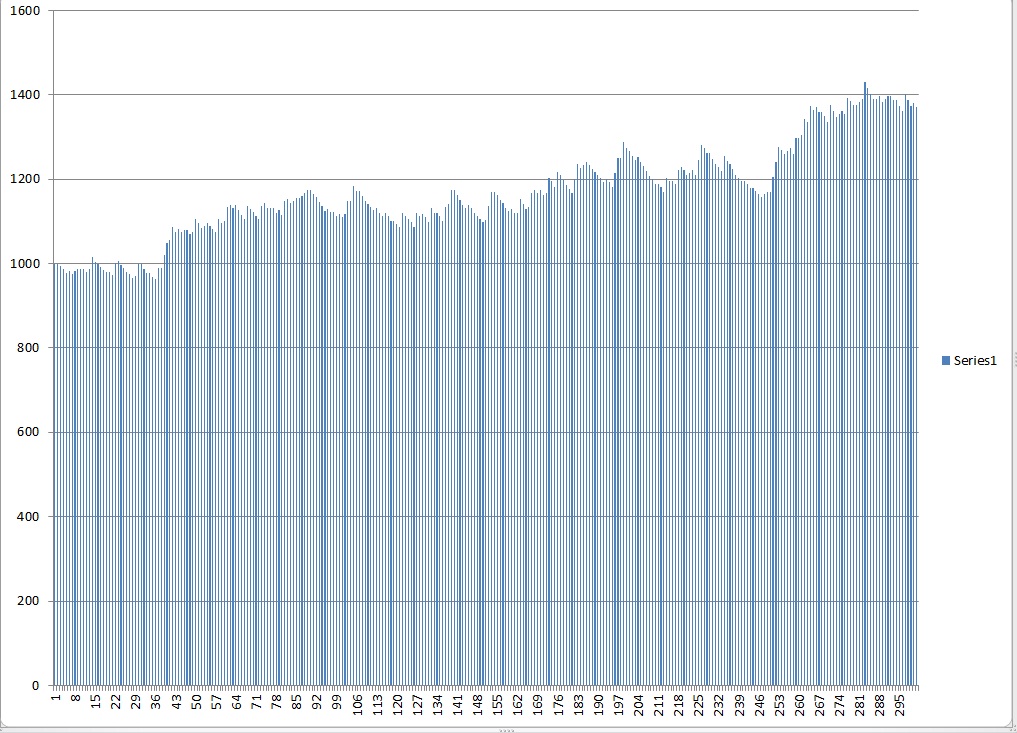
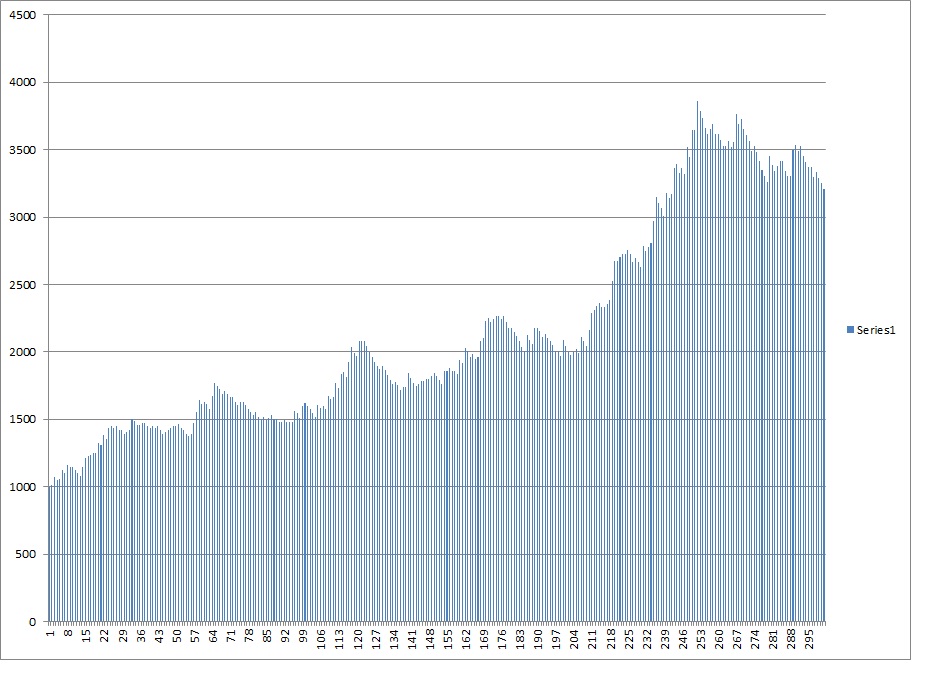
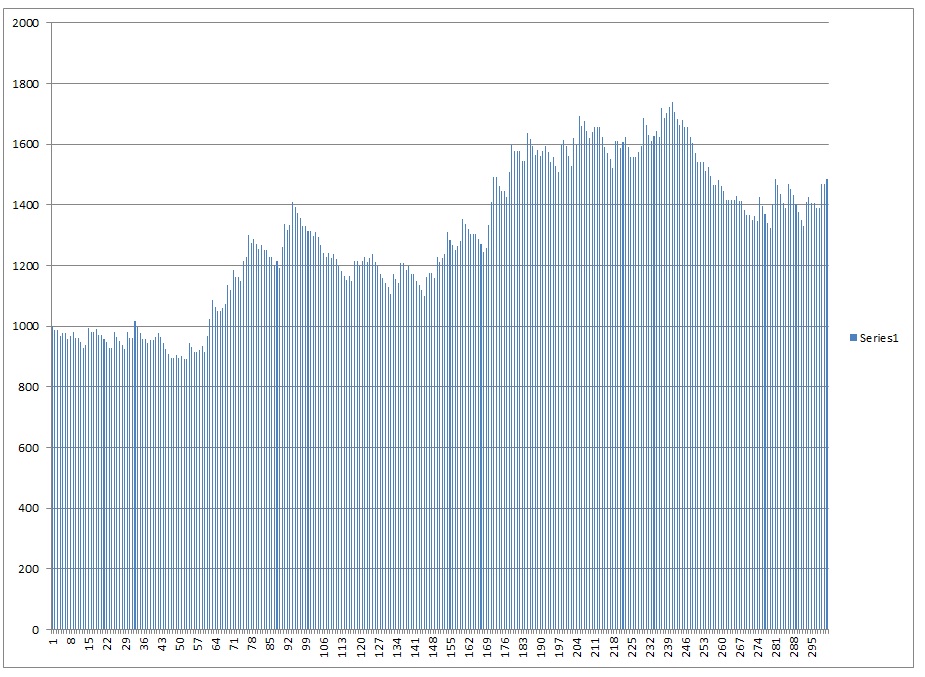
I think more telling than the distribution since it is so difficult to see at what level the large decline really starts when you deal with such large numbers is the sample equity curves. So I will run a few of those. Click here to look at the equity curve of the theoretical model. and here are a few sample equity curves modeled after my trading abilities.
1%
2%
5%
AND half a dozen examples of 10% risk and the vicious account volatility
It’s important to understand that 10 simultaneous trades at 1% functions much differently than 1 trade at 10% or 10 trades over 10 trading periods at 1%. Unfortunately it isn’t so easy to model this and the results depend greatly upon how correlated the trades end up being (the lower, the better provided you can do so while still having the system be as profitable). For informational purposes, assuming no fees, you will see 10 simultaneous trades at 1% each function as a cross between 1 trade over 10 trading periods and 10% as you get some of the low risk volatility benefits of small position size and some of the high return benefits of 10% risk. The result is usually a better return per risk.
Going forward, I am working on improving this simulator so that it can allow for additional inputs that will help test how fees, adding capital, multiple simultaneously partially correlated bets and having “complimentary systems” can potentially positively influence return while also reducing risk.
If you enjoy the content at iBankCoin, please follow us on Twitter
