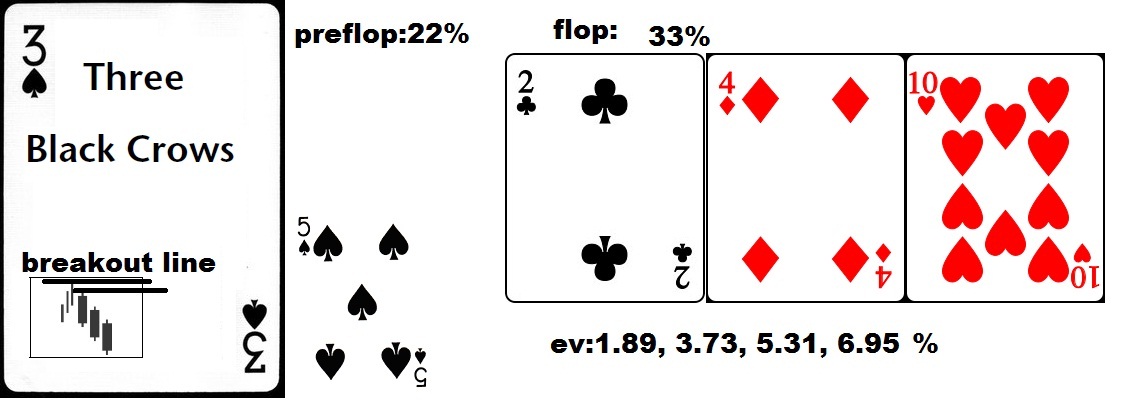
The last post candlestick charts as a poker hand goes into minor detail about the 3 black crows chart pattern. It can be summed up by this image
Some more details about the pattern:
If price opens within the body of the previous candle (or at least ties
with the prior close), it’s a valid three black crows pattern. 3 candlesticks make up the pattern, price trend prior to candle should be upward, the pattern itself should move downward each closing at or near their lows, also closing below the previous candles low.
Measure rule. Use the measure rule to help predict how far price will
rise or fall. Compute the height of the candle pattern and multiply it by
the appropriate percentage shown in the table*; then apply it to the breakout
price.**
*In a bull market, an upwards breakout of this pattern leads to 33% meeting target.
**Due to the low number hitting target and possibility that those that do greatly exceeds it, I prefer having a fixed number of days to hold this instead, such as 5 day hold (5.3% average gain) or 10 day hold (6.95% average gain from breakout), losses though probably should be managed with a stop order below the lowest low of the pattern before it breaks out.
How to find 3 black crows without going through thousands of charts:
Some stock screeners allow you to find chart patterns. In this case, the three black crows chart pattern can be screened for.
Open up “prophet” in think or swim’s platform, In the menu bar go to patterns, Find candlestick patterns…
Then click on patterns and find “Three Black Crows” and make sure it is the only one selected.

Then you can go through the ones selected and double click and you will see this.
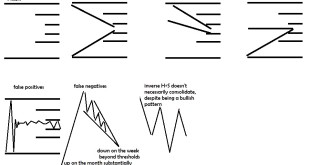
The box highlights the pattern. You have to analyze whether it is confirmed bearish breakout, confirmed bullish breakout, or unconfirmed. If it’s confirmed bearish, you can either trade the bear pattern, (going short) or just ignore. If you trade the bear pattern you have to know your odds and “expected value” as well. If it’s bullish you can buy it if it hasn’t gotten too far away from breakout line or just leave it. Ideally you look for an unconfirmed breakout so you can act and set a stop buy just above the breakout line.
If the pattern has just occurred and is unconfirmed, you may want to set a stop buy order a few cents above the highest high so that you buy it immediately after a intraday move above the breakout price. This will prevent you from missing out on a big move that happens too quickly for you to react although it’s still possible you miss out on an overnight gap upwards. But overnight gap confirmations actually work best. This pattern is frustrating to set the buy order and have it not execute 78% of the time, but just like a poker player playing suited connectors trying to crack someone who has aces, it probably is still entering the pot to “see a flop” Fortunately, you aren’t forced to pay to place an order that does not execute like poker where you have to call to see a flop, but you do probably want to temporarily have the cash on the side available for this trade so it doesn’t risk putting you on margin to execute it so there is a minor “opportunity cost” to “see the flop”.
If you enjoy the content at iBankCoin, please follow us on Twitter

Looks like Fio faked to the downside, then broke to the upside also making a triple bottom before its Pre earnings run and now it’s going H.A.M!