I believe combining two subjects and relating one to another engages the brain in a way that is more condusive to learning. The more associations we make with a particular topic, the more we can draw upon metaphors and general understandings.
As both a poker player and investor, it’s important to know your odds. Unfortunately with stocks, there are a lot more than 52 cards in the deck so to speak and sometimes your odds changes drastically even given the same hand. So where as in poker you can estimate the probability that your hand will win with clarity in the market at times you are playing a bit more “in the dark” (without knowing the true value of your hand/pattern). Like Stock trading, Poker playing is a game of odds over the long run, wit and bold decisive action at the right times. However odds can be estimated using enough of research from past results to at least allow one to determine if it seems worth playing.
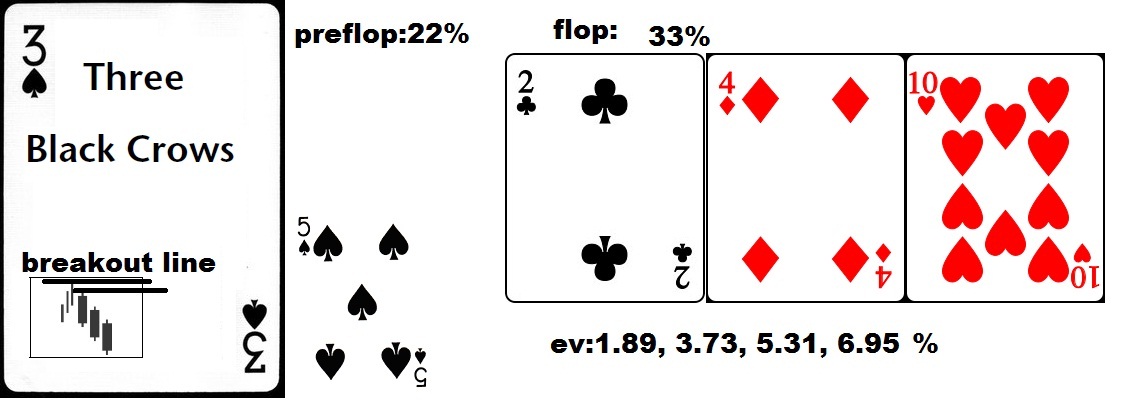
The first “hand” I will talk about is the equivalent to suited 1 gapers. Not particularly strong initially, but has potential and worth playing if things continue in it’s favor. We will use the hand 35 of spades in this example. This hand in the market is the “Three Black Crows” candlestick pattern. In theory the pattern is bearish and more often than not it in fact is a pattern that occurs often before a decline. However, once the chart has broken to the upside and confirmed an upward breakout, this pattern suddenly becomes a winning hand. So a hand with bad odds initially that improves and that provides a good enough payout if you hit, is the perfect metaphor.
The chance of stocks breaking to the upside is low at 22%. These are your “preflop odds”. The “flop” (odds of hitting target) improves your odds to 33% say a 24T. You do not have a hand but you have a draw and your odds of winning improve to 33%. After a breakout is confirmed with a move above the breakout line and the “expected value” (Average expected net result) over a
1 day period:1.89% gain
3 day period:3.73% gain
5 day period:5.31% gain
10 day period:6.95% gain
If you hit your draw, you get paid off and this compensates for the low probability of winning. In the market, you have a good expected return even though it often falls short of the target. Sometimes you will drastically exceed the target but overall it is a very profitable hand.
How to play? You can play the up breakouts in a bull market for the odds mentioned above. Wait until the right “flop” hits (It breaks to the upside) before getting money in.
The hand completely changes if you are playing it to the downside.
In the future if people like this concept of relating poker hands to the market, I will make some kind of deck of cards with all candlestick patterns and also price patterns. Price Patterns can either be evaluated as the initial swing or instead as a longer hold. Because the hold is often much longer, the percentage return is often better but that doesn’t always mean it’s a superior play. It’s a matter of style and preference.
At some point I would like to make a handful of decks of cards similar to flash cards in that the reverse side of the cards would be the flop and contain information on the odds and the front would just be the hand and the picture of the chart pattern or candlestick pattern and color coat them to represent the market conditions. In this case this would be part of the “up breakout, bull market” deck.There would be 4 candlestick decks since the odds for each situation are unique.
They would be:
Bull market, up breakout,
Bull market, down breakout
Bear market, up breakout
Bear market down breakout
Then there would be 4 decks for same conditions for “price patterns”.
*data used from book Encyclopedia of Candlestick Charts by Thomas Bulkowski
If you enjoy the content at iBankCoin, please follow us on Twitter


Bravo. Very well done.
Thanks chess, I love the idea of combining poker and investing. I should have a follow up post on the 3 black crows done a bit later today.
After that at some point I will do one on the double bottom price pattern.
Using the analogy with price patterns will be a bit different since you aren’t just holding for a set amount of days like you could with candlestick patterns, and it involves more setting stops and trading details of it have to be planned out. But I think I can still make the analogy work.