If you are leaning too strongly bearish or bullish and want to find a quick hedge in the opposite direction once things begin going against you, you could do a lot worse than a marubozu pattern. A Marubozu pattern is candlestick pattern where a stock trends from it’s open to the close without reversing directions long enough to take out the low or leave a “wick”. If it’s a white candle, and without taking out the high if it’s a red candle.
White Marubozu – bullish.
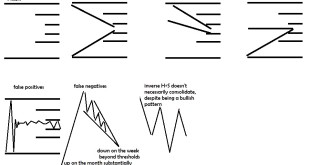
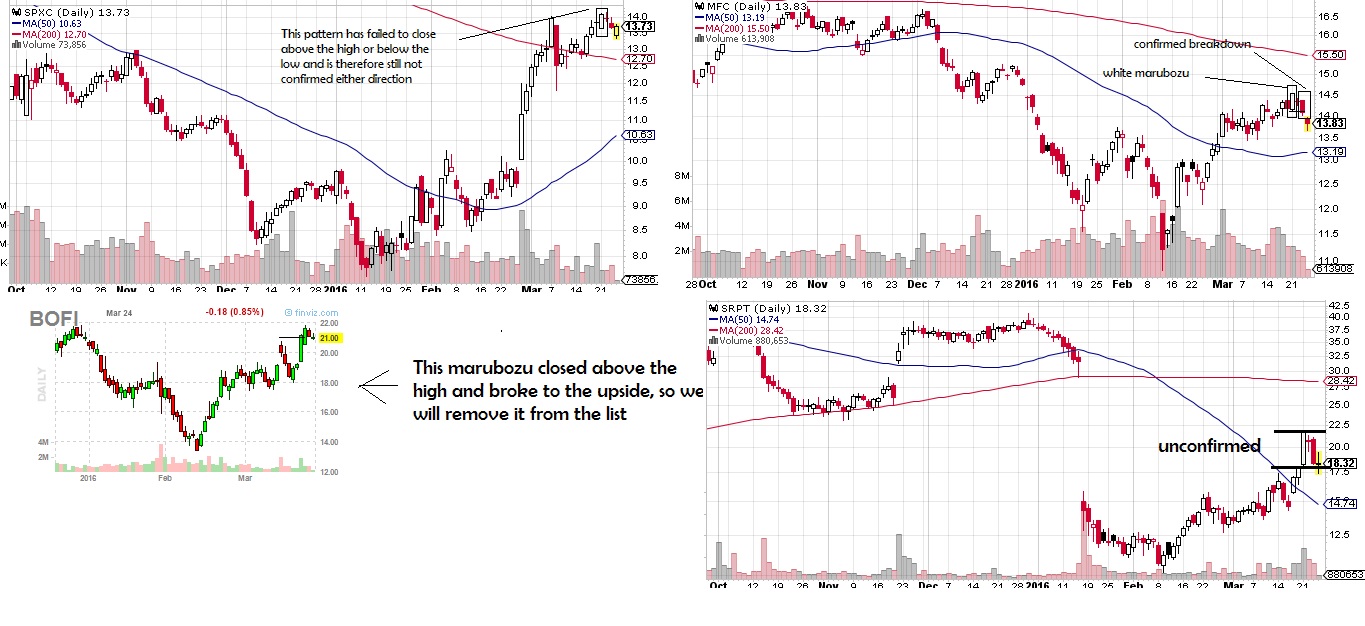
Although more than 50% of the time the stock continues upwards, the real trade works when it actually fails to follow through and then breaks down. This is because the strong move upward indicates a lot of capital tied up chasing the stock higher, and once this capital is underwater, stops begin triggering and selling continues. It is a confirmed “breakdown” once it takes out the low, which is also the open the day of the marubozu. It also often creates a measured move downwards pattern on the intraday chart. Look to trade it within the last 5 minutes before the close if it’s below the marubozu candle’s low rather than waiting until the next open where a gap down may cause you to miss out.
White Marubozu stats:
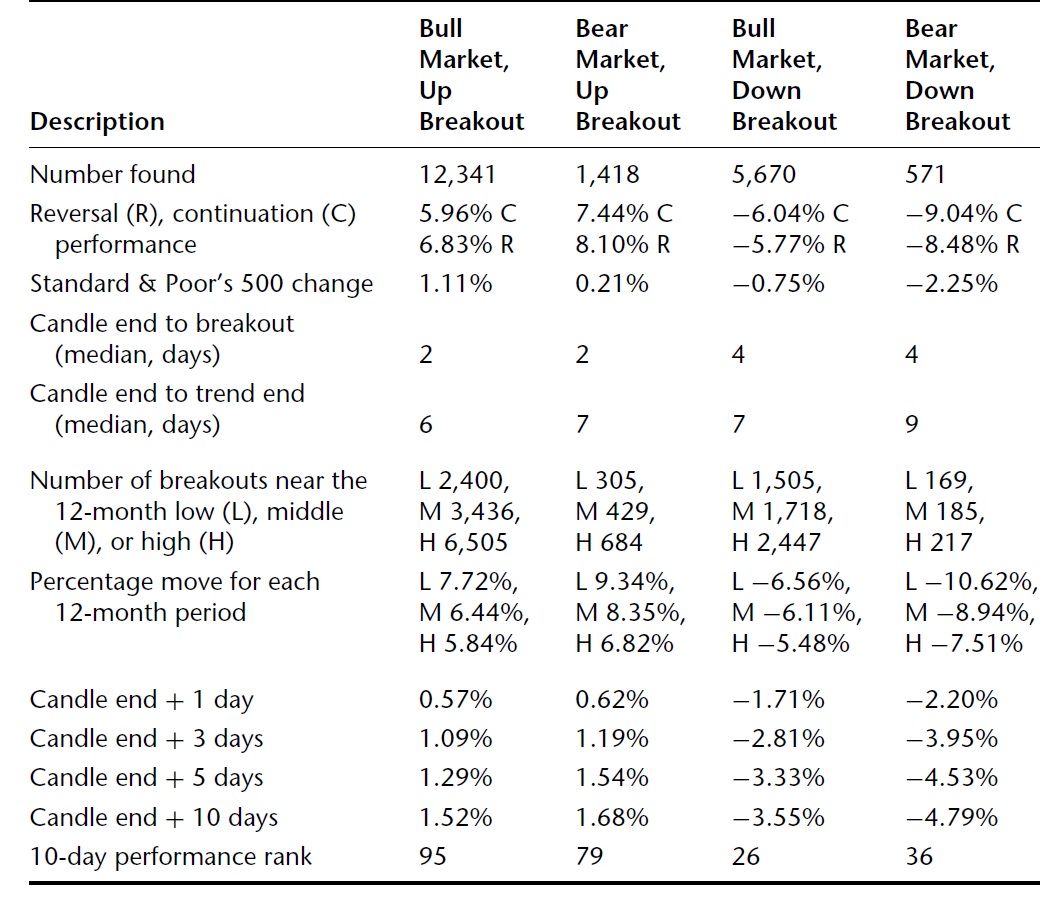
You can see the stats show an edge even when you’re trading against the current market environment, making it a good hedge in bull markets. It also is very common to find this “bullish candle” in bull markets and likely you’ll be able to grab a put on a big down day intraday or at close if there’s a selloff.
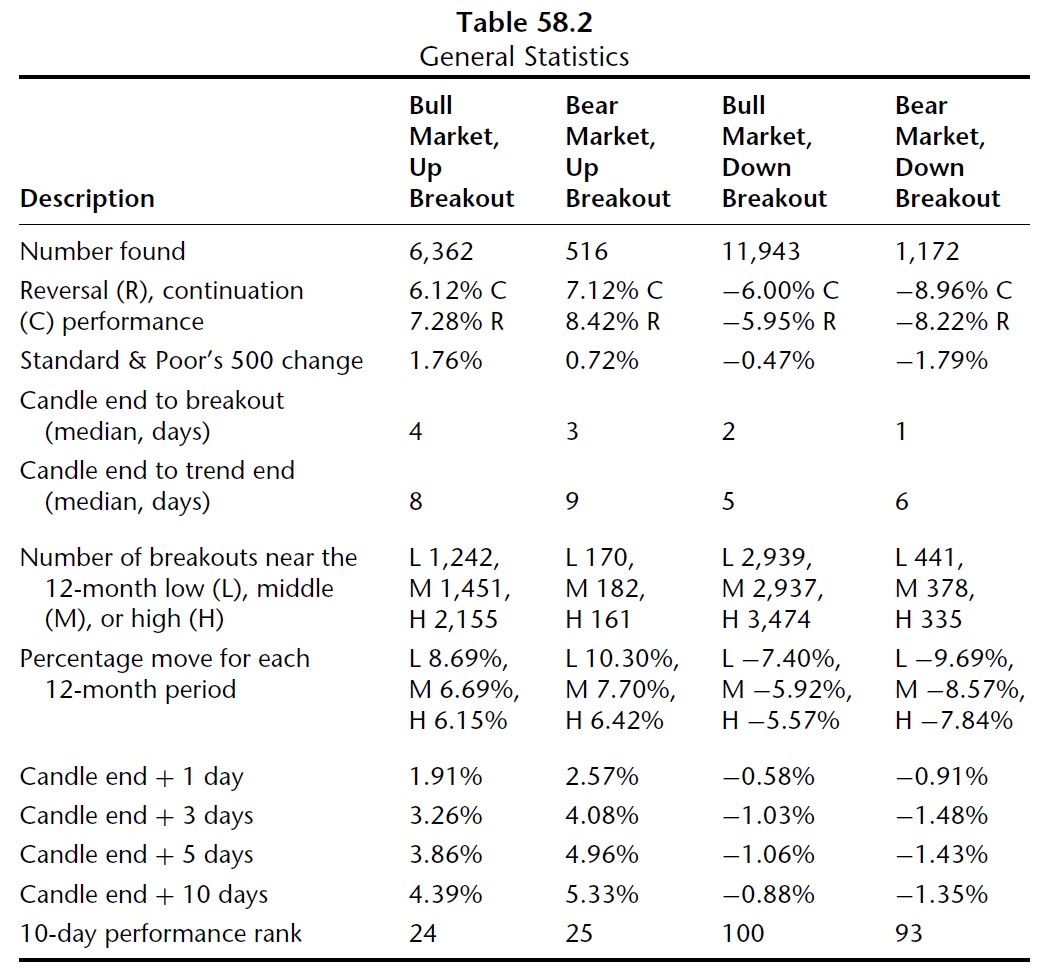
Black (red) Marubozu – Bearish
The black marubozu indicates a bearish breakdown that likely continues, but when it takes out the highs, you potentially have a short squeeze and sellers who are under exposed and want back in. Also, the strong trend down and movement required to reverse both requires a change in sentiment as well as it tends to create a measured move on the intraday chart.
Black Marubozu
This is actually a trading system that can be very straight forward, and is especially useful if you focus on weekly options for a 3 day move or so on stocks with historically cheap premium.
How it works:
Black Marubozu watch list:
1)Save a word document as “marubozu” and enter today’s date.
2)At the close of the day, use this screen and convert the list to tickers http://finviz.com/screener.ashx?v=111&f=sh_avgvol_o50,sh_opt_option,sh_price_o10,ta_candlestick_mw&ft=4
3a)Save the list of tickers under today’s date.
OR )Enter the tickers into finviz and save the link that links only to those tickers in your document
OR )Set a price alert at the low of the day for each stock
4)Each day, remove tickers that have followed through or already triggered the trade and repeat the process.
Using the watchlist
1)View: Either click on the link you created in the doc or copy and paste the tickers (or wait until you get a price alert.)
2)Once the order is triggered, evaluate for a trade, in the last 5 minutes in normal conditions. (potentially you may consider a system that trades intraday if there’s a correlated sell off or negative breadth, or market index just took out the days low or if you have some sort of additional confirmation)
3)Optional:If the close is back above the low, exit the trade.
4)Otherwise sell in ~3-5 days or when price target is met.
—————
5)Also consider anticipatory trades by running the scan 10 minutes before close and trading in the last 5 minutes, or taking an unconfirmed marubozu near the marubozu high. Stop on a close above the marubozu high. You will need to wait longer for pattern to confirm, but have a better risk/reward.
6)Also consider anticipatory trades IF the stock has failed to break out in 5 days with stop above the 5 day high.
———————————————
If you enjoy the content at iBankCoin, please follow us on Twitter