As some of you know, I created a little research tool that with a press of a button updates the latest finviz data and runs some calculations. I can use it to do a lot of different things but it is really an unfinished project to narrow the list of stock picks but I added other features. One of them is that it updates market breadth data.
![]()
Market breadth is some form of measurement of total advancing stocks vs declining stocks. There are many ways to look at breadth but in it’s simplest form it basically is a way of offsetting the market cap weighted average by telling you if participation is broad among all stocks on more of an equal weighted basis and a way to tell if market momentum favors the bulls or bears. I have set up these different measurements of breadth to focus on some of the more extreme movers in the market only. By focusing on the extreme moves I get a better litmus of what has moved substantially enough for one to conclusively say that the movement is more than just “noise” or temporary emotion. I am focusing on the conviction moves where people chased the stock one direction or another. Although the logic is simple behind breadth, there are a variety of ways to use it. There are longer term signals and shorter term signals, and there are breadth as a contrarian signal, or breadth to confirm a shift in sentiment.
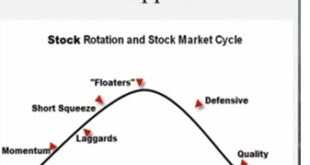
% movers indicate momentum and sentiment shifts
We will start with the % movers.This focuses on stocks that have moved beyond a minimum threshold in either direction. To be fair, I created an adjustment so that if a stock has moved up 150%, the down equivalent was the amount needed to bring the stock back to it’s starting point after a 150% move upwards, or a 60% decline. Initial thrusts of breadth upwards after bearish conditions are the proverbial “green shoots” that may begin to trigger/signal a shift in sentiment. One or two of them might happen in a bear market too as the rips higher are fast and violent. So depending on how aggressive you are with trying to time every move and whether you try to anticipate the next move by buying the oversold conditions, or waiting for the shift in sentiment to take place, you may or may not want to wait for more substantial confirmation. Tracking these results on a daily basis and creating a 5 and/or 10 day moving average is one way to go about monitoring the movements for fast rips and sustainable shifts in sentiment. Typically the more bearish and greater declines that precede such a shift sets up more bullish conditions once sentiment flips to bullish and all the cash on the side and value created will trigger value buying plus growth and momentum buyers and retail trader chasing higher following conditions where everyone that was ever going to sell already had done so.
new highs/lows as contrarian signal
Tracking new 52week highs and lows (or in this case, within 1% of those marks, is a way to look at longer term accumulation vs declines and can be useful as a contrarian indicator or early-middle bull market/ middle-late bear market indicator. When there are little to no stocks at or near their lows, you may want to consider raising a bit of cash, position sizing a bit smaller, and being a bit more cautious and/or hedging. Tops are gradual, but short-intermeidate declines can be sharp and painful if they are correlated and violent. New 50 day high/low is the same principal, but can be used to confirm the longer term signal or on a shorter term basis for a more active signal. If stocks are 90% near highs vs lows but those within 1% of their 50 day high/low does not confirm, there are still perhaps some stocks near intermediate term lows offering buy the dip opportunities as opposed to a euphoric mania. If stocks are over 90% near 50 day high/low but perhaps on a 52week high/low they aren’t giving a signal, you could be near a temporary swing high and perhaps some minor caution in preparation to buy at a better price might be warranted.
Moving average breadth as trending indicator
So another form of breadth is looking at moving averages. You can use moving averages to indicate either a recent reaction and mean/reversion or as trending indicators depending on how you set them up. You can use these at whatever duration of moving averages that you want. I have just set up the standard 20 day 50 day and 200 day moving averages. I want to look at the % of stocks above each moving average (uptrend) vs the % below each moving average (downtrend) If instead you only look at those significantly above each moving average, you can look at it as the % of stocks at overbought or oversold extremes as well for mean reversion and a more contrarian oriented signal.
Then I looked at stocks with accelerating trends or an indication of a more convincing trend as it lines up on multiple time frames to be trending. To do this I looked at stocks with their 20 day moving average above their 50 day moving averages AND the price above their 20 day moving averages… vs stocks with 20 day average below their 50 day moving average and price below the 20 day moving averages. Most likely this would often produce very similar results as saying the 5 day moving average must be above the 20 day and 20 above the 50, or 5 day below the 20 day and 20 below the 50. I repeated the process with 50 day and 200 in place for the 20 day and 50 day for longer term trends.
Breadth Divergences of leadership:
One of the reasons I track TWO moves of each timeframe on the % movers is to look for leadership. One of the movers is a significant, but lesser extreme than the other. When I look at 4% movers I like to see these MORE bullish than the 1% movers and if there is to be a shift off lows, I like to see it on increased leadership/aggressive chasing that is more indicative of a paradigm shift than just your increase in buying equally due to temporary emotion on news without any clear leaders. If the 1+% movers are for example at 30% and the 4% start to creep up towards and above 50% first, this to me tells me there is a shift of sentiment and people are willing to chase a select few stocks higher, which may become the leaders of the future. A healthy market will have leadership emerge first, and that will give you an opportunity to get in before the leaders lift the rest of the stocks.
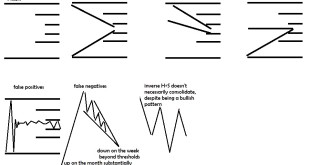
Breadth Divergences of TIME:The other kind of divergence is one of time. This is when the breadth signal on monthly data is bearish and the shorter term signal on the week and/or day shift bullish. The problem here will be how to interpret the data… Either it is a rip to sell into, or the start of a shift which will turn the weekly and monthly data positive and lead to a greater, longer term sustainable move. This signal in and of itself is not useful unless you can put it into proper context.
Breadth Intraday Shift:Tracking these results a few times a day can illustrate how things change over the course of the day, particularly when held in context. The best signal I have got since tracking this was when the Russian invasion of Ukraine took place. First everything was down as one might suspect, but the 4% movers were less bearish. This started to drag down even the 4% movers to become slightly more bearish at first as panic selling spilled over to whatever whas up and those down moderately spilled to more substantial losses. Interpreting this was initially difficult. Was it that the smart money that had a lot of capital to move accumulating on the fear and wasn’t believing in the decline but the broad sentiment and panic caused them to sell off, or did the smart money begin to shift as well, recognizing that things could get worse. But then towards the end of the day the 4% movers started ripping first, and turned very bullish, followed by the 1% movers turning moderately bullish. That signaled that all the fear based selling was over and the market began to recognize it for what it was… a buying opportunity on fears of a world war that may not materialize. This continued into the next day along with the news that came that Russia was withdrawing their invasion and for the time being the signal got you near a nice swing market low and if you followed along with OA’s risk cycle, it was a fortunate situation as you knew what to buy and you had a signal to get in the market ahead of the big part of the move.
Adding Volume Filters: One thing you may want to do is only look for stocks that are up or down on the day on volume that is significantly greater than usual 1.5x, 2x,3x. This signals more active participation than usual and will better measure of participation as opposed to thin volume movements that may not be as telling of an aggressive change in sentiment as when all the stocks advancing are doing so on increased volume. The problem with this is you can only really use it for the daily moves as far as I am aware of as it is more difficult to track volume on a weekly, monthly and quarterly basis.
If you enjoy the content at iBankCoin, please follow us on Twitter