Since the “breadth” indicators looks at the percentage bullish vs % bearish on multiple time frames and uses multiple ways to look at breadth it is VERY rare that you see the overall average ratings outside of the normal range of say 40% to 60%.

The highest I’ve seen it to compare the opposite was 74.6% on July 3rd. That created a meaningful upper range of the S&P and practically top picked the Russel just in time one last day before the major selloff, from which we have sold off over 10% as of today. The opposite reading would effectively be 25.4% on the bearish side. Instead we currently have a rating under 20% for the first time since I’ve been watching this in April and (semi) actively tracking since late June.
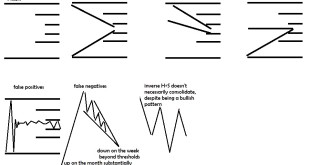
Many students of breadth will tell you to wait for a “breadth thrust” or dramatic and significant flip FROM oversold or overbought levels as you then have the change in sentiment which triggers shorts to chase from oversold and sellers to pile on from overbought. You also can potentially look for leadership to emerge which can be evident from the larger of the two numbers on any time frame acting more bullish than the lesser of the two numbers. However, you can also look at the opposite process of trying to dollar cost average or scale in/out as well. You might use it as a signal to transfer money to more aggressively buy the rare historic event. Of course, it is worth mentioning that bull markets tend to remain overbought for quite some time and bear markets can remain oversold for some time. Nevertheless, this type of substantial selling could represent ultimate discouragement lows…. Ultimately the trick is putting the breadth into context with sentiment and relevant context. That is difficult to do from a stale bull which has yet to receive public participation, but I am going to bet that this is a significant shakeout that has far reaching global implications like 1998 but one that is still in the context of credit expansion and a bullish business cycle with credit still remaining very loose. You could see huge ramifications from sanctions on russia, ebola, ISIS, global tensions and increased fear but you cannot reverse and manipulate the primary trend which I believe is still higher as you do not have confirmation in the S&P, Nasdaq and dow. The russel is concerning but markets don’t act in isolation forever. So while some say the russel is a (complex) head and shoulders breakdown (or double top), I say it is a head and shoulders FAKEOUT until proven otherwise.
Having the discipline to rotate capital into risk here is certainly not easy however… particularly leveraged option buying strategies which tend to capitalize off of low volatility when the volatility is high. That makes this a bit more challenging, but there is still a good roadmap of which stocks to focus on in AHwOA and I believe the opportunity is also good for buying TNA and XIV
| The moves are adjusted for the amount that would erase a move. For example 100% movers corresponds to 100% up movers vs 50% down movers since a 50% down move following a 100% up move would bring you back to even. A 150% move up corresponds to 60% decline. 10% up = 9.0909% down. etc |