Volume profiles provide objective support/resistance levels that can measure points of possible future orders, with the psychology of whether or not we are above or below the price often determining who’s in control.
Lets take a look at a hypothetical volume profile and what zones of price mean for the stock.
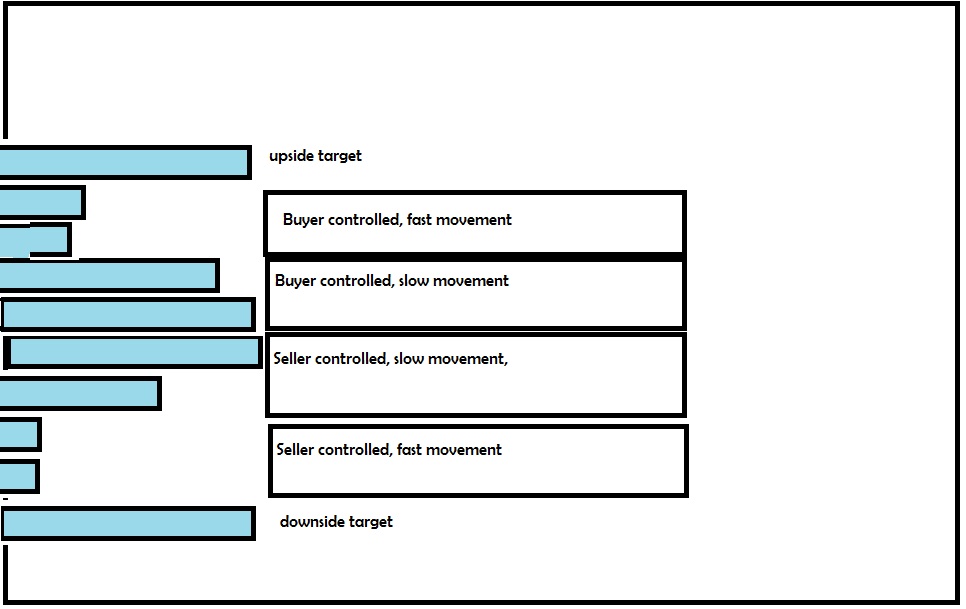
The upside target could also represent a selling point should prices draw near, as a move lower could re-enter the fast zone and enter “price discovery lower” until there’s more substantial orders coming in where support can be found. Similarly, the downside target could represent a buying point as a move higher would re-enter the fast zone and enter “price discovery higher”.
One of the key reasons these levels measure as good locations is there’s a clear risk and reward in which the reward outweighs the risk.
As a market gets closer and closer to a support/resistance level, the risk you take lessens, assuming your stop is a particular point beyond support/resistance and your target remains the next point of control. As such, assuming the same probability of outcome, your edge actually increases.
This is the one type of pattern in which you could actually add to a losing position, provided you still maintain the same stop.
This is supported by mathematics as you will see on a kelly criterion calculator.
Say for example, you have $5 of upside, $25 of downside. We can simplify this to a risk of 1 and a reward of 5 or a payout of 5:1. If we assume 40% chance of a “win”, we can use a kelly criterion calculator to get an expected gain on an equal risk basis.
http://www.albionresearch.com/kelly/
-According to the Kelly criterion your optimal bet is about 28% of your capital
-Your fortune will grow, on average, by about 15.31% on each bet.
Now let’s say the 5:1 payout changes as the price advances closer to your stop. Offering $3 risk to $27 reward or 9 to 1. If the odds stay the same at 40%,
-According to the Kelly criterion your optimal bet is about 33.33% of your capital.
-Your fortune will grow, on average, by about 31.12% on each bet.
Note: the position size can increase by about 20%, and over an infinite time horizon maintains the measurement of portfolio risk measured in this case as “one full kelly bet”.
Now let’s say the stock moves to the stop. I would suggest using a full ATR as the “risk” if you are placing the trade that day, even if you intend on closing out the trade if it doesn’t close above the stop. Let’s say this is a risk of $1 to $29 reward or 29:1. We have to at least adjust the odds of a win slightly since the order will stop out for a small loss at least a bit more often. But for the sake of demonstration, in this case we’ll say it won’t.
You can now risk 37.93% of your capital or about 35% more than the initial 28% position to reach one full kelly of risk. Assumptions are made incorrectly all the time. The infinite time horizon is an absurd assumption, as is the assumption baked into the kelly criterion of 100% volatility tolerance, as is the assumption of a perfectly, fixed, known edge. But these assumptions can still allow us to draw conclusions.
We can use this as a means for comparison and to draw some objective lessons. If you are increasing your portfolio size substantially (double and triple) because your edge improves, you are probably either under doing the first bet, or over doing the 2nd and 3rd, or both. If you are pyramiding higher position sizes, that certainly may make sense if the probability of the asset going higher outweighs the shifting risk/reward and/or if you have an undefined upside target that expands based upon the strength of the breakout.
Also, if you are adding to a loser, you still need a clearly defined exit that shouldn’t change just because you’ve lowered your cost basis.
Additionally, adding lower and reducing higher is best for entire asset classes where you are either maintaining set allocations or changing the allocations based upon the relative edge against all other alternatives on a risk adjusted basis (including cash and adjusting for personal risk tolerance). If you increase a stock ETF lower, you have very little risk that the entire market will make a huge overnight move, whereas stocks are at greater risk of gapping substantially up or down as well as far greater risk of going to zero. Even though you are setting clear stops, either that overnight risk should be reflected in your position size, or you should only consider this tactic when buying asset classes or broad funds.
So how does edge influence position size? Slightly. The difference from 0% allocation to some allocation is infinite, so there are instances where a slight change in edge from negative, zero, or a very small edge to a more significant one can make a huge difference.. but if you are talking about a single setup developing, that difference is probably going to have less impact than most people would position for.
The more complex question of how one should change overall allocations as an outlook ranges from very bullish to very bearish to everything in between is a more difficult one to answer, particularly when we are talking about multiple trades held simultaneously and at overlapping intervals of time. There are other aspects of game theory that could help answer this question perhaps.
It would depend upon holding period which would depend upon fees and market’s tendency to trend and the edge and magnitude of that edge. Nevertheless, with all things equal, a portfolio should allocate according to the probability of outperformance in the asset class, with additional capital tied towards “risk off” and cash related allocation as a person’s tolerance for risk decreases.
In other words, if it was simply between cash and stock, 50% stock would represent 50/50 chance of market up or down. If not for additional risks of margin 50% short stock and 50% cash would be acceptable as well. 80% chance would represent 80% chance of a rally, and 20% of decline of equal amount (adjusted for risk which actually would suggest holding more than 20% cash due to costs from volatility). the inflection point of 50/50 would actually shift towards shorts, but assuming shorting isn’t worth the additional risk, 80% cash and 20% stock would represent 20% chance of stock outperformance.
Your holding period makes a huge difference. For example, say there’s a 52% chance of the market going up on a given day… what’s the odds of the market finishing with more days up than down on a given year?
It turns out to be around a 72.5% chance that there are more up days than down. So a strategy that would rebalance yearly would theoretically have to be positioned much more aggressively bullish than one that rebalances daily if you assume a bull market or slight bias higher each day.
——————
One final note: If you are aiming for targeted allocations using options, you have to also understand that a small movement in price can change the dollar amount allocated towards bullish ideas or bearish ideas substantially. So this is where finding a new bet or doubling down may make some sense, but it’s to maintain targets, or slightly increase them with your edge, not to drastically change them.
If you own 10% call options and 10% put options a small move upwards in the market can easily cause the balance to change to say 25% call options and 4% put options. This is where adding to a broad market hedge and/or holding broad market calls can be helpful in allowing you to quickly restore the balance of your intended allocation without selling individual positions short of their target or before your system dictates that you should, without having inconsistencies and over exposure to directional bias, beyond what you intend.
If you want to have 10% calls and 5% puts, mostly short dated options and the market moves, you now might have 20% calls and 2% puts. If you use index options on the dominant direction, you can quickly take off an IWM call and reverse it with an IWM put or find a put of something relatively correlated to the market (higher than .5) and have something like 15% call and 7.5% puts. This isn’t perfect, but it helps you stay a lot closer to your targets.
There is a substantial cost over time in paying additional premium for assets that perhaps have a lower edge just to normalize some of your volatility, ut it can be measured against the benefit of reducing the risk and even if you can break even on this tactic, if it normalizes your exposure you can see similar returns with lower drawdowns.
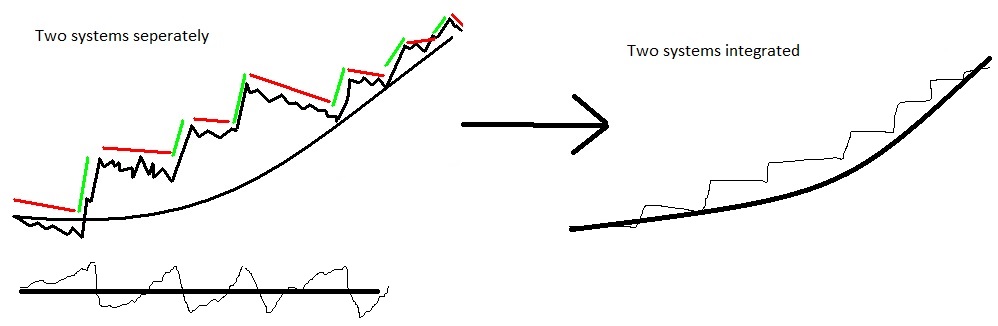
Keeping somewhat inversely correlated assets or low correlated assets can provide a substantial benefit, even if neither system is better than the other, or even if one system is break even as can be illustrated below.
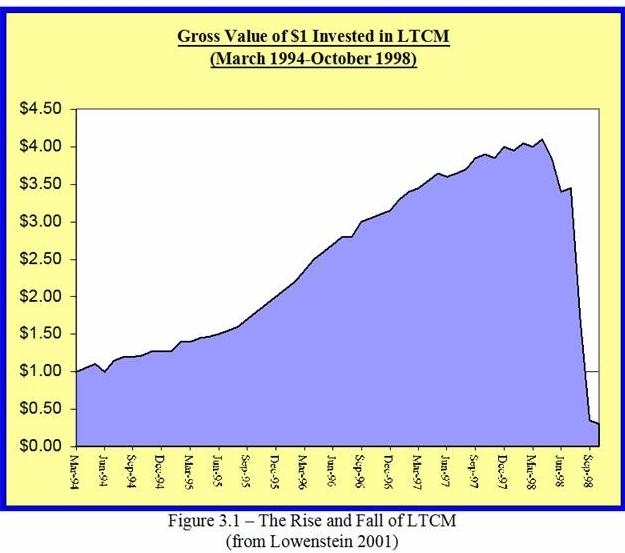
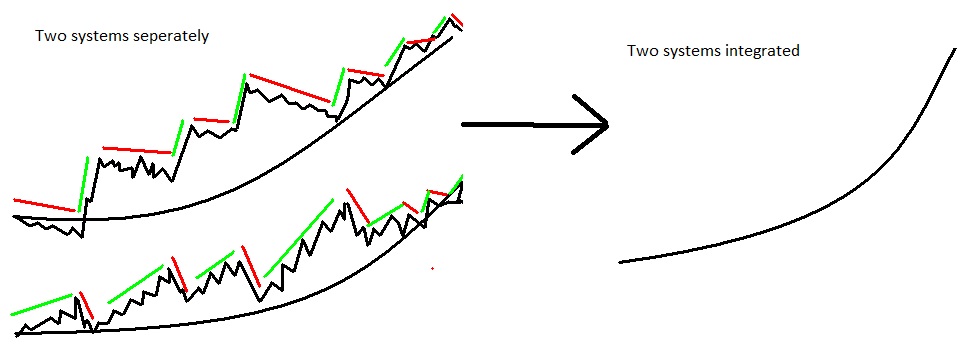 Hypothetically, even a slightly unprofitable system that can virtually eliminate or substantially mitigate all risk of drawdowns can improve your strategy, as you can simply leverage up and see higher returns with the same or lower drawdown. Long term capital management failed to stress test their portfolio against a long enough history that included major credit risks and bond market collapses and/or “black swan” type of events, and didn’t protect their portfolio against the unlimited loss, and they used assumptions about liquidity that weren’t true but if they were able to adjust for these things, they probably would have been able to accomplish a better risk/reward and eliminate the big blow up. It’s the margin risk and unlimited loss potential and lack of liquidity without adequate time provided to raise additional funds that ruined their strategy, not the soundness of the strategy itself or the math involved. They also tried to keep up with a historically very strong market with enormous leverage, rather than just accepting a very profitable system without trying to benchmark their gains to an underlying market.
If you enjoy the content at iBankCoin, please follow us on Twitter

