iBankCoin
I turn dials and fiddle with knobs to hone in on harmonic rotations
Joined Oct 26, 2011
4,121 Blog Posts

Jammed Up Indices and Ignoring Market Research

Monday evening when I finally stopped working well after 8pm, I did what any normal person would.  I ate a modest dinner.  I popped open a can of home grown heirloom tomato sauce and boiled water for my stringed noodles.  After such a red day, it only made sense to eat a red meal.  A friend stopped over and as we exchanged pleasantries my mind was clearly elsewhere because I wanted to review my trades.

Friend often expresses interest in the markets, although he lacks the capital to participate.  I had to show him the big seller, the whale I discussed Sunday night.  We went into the office and I started explaining all my charts, he had seen them before.  After a quick refresher on what each chart is displaying I began discussing “the seller”.

“I’m going to need two charts to explain this to you.  Actually three.  You know what, I actually need four.” I said.

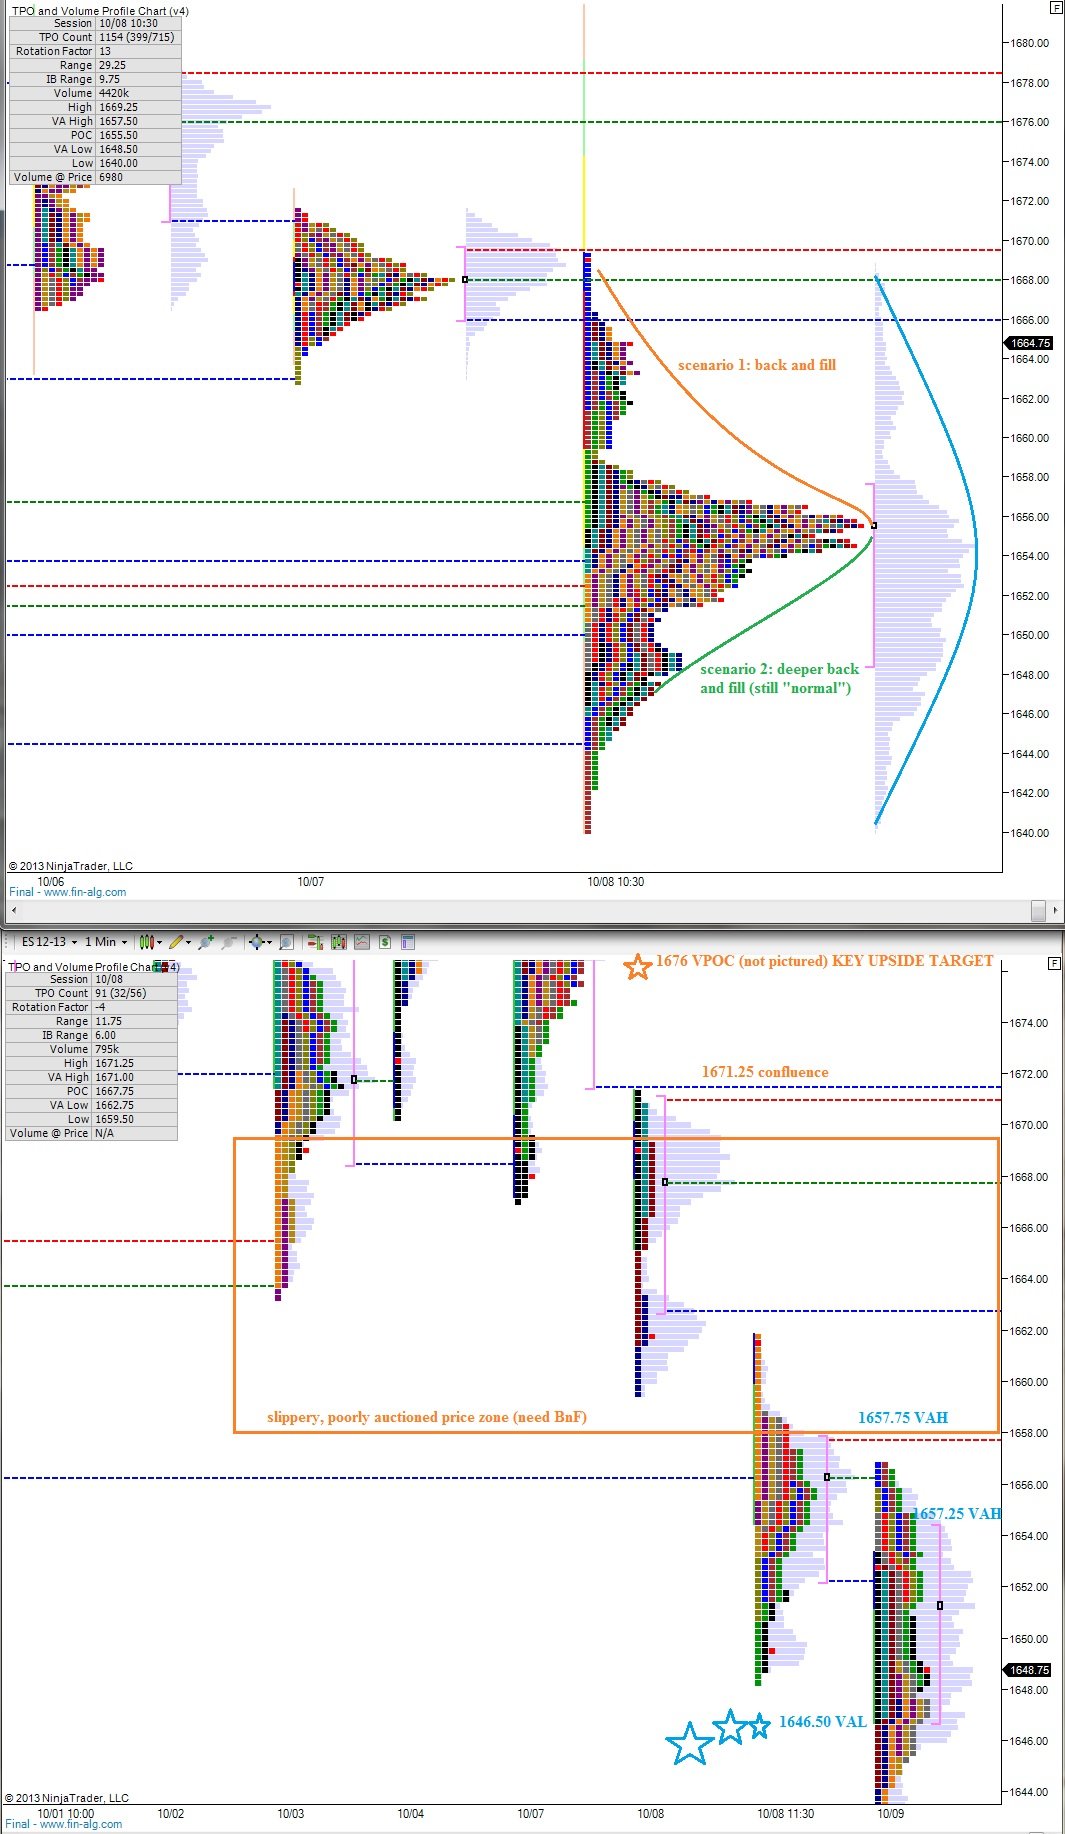
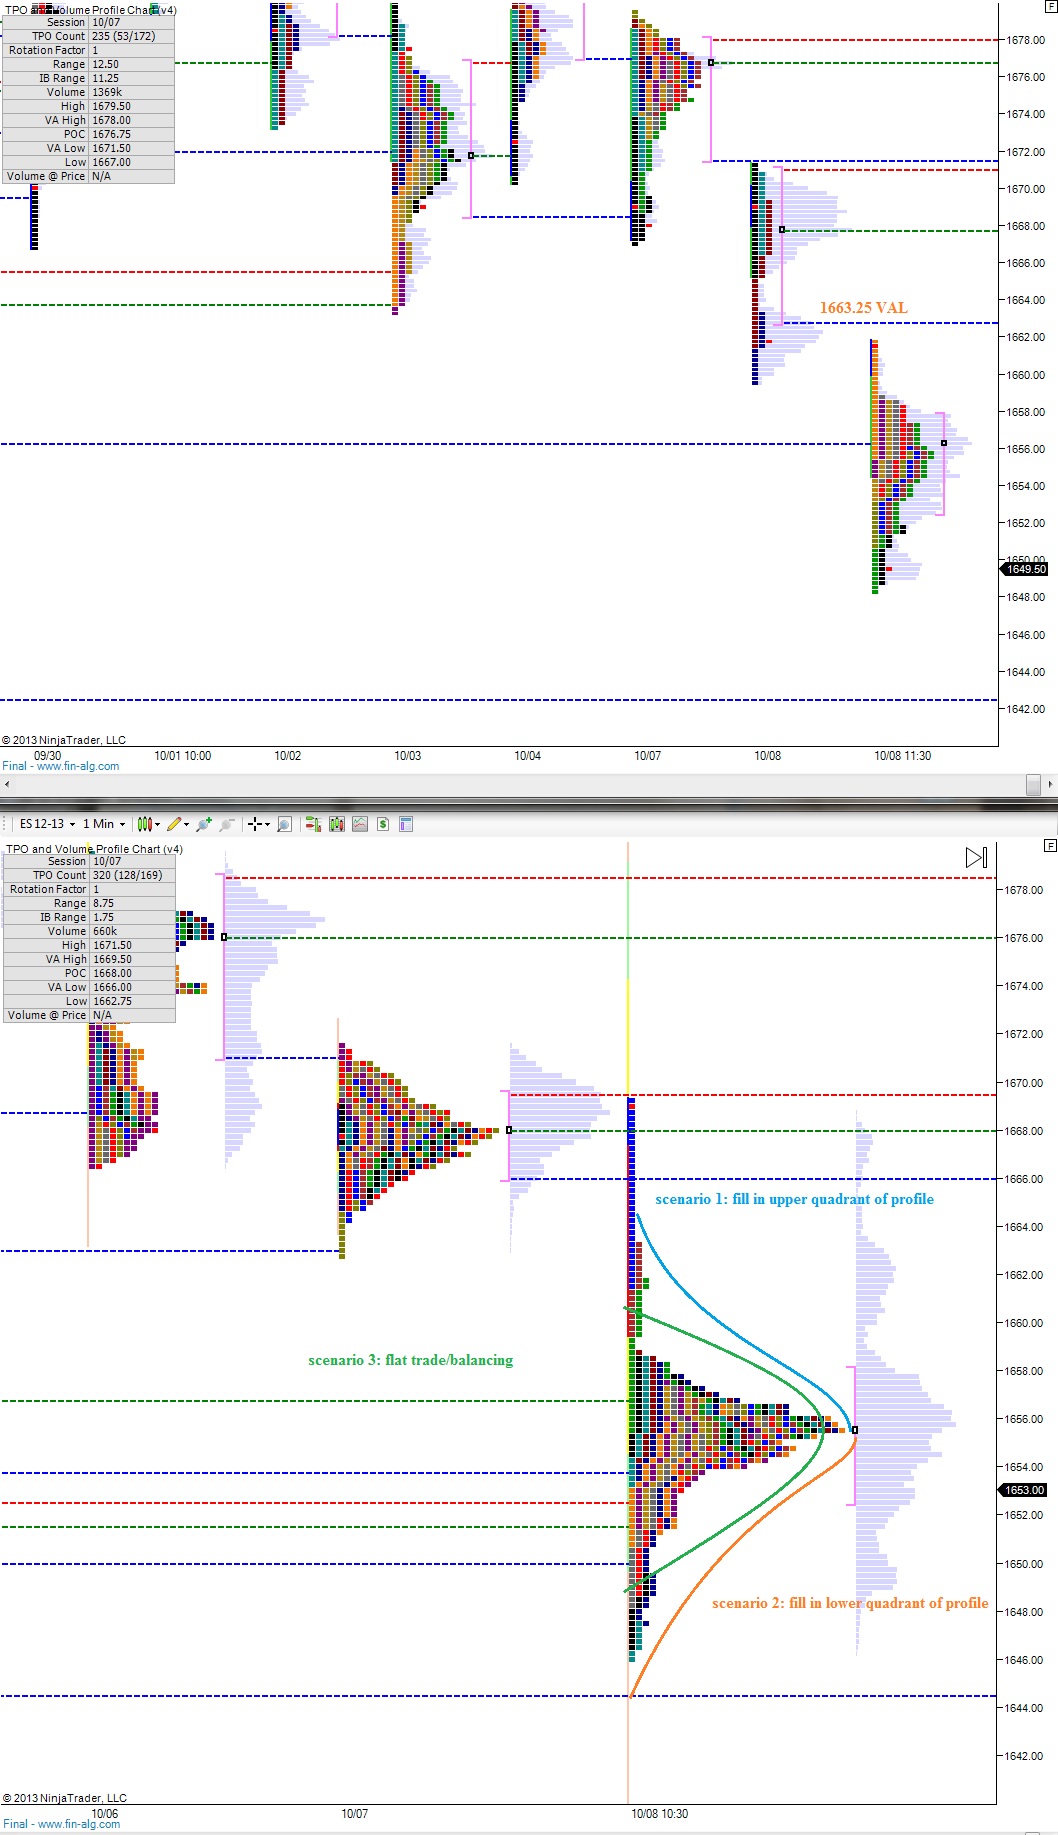
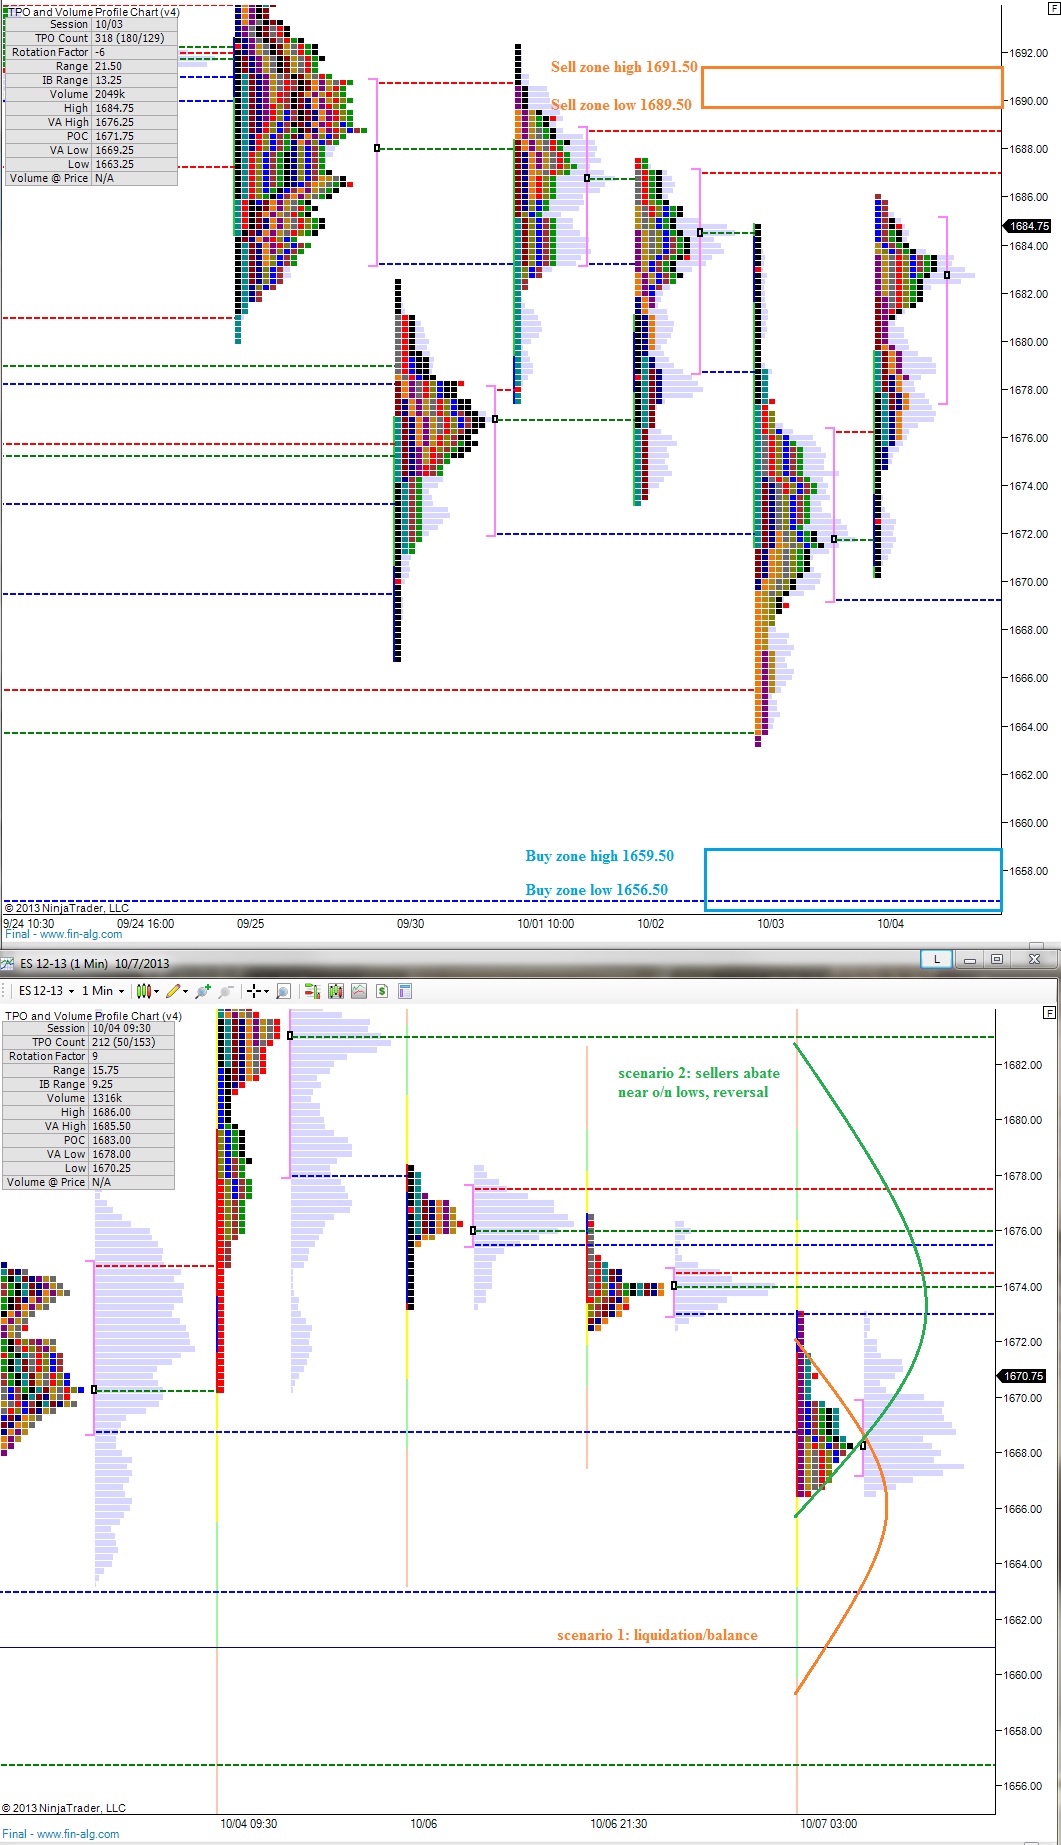
I had to laugh at this point because it already seemed overwhelming.  But I had to start with a weekly bar chart to explain how far we had come, then a daily bar chart to show where we were trading, then a market profile chart to describe Da Vinci’s brush, and finally an intraday bar chart with a delta sub chart to show the seller’s footprint.

Before I realized it, I had talked for over 40 minutes without much two way conversation.  I felt insane after, like a manic scientist or something.  He understood and it was kind of a rush to review everything.

Long story short, I said, “But most importantly we have to ask, what is the market most likely to do from here?”

My answer was the market looks weak…damn weak.  We are a bit over cooked on the downside, but this move is super long in tooth and we should be raising cash.  The government is a mess and people are getting nervous.

At this very moment I heard myself and said, “But in reality we should just ignore all everything, plug our noses and go long.”

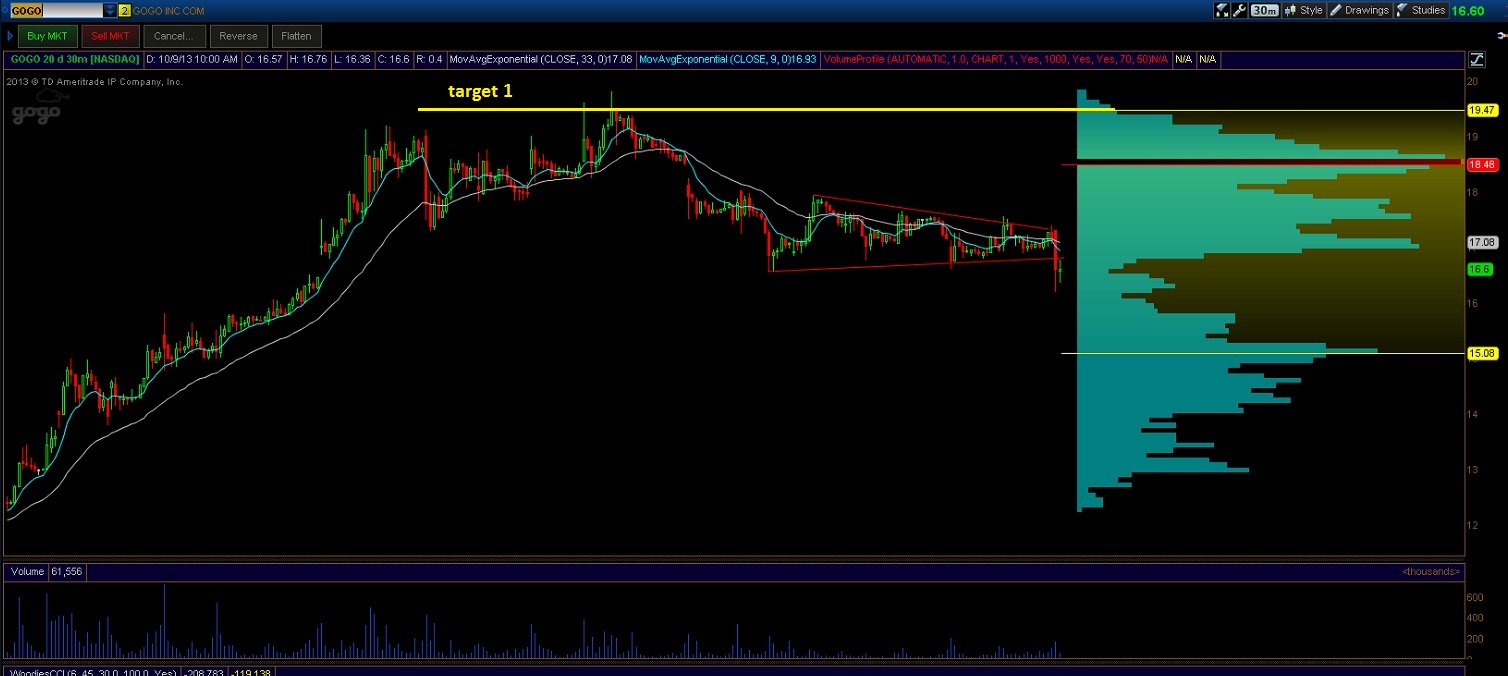
SO I BOUGHT INSTEAD, buying up GOGO and Z yesterday and GTAT today.

I don’t trust these indices here, but I am pressing longs in individual names until they tell me not to.  The robots got this one right so far.  CREE looks boss today, right?

More later

Comments »

Back and Fill P.2

We started seeing the early signs of balance forming yesterday which prompted us we are trading in a back-and-fill environment.  The beauty of market profile is the same as your favorite swimsuit super model—symmetry.  Nature has the fascinating ability to form near-perfect symmetry everywhere from plants to galaxies.

So when we began observing an incomplete, but early forming balance (read symmetrical bell curve) we had a contextual cake to begin baking.  We saw a fantastic distribution forming last week too after the selloff.  What is important when building these concepts is not only anticipating its formation, but also watching how the market behaves post formation.

Our last formation broke lower.  Perhaps this one will do the opposite.

On my bar chart, I again see an inverse head and shoulder pattern.  It forms as follows:

Left shoulder – 10/08, 16:30 – 1647

Head – 10/09, 11:26 – 1640

Right shoulder – 10/09, 17:14 – 1647

Neck – 1657

MM target – 1674

Again, nature is offering us symmetry.  Does that guarantee we trade in a straight line to 1674?  Of course not, we are still backing and filling.  But the formation is in place and our second favorite mathematician  Fibonacci and our market profiles point to a major upside target of 1676 on the next rotation higher.

The market is attempting to establish value in a volatile environment.  A huge seller could come in and change all of this.  But sans large sell flow, by vision for today is backing and filling with an eventual attempt to rotate higher.

Note: A breakdown below 1646.50 could jeopardize this entire formation.  Caution if trade sustains below this level.

I have highlighted the forming distribution via a few scenarios and also important price levels on the following market profile charts:

ES_MarketProfile_10102013

Comments »

What Do All These Things Have in Common?

“An organ printer, an iPhone with airborne internet access, a real estate app, haptics, and LED light bulbs”

NOTHING!  Not quite.

They are all technologies that will make the coming years exponentially more kickass than 2013.  I hold stock in all of them via ONVO, GOGO, Z, IMMR, RVLT, and CREE respectively.   These are real companies adding value to society.  On the contrary, we have the god damned politicians and their media outlet mouth pieces.  There is no value being created by politics.

And I have no alternative to offer because I never follow politics.  Hell, I have antenna teevee and really only watch Jeopardy.  Therefore I don’t talk politics.  There, I said it.  I know it is ignorant and I cannot care.  I have too much business to tend to.

I was a buyer of stocks today.  I am siding with the robots.  I cut my twitter exposure down to the bear [sic] minimum.  It is too noisy.  My squiggly lines say buy for a quick hit of crack rock and then GTFO, therefore I am doing exactly that.

My slow money is still in place via F, O, LO, and USO

I have that stupid ass MJNA long too.

Cash 28%

Warm salutations,

Raul

Comments »

Better Suited for Robots

The index futures are trading all over the place, and I find myself trading well in the morning only to give back my gains come the afternoon.  I brought Elroi over to the /NQ with me this week because I need to keep my eye on the jackass in case he does something stupid—which he does from time to time because my coding skills are a bit…meh.

My algo loved today and had its best day ever.  However I sullied all of my morning discretionary profits and much of Elroi’s algorithmic profits by flip flopping in the chop.  80% of my trading errors occur when the market churns.  My exponential moving averages converge, my Keltner channel goes sideways, and price chops at like 1000 miles per hour.  And I go, “shorts have this, SELL SHORT on the breakdown.  OH FUCK it’s a fake out, COVER, here come the longs, FUCKIN’ BUY’EM UP, SLAAAMMMMM, back down.”  I used to do this a good 4 or five times before I snapped out of my insanity.  Now it takes two bad trades for me to realize I am a jackass and sit on my hands.

The problem is the market did that to me twice this afternoon.  Lol, I am leaving that sentence because it speaks volumes to my mistake.  The market did nothing to me, I only did these things to myself.  I review these conditions all the times.  I know to stay away.  In the morning, I do.  In the afternoon I loosen my focus a bit.  I will go through my trades and verify this tendency but I smell a “no afternoon” rule brewing up.


Here are Elroi’s trades:

Elroi_NQ

Comments »

RAUL BUY: $GOGO

Enough is enough, I’m calling seller’s bluff.  BOT $GOGO looking for the fakeout, breakout:

GOGO

Comments »

Back and Fill

The markets caught a bit of a bounce during the early evening hours of last night’s globex session from the Yellen news and perhaps also from the Alcoa earnings beat.

The move recaptured about eleven handles of yesterday’s downside before stalling out.  It appears not that aggressive sellers stalled the move, but instead that beleaguered buyers were not overly enthusiastic about the new developments.  As we approach US cash open, the market is seeing a bit of selling creep back onto the tape.

On the 24 hour profile, I see the early formations of balance which may induce some “back and fill” type trading.  However, on the bar charts, I am observing the early signs of an inverse head and shoulder pattern with an upside target of 1667.

The bar chart formation paired with the over reactive nature of yesterday’s trade suggest to my eye a mean revision-type bounce higher is more likely today.

Upside targets are 1660 then the measured move target of 1667 during today’s trade

I have highlighted these levels, a few other areas of opportunity, and also the back and fill scenarios on the following market profile charts:

ES_MarketProfile_10092013

Comments »

Big Win for The Seller

The market kicked into high gear this morning shortly after breaking down out of the consolidation we closely observed Sunday evening.

The idea was simple, and with it, I saved myself from the nauseating task of watching news which is centrally focused on politics.  Instead I could watch price and determine how to manage my portfolio accordingly.

When everything started breaking down early on I sold off all my shares in WLT, FB, AMBA, and BALT.  They were hard decisions to make because I didn’t want to sell any of them, but I knew there were major implications to that consolidation snap.  Also The Fly has been preparing us for a correction rather extensively.  After all of the selling my portfolio was bulked up with over 40% cash.

We are closing on the lows of the day after a high volume, large range selling candle.  Something tells me there will be better opportunities to buy soon and I want plenty of cash on hand.

The seller I was observing Sunday evening seemed big by how the orders were carried about—absorbing buy flow at the offer for a full day.  They just won big time and today’s tape is likely to embolden them.  Do not discount the bears at this junction.

At the same time keep your eyes on stocks that are trading in a microcosm.  Notice how financials aren’t as beaten down as tech.  That’s because they were dogs all last quarter.  We are nearing the time to consider another Goldman Sachs long.

Bottom line: stay cool and get out your shopping lists, but move slowly.

Top picks: CREE and RVLT, my two largest positions

http://youtu.be/JGrGwhoN0K8

Comments »

Value Migrating Down

The hard selling into the bell yesterday continued on into the early overnight hours.  The action was effective at breaking consolidating prices to the downside and testing recent lows.  We are seeing a bit of buy strength working into the market as the US comes online and it will be interesting to see how we handle it upon opening.

There is currently a gap in place below which could lend itself to a fill do to its close proximity to our current prices.  Should we then lose 1667 intraday, I believe that sets the stage for a leg lower.

Downside target continues to be the range from 1659.25 to 1657.00.  Should we see strength coming into the market, I will be looking for reactive selling first at 1676 then at 1690.  The sellers lose control over 1692.

The overnight profile suggests balance via printing a near-perfect bell curve.  The move away from here may start with a head fake and then price slashing through the entire range quickly.

I have highlighted a few scenarios and the migration of value on the following market profile charts:

ES_MarketProfile_10082013

Comments »

Raising Cash is Hard These Days

Sunday night Raul was brooding harder than Ryan Gosling in a New York City taxi cab.  The futures were lit aflame and it seemed almost certain I was due for an ole timey courrrection.  And it would make sense, because I am sashaying around these markets with impunity lately.  It is always a matter of when, not if, the market will sniff me out and drop a grand piano on my head.

Hey it happens—I won’t lie to you…truth serum is a perk of being anonymous.

But the grim reaper didn’t visit me this morning.  Instead a little bit of the Miley Cyrus trickled through the veins of the market and I had a green day (no dookie). 

The morning flowed, and after going on a seven trade winning streak in the /NQ_F I thought it respectful to make a sacrifice to the stock gods—so I sold off some RVLT over 4.

Don’t get up in arms now.  There is no need to revolt at this action.  RVLT ballooned last week to become almost 20% of my portfolio.  And I took that low floater into the weekend because I knew the move had more junk in the trunk.  When it fizzled today, I took off my bottom shares, the shares I bought down in the depths of hell, and booked them for over a 30% profit.

RVLT still remains my largest position but I did not want to start getting emotional over here so I took it to a size where I can stop pulling up the chart and a size I would consider riding though earnings.  Great company or not, you are a jackass to have 20% of your risk existence on an earning’s call.

It wasn’t long before I had a new home for the cash.  I piled it onto ONVO, making the position my third largest behind only RVLT and CREE.

ONVO 3d prints organs which is a total mind blow.  The chart is forming a tight consolidation which will blow shit up when it breaks.  My trade reviews show me I need big size on ASAP, so I can get my fat scale off while everyone else is still on the chase like I did AMBA last week.  Being up 6% on my ½ entry, it seemed imminent to buy more.

In short, the port is green, the /NQ trades more at my speed, and everything on the news is fake.

Congratulations to Howard Lindzon and the entire Stocktwits team for getting a CNBC’s John Melloy to take the reigns as CEO.  This is a huge blow to the financial news industry and no doubt speaks volumes to the decaying value at CNBC and the exponentially growing value of getting your news directly from traders.

Successful businesses aren’t the result of some magic voodoo.  They are the result of good decisions diligently executed one after another.  When presented with the right information, it does not take a genius to make good decisions.  Any of you would choose correctly given the best information.  And it is the people doing the work, day in and out, people like us folks on iBankCoin and Twitter, who know the business the best.  Not some stud on the teevee.

The investor class is realizing this, slowly.  Remember, when you venture to the internet for knowledge due diligence is paramount.  Follow “experts” for months and hold them accountable.  Don’t just follow some cowboy into a field of algo turrets.

And always demand more, more, MOAR!R

Comments »

Playing The Outside of The Field

This week I will be more actively trading the order flow in the /NQ contract.  However I still see an opportunity to trade the /ES, but my goal is to hone in on one good trade idea, a fade from the outside of the range, and only take one or two trades a day.

Last night I highlighted a consolidation formation occurring in the /ES and it has begun breaking down.  The primary support has not yet been taken out, but we are in a momentum environment where it looks vulnerable.  Although the move away from this consolidation will pack serious energy, I see an opportunity to fade the move, even if only for 2-3 handles.

I have highlighted that opportunity on the following market profile chart and also I highlighted a few possible scenarios on the second market profile chart below:

ES_MarketProfile_10072013

Comments »