iBankCoin
Home / Tag Archives: $SPX

Tag Archives: $SPX

I Think She Has One More Good Day in Her

We never truly can say what the market should do, nor can we impose our will upon the market.  We can however, through the lens of market profile with a side of auction theory, gauge the likelihood of continuation.  This is why they keep me around, these guys.

I probably would have started locking in longs like many of you if I stayed at my trading terminal, the most aggrandized name for my bossed up PC.  After all, what a pungent thrust, certainly it would be prudent to raise cash.  I pulled a PTJ and headed to the gym an hour before the bell to avoid the angst.

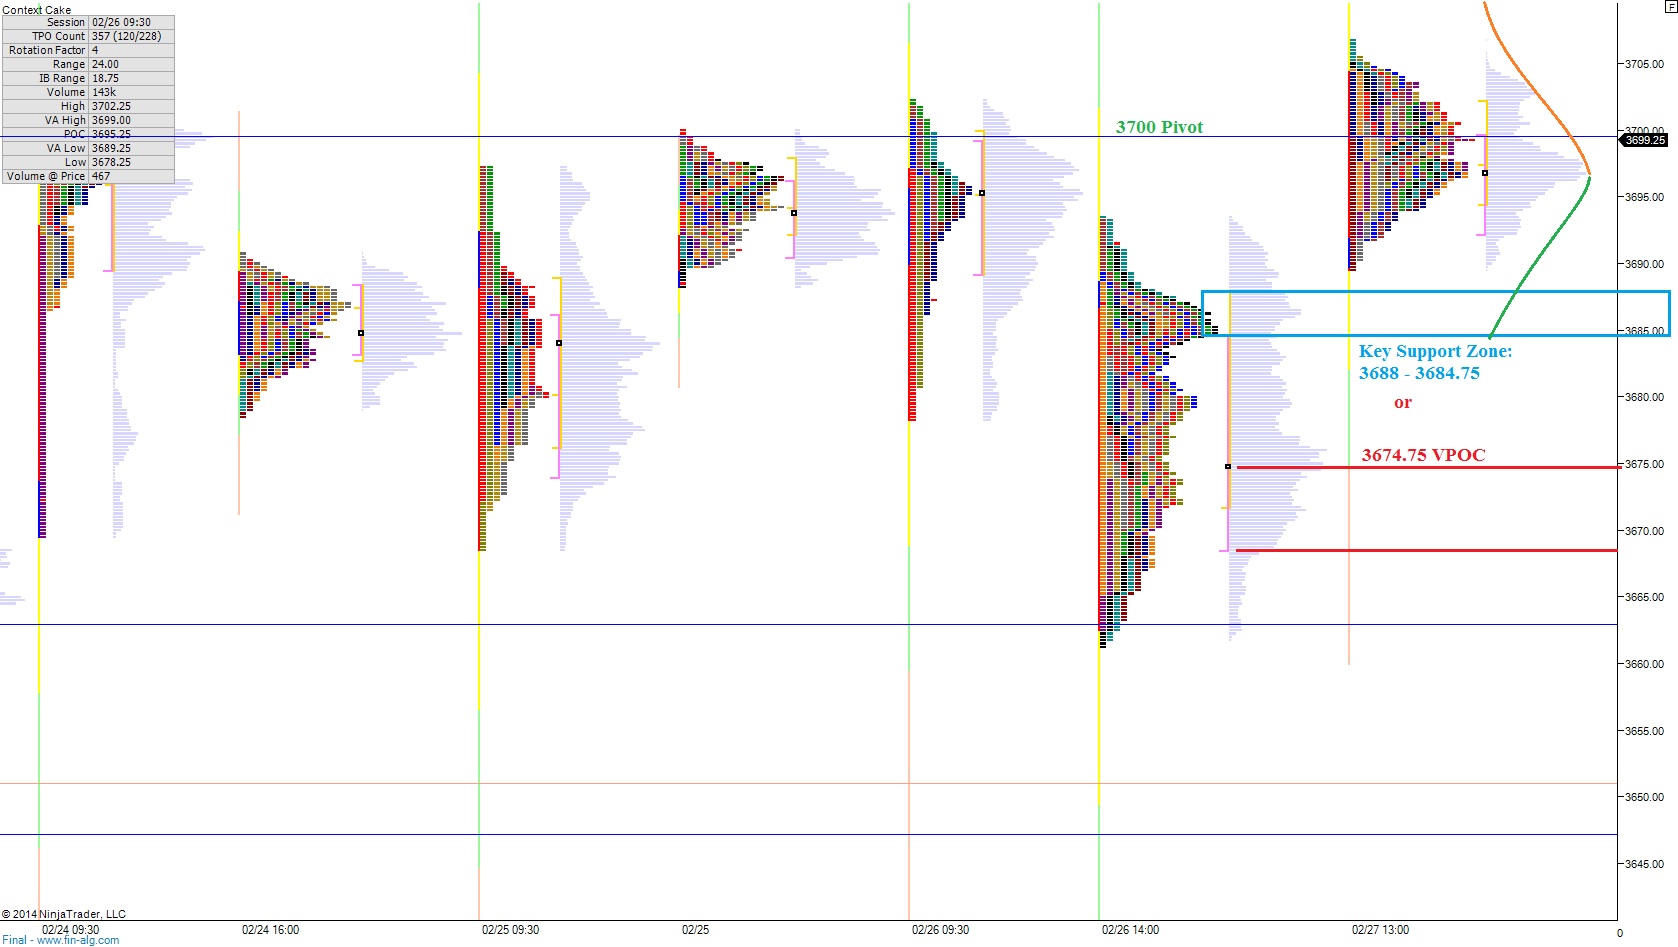
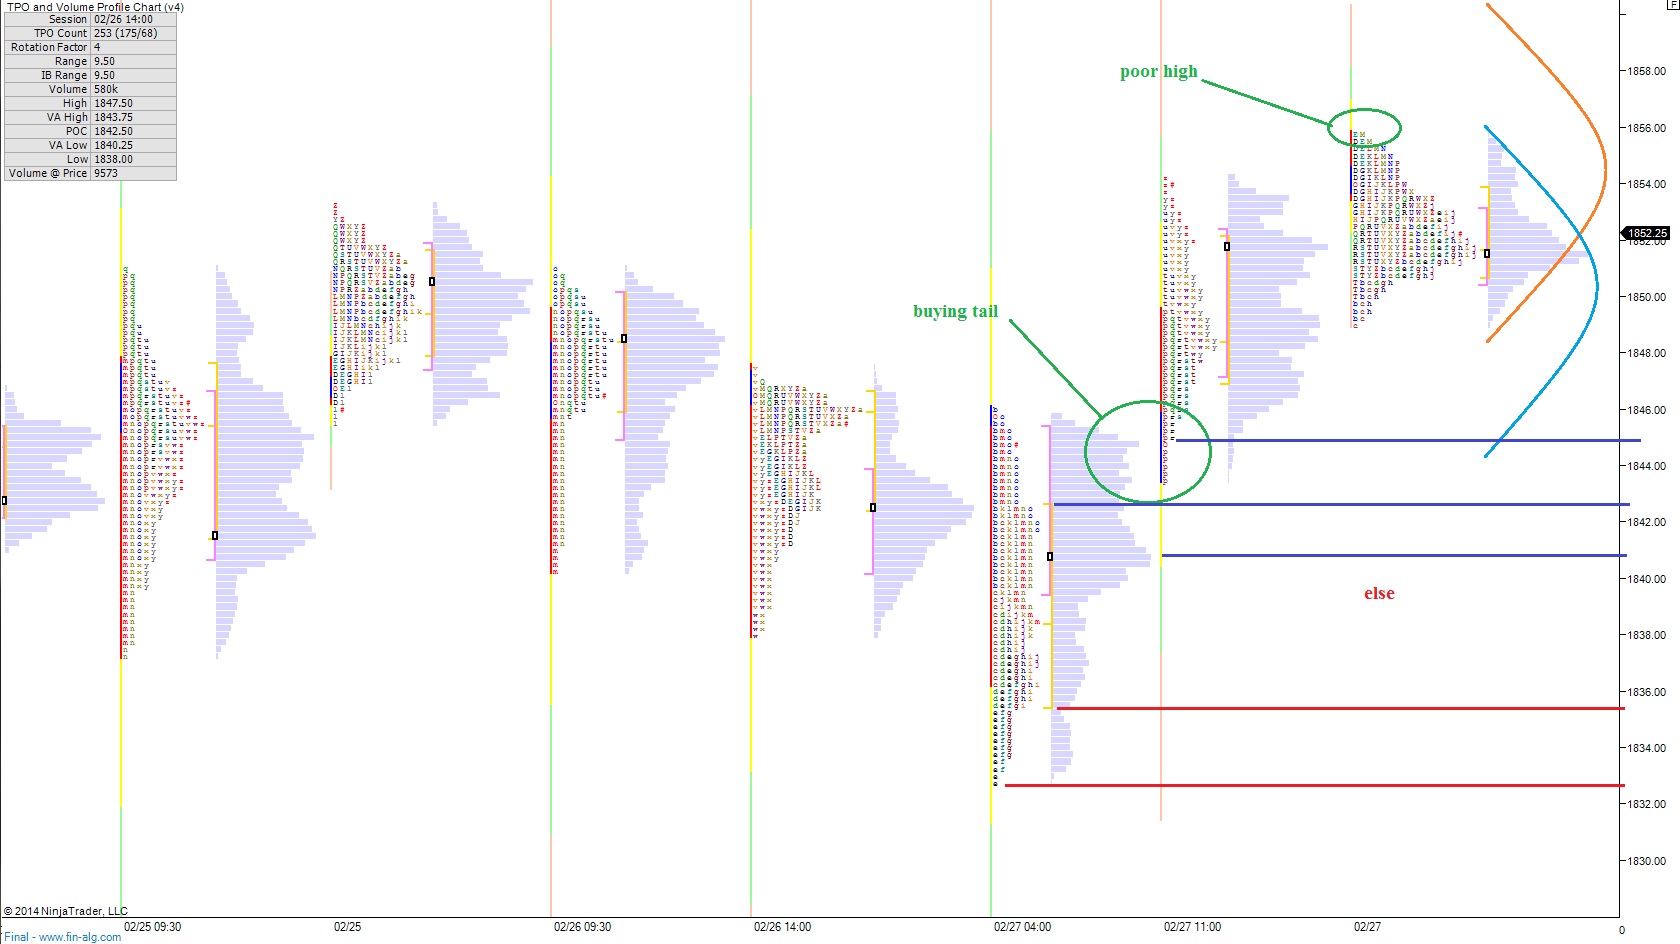
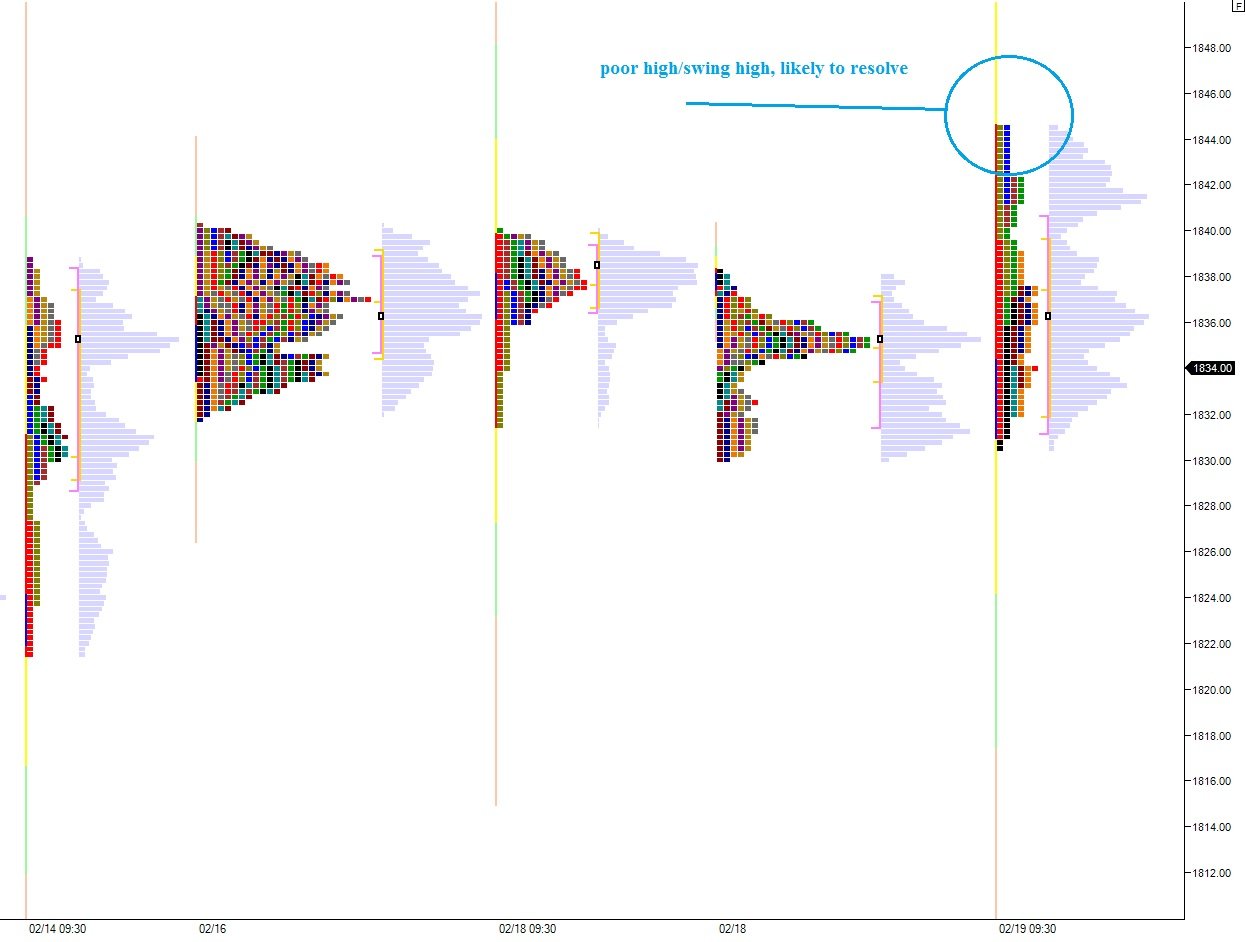
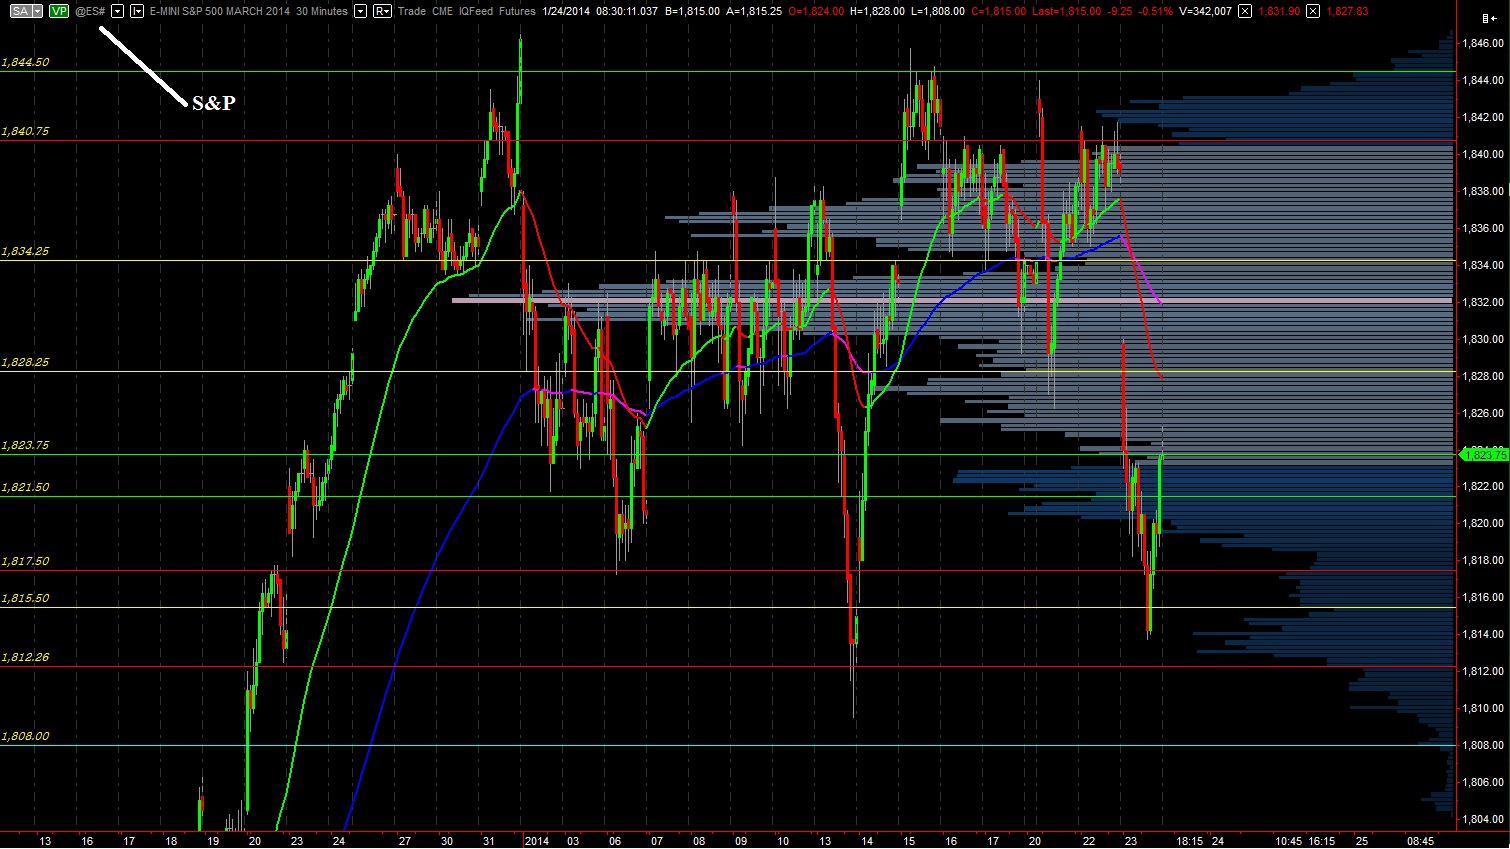
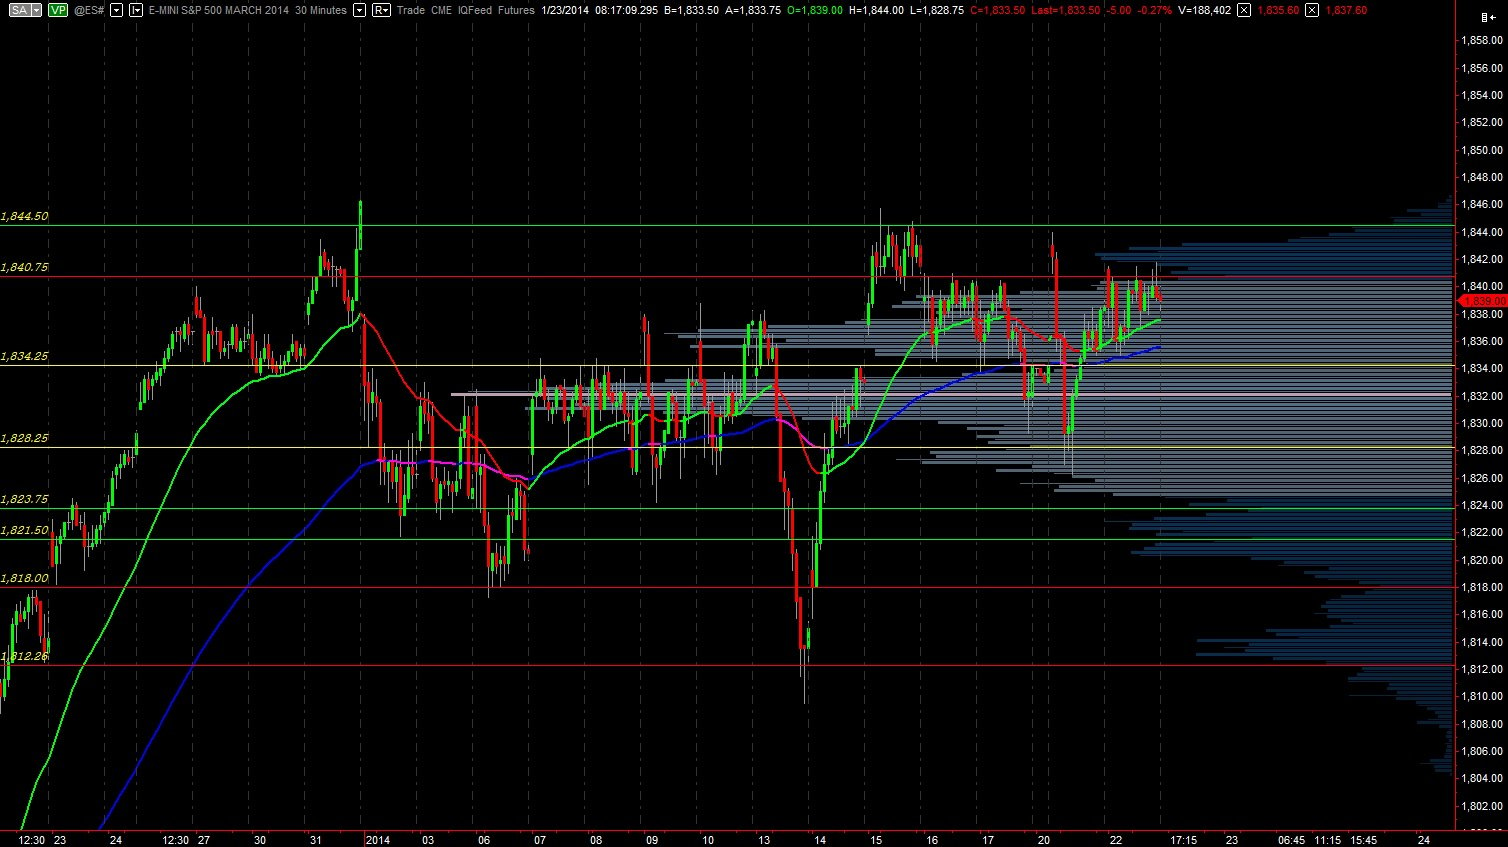
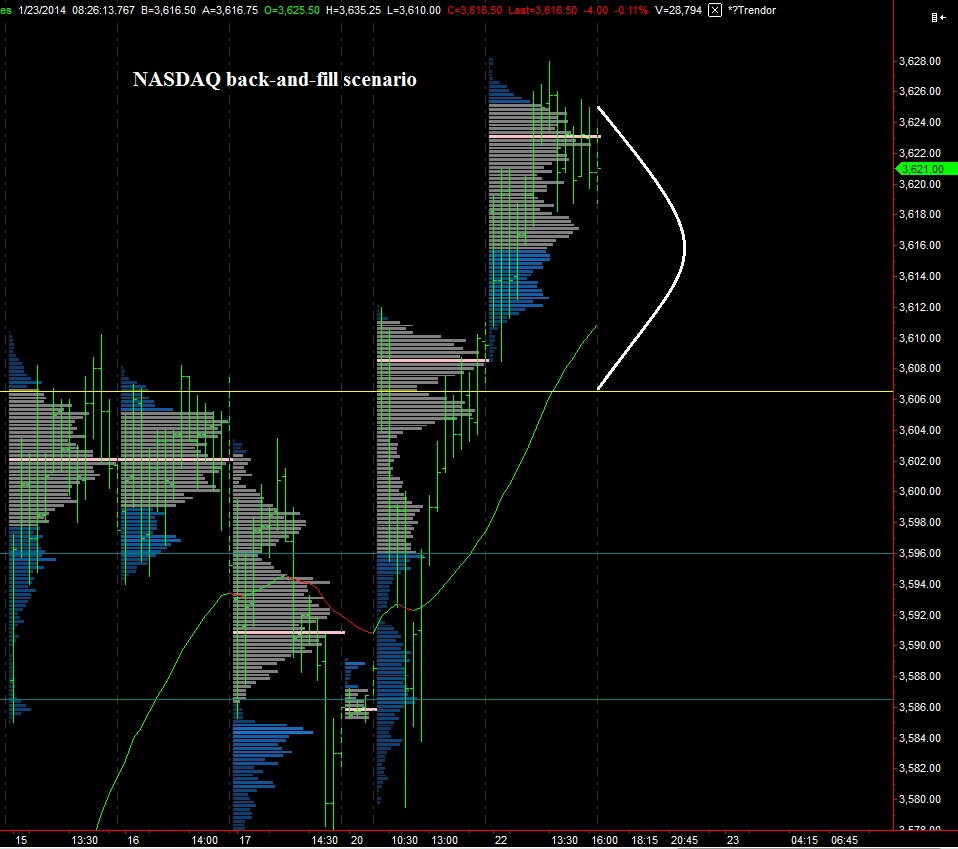
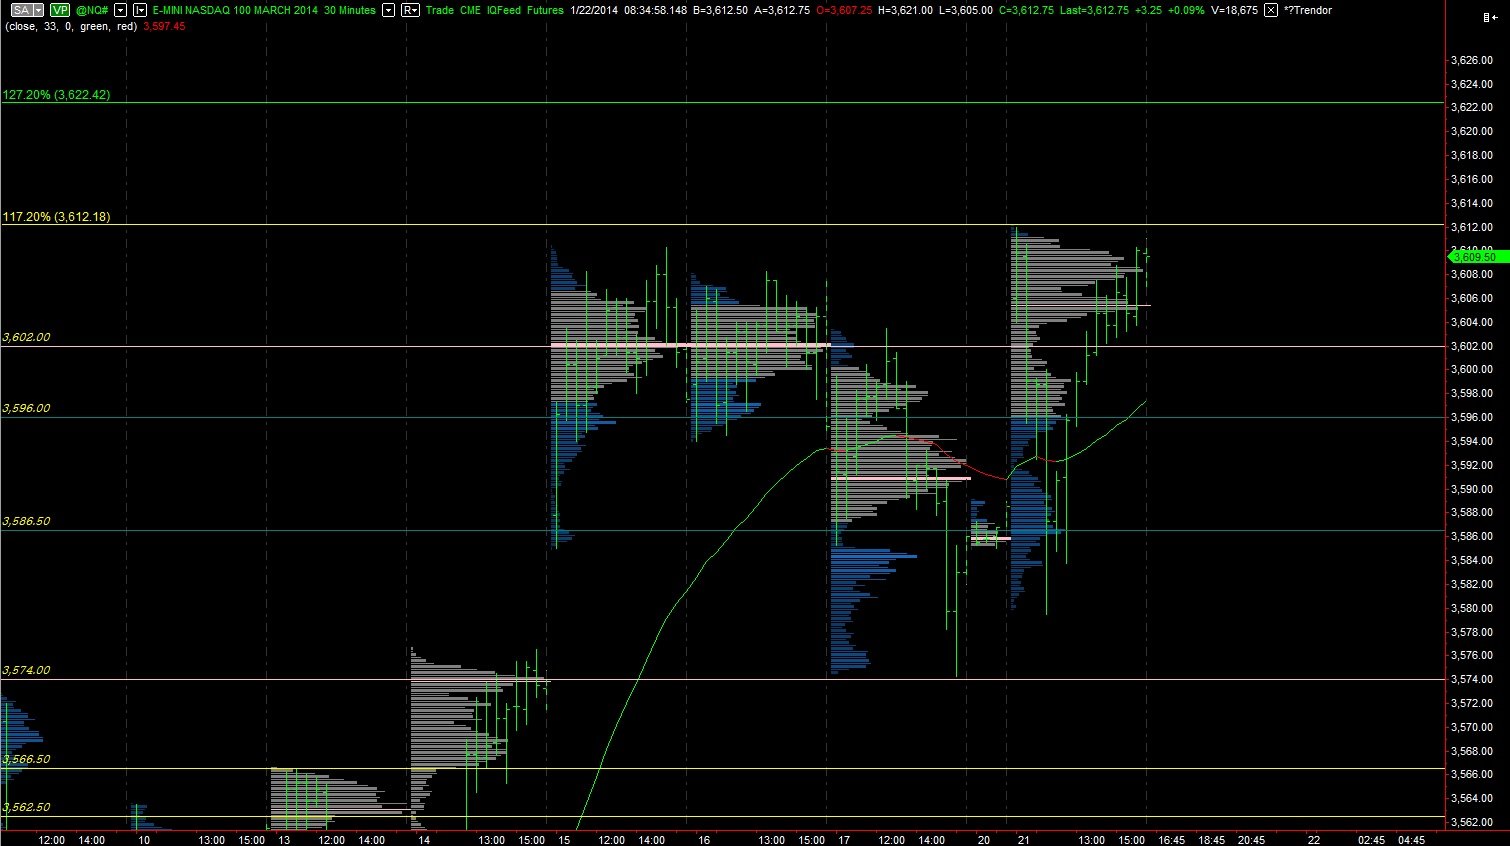
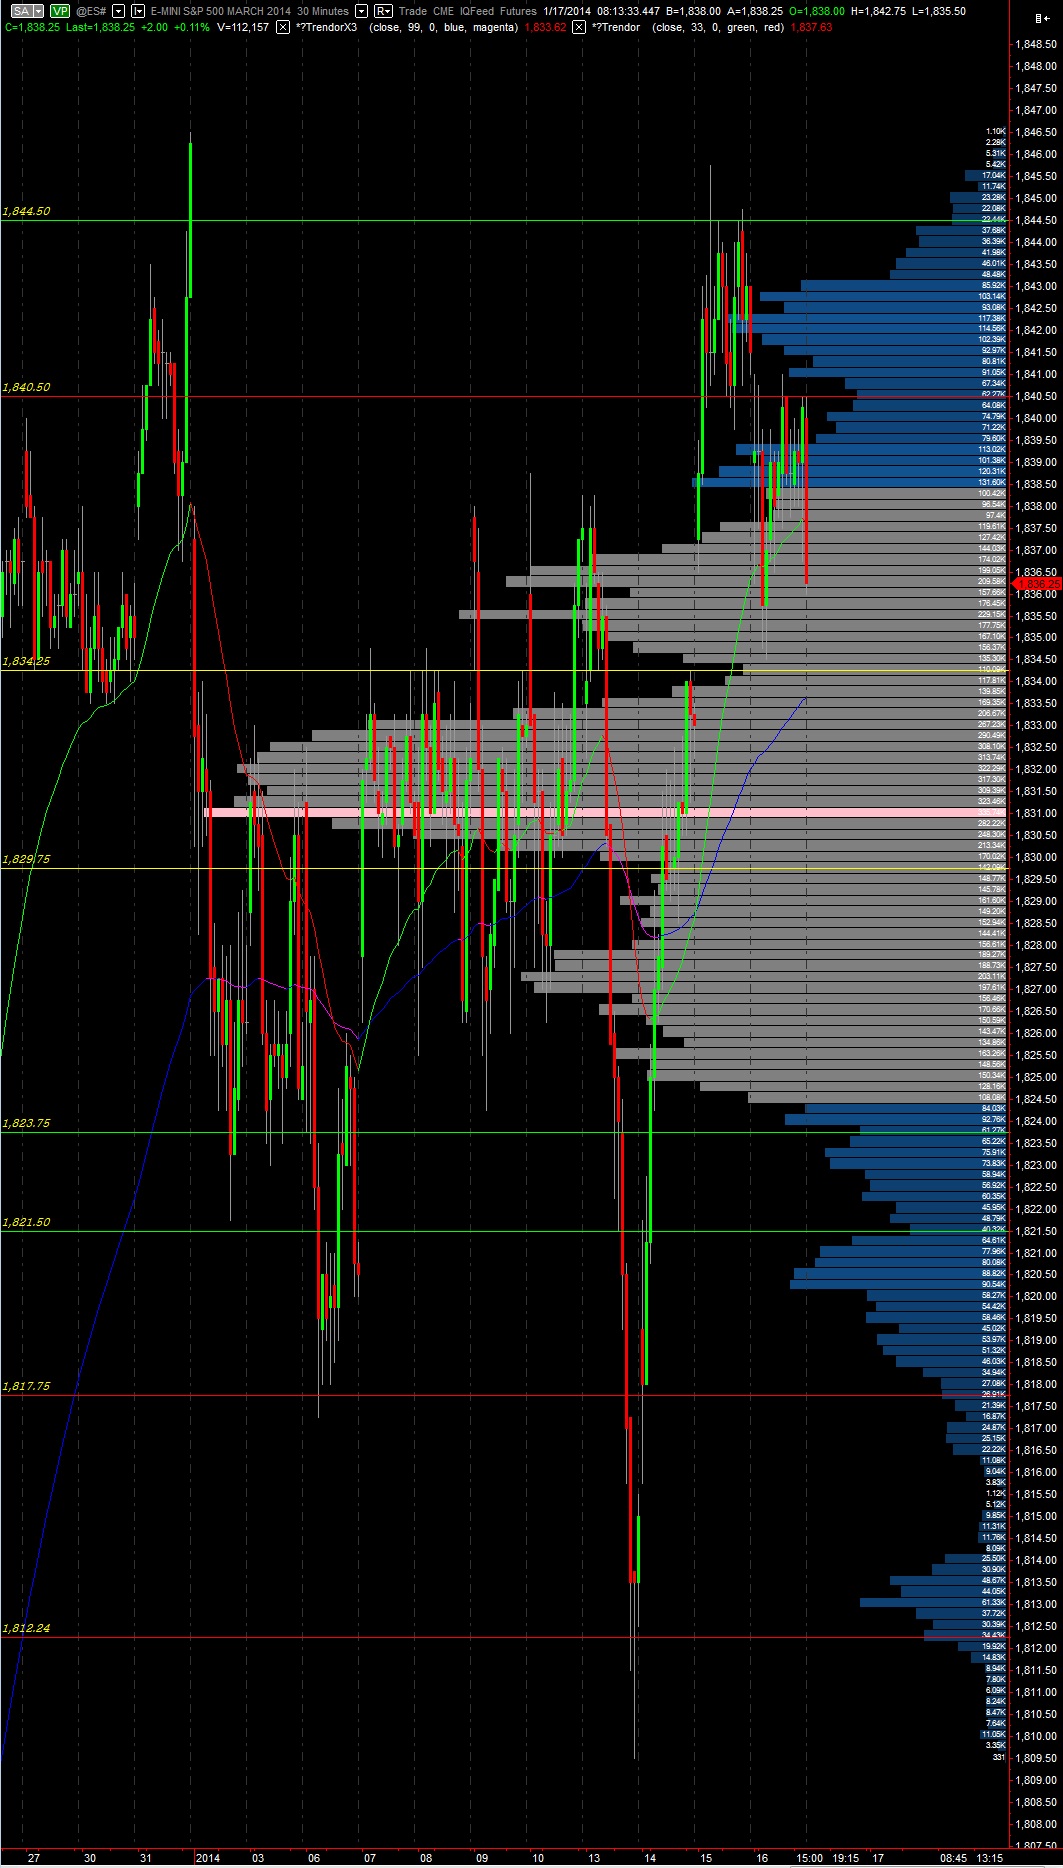
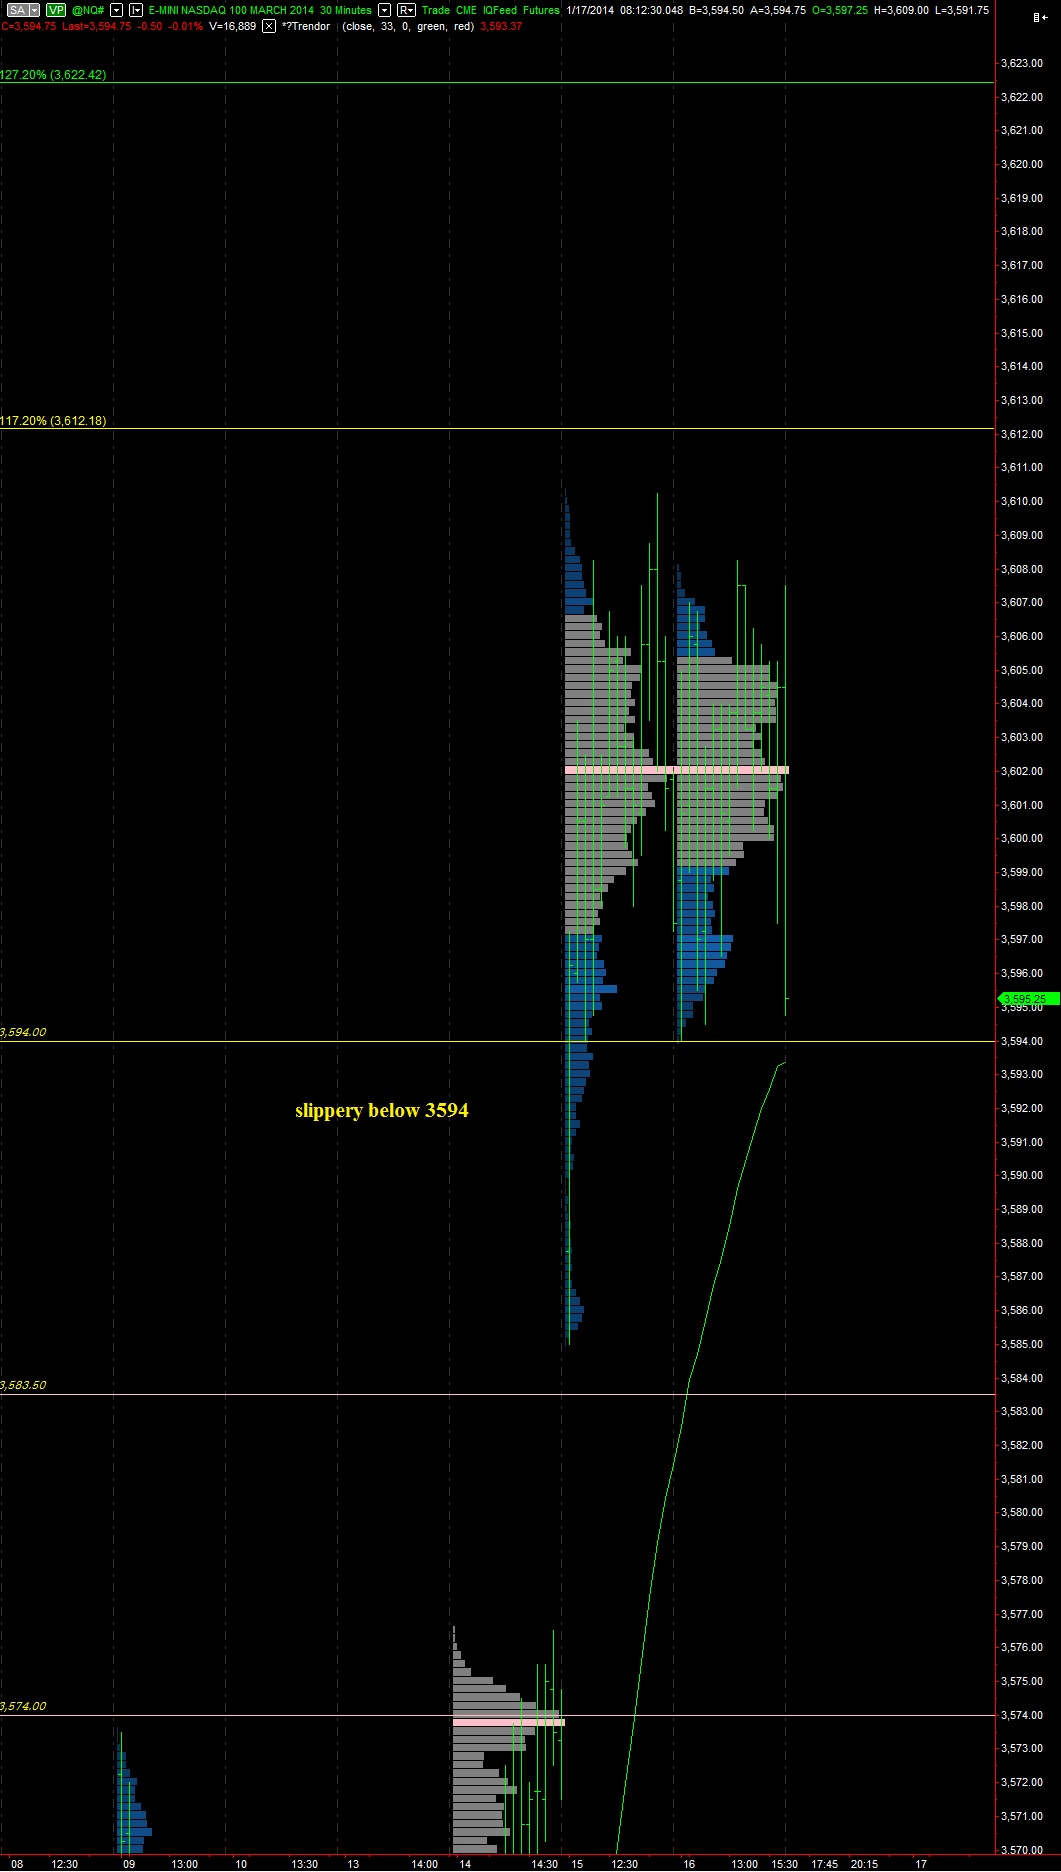
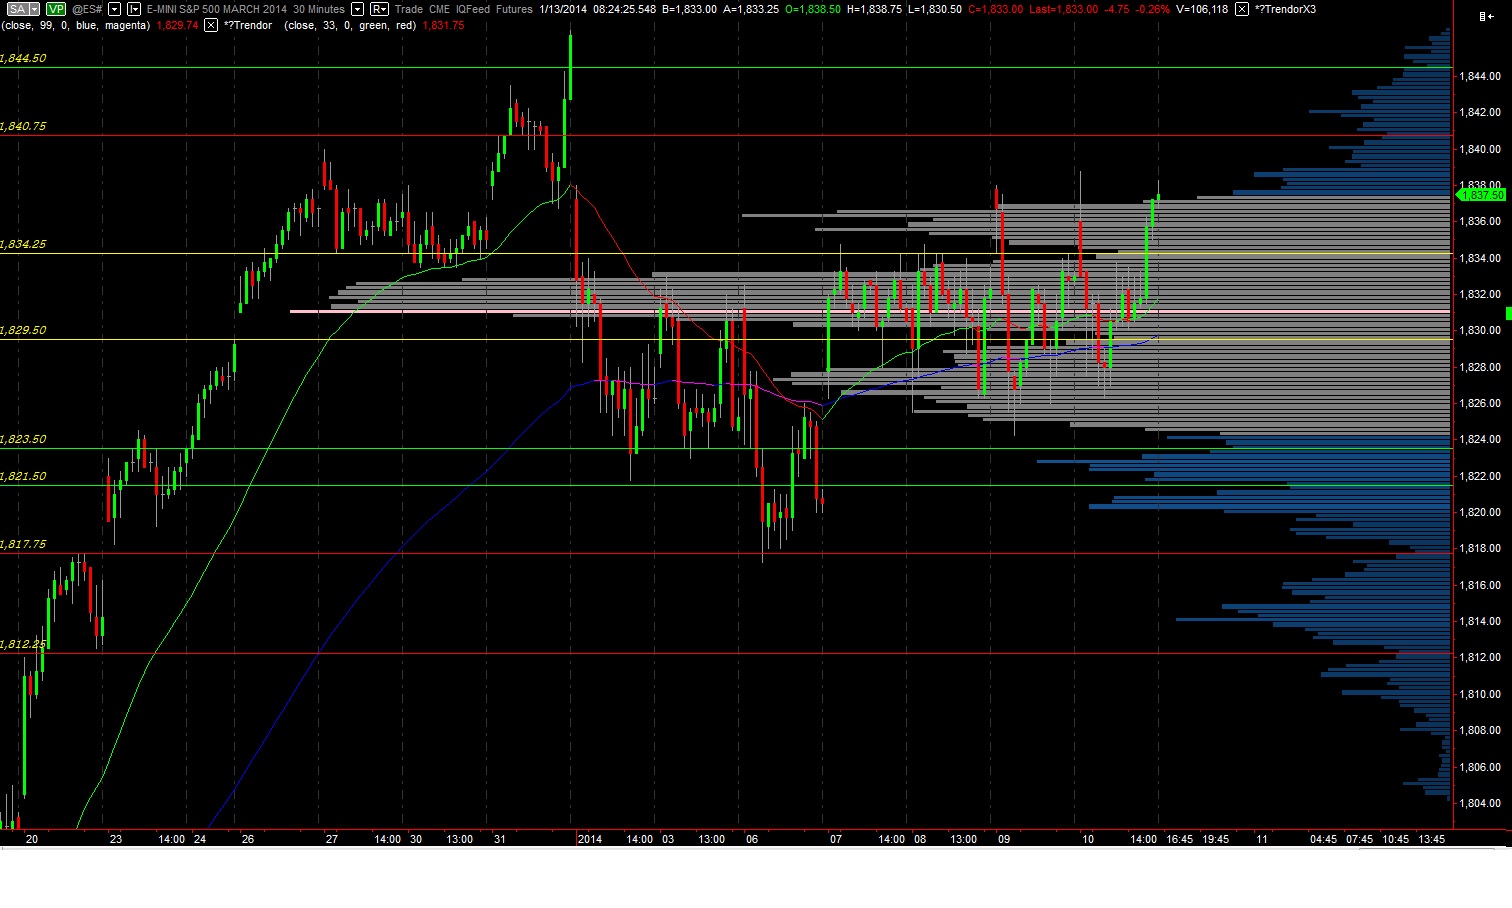
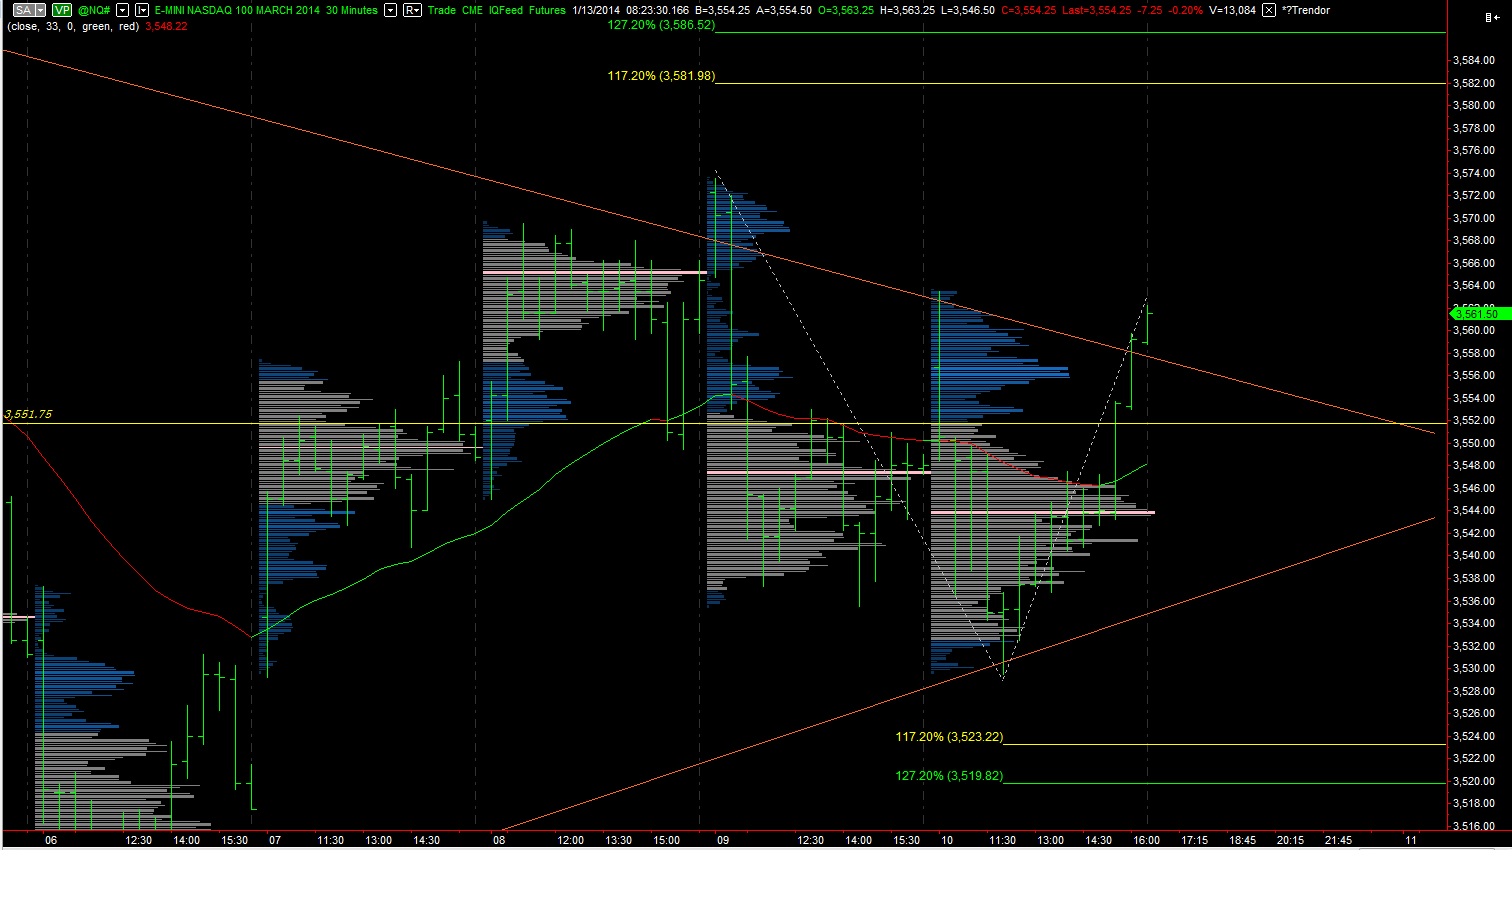
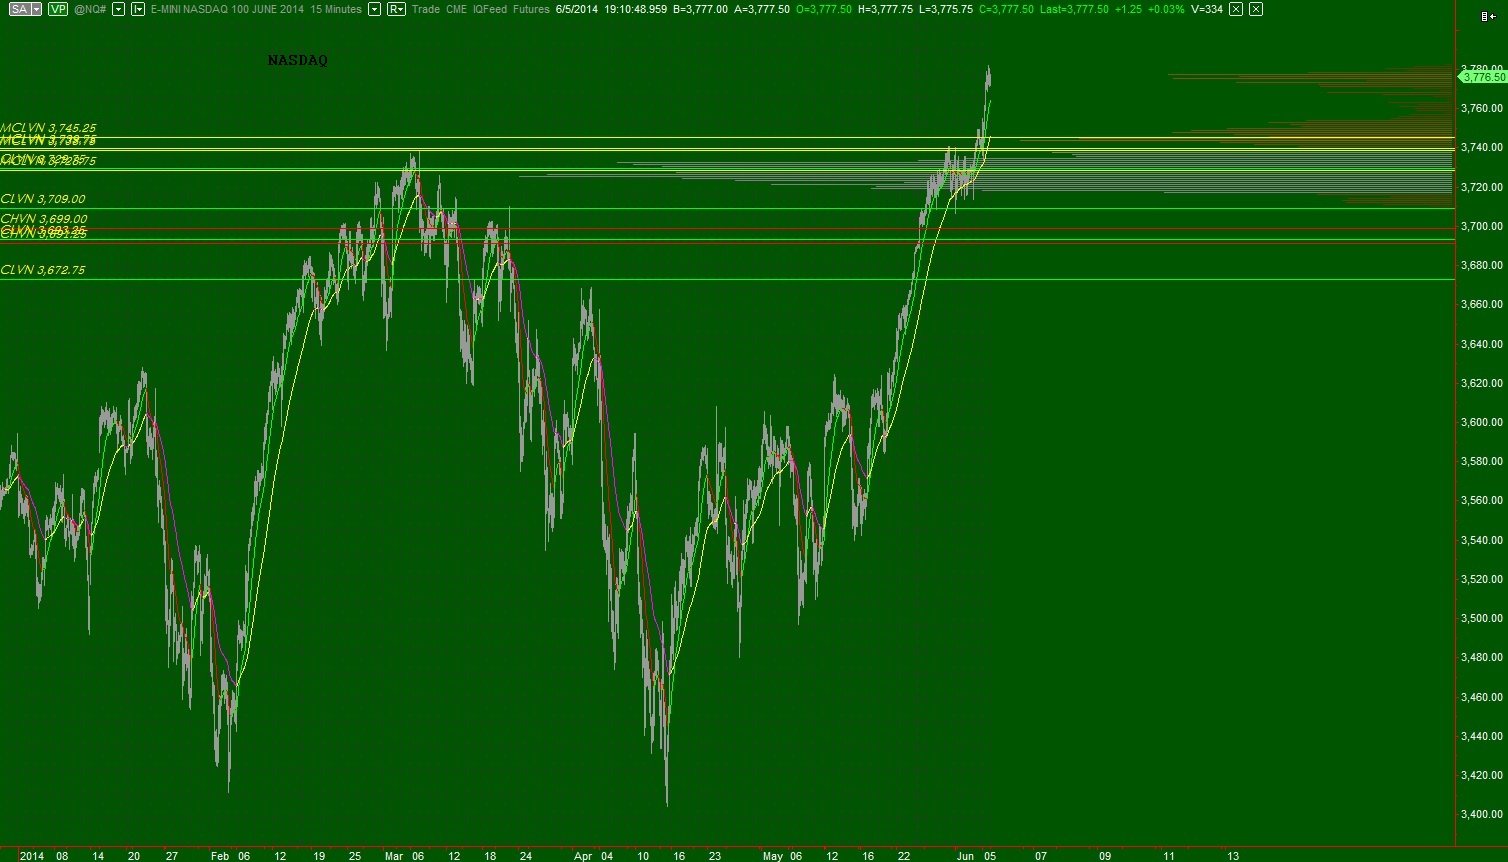
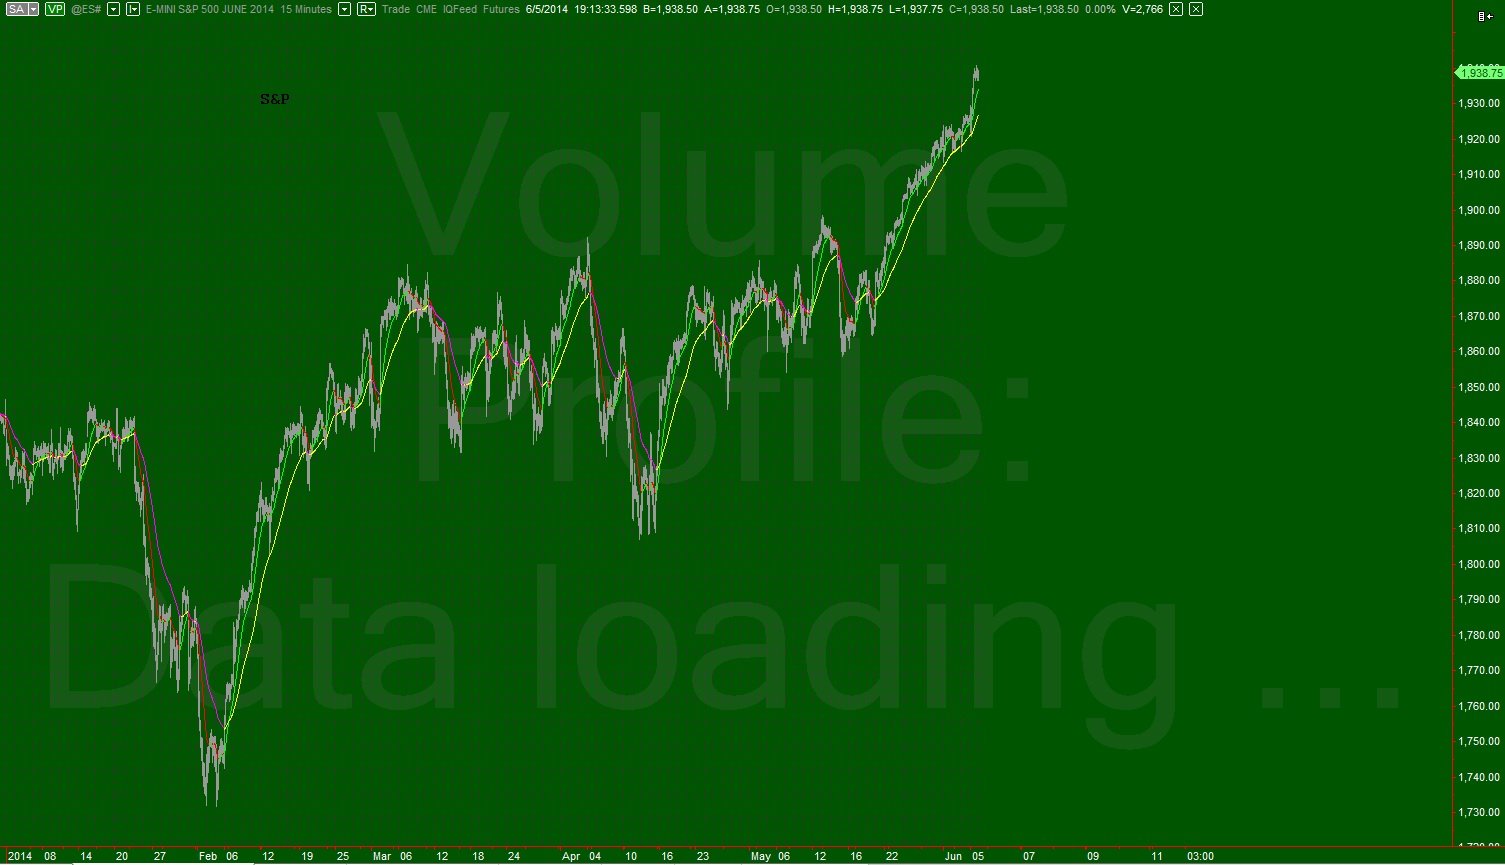
If you have clicked my blog title with haste, insistent upon reason and logic without all the 80’s bravado and unpalatable verbiage, then look no further than the following market profile bits, which I will discuss a bit further below:
NQ_marketprofile_06052014_afterhours

ES_marketprofile_06052014_afterhours

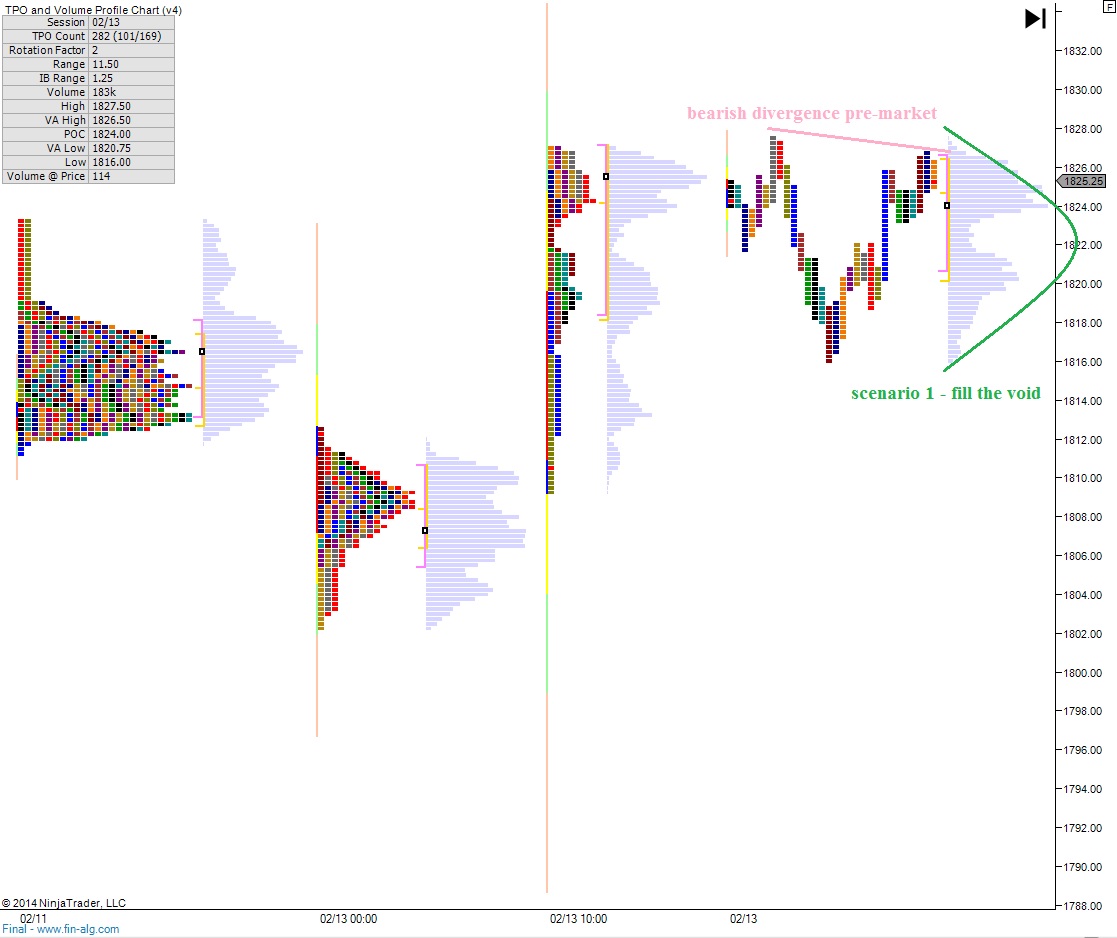
The P-shaped profile is known as a short squeeze.  This is a temporary phenomenon in some cases, and when they occur in the context of a downtrend they often mark the end of the countertrend.  The key is keeping your intermediate timeframe clear.  Is this a downtrend?

NQ_intterm_06052014_afterhours
ES_intterm_06052014_afterhours

If you have ever been to a live auction then you have seen this action, or if you have been to a stingy charity event then you have seen the opposite action.  An item  is rolled out and the auctioneer begins their banter about starting bid.  If no one bites then they drop the initial bid.  Once we have interest the process begins.  At the tight-pocketed charity event, after two or three hands are raised everyone starts looking around, afraid to raise their hands.  The auctioneer starts using tons of filler noise, making it seem like the auction is still active when really it is dead.

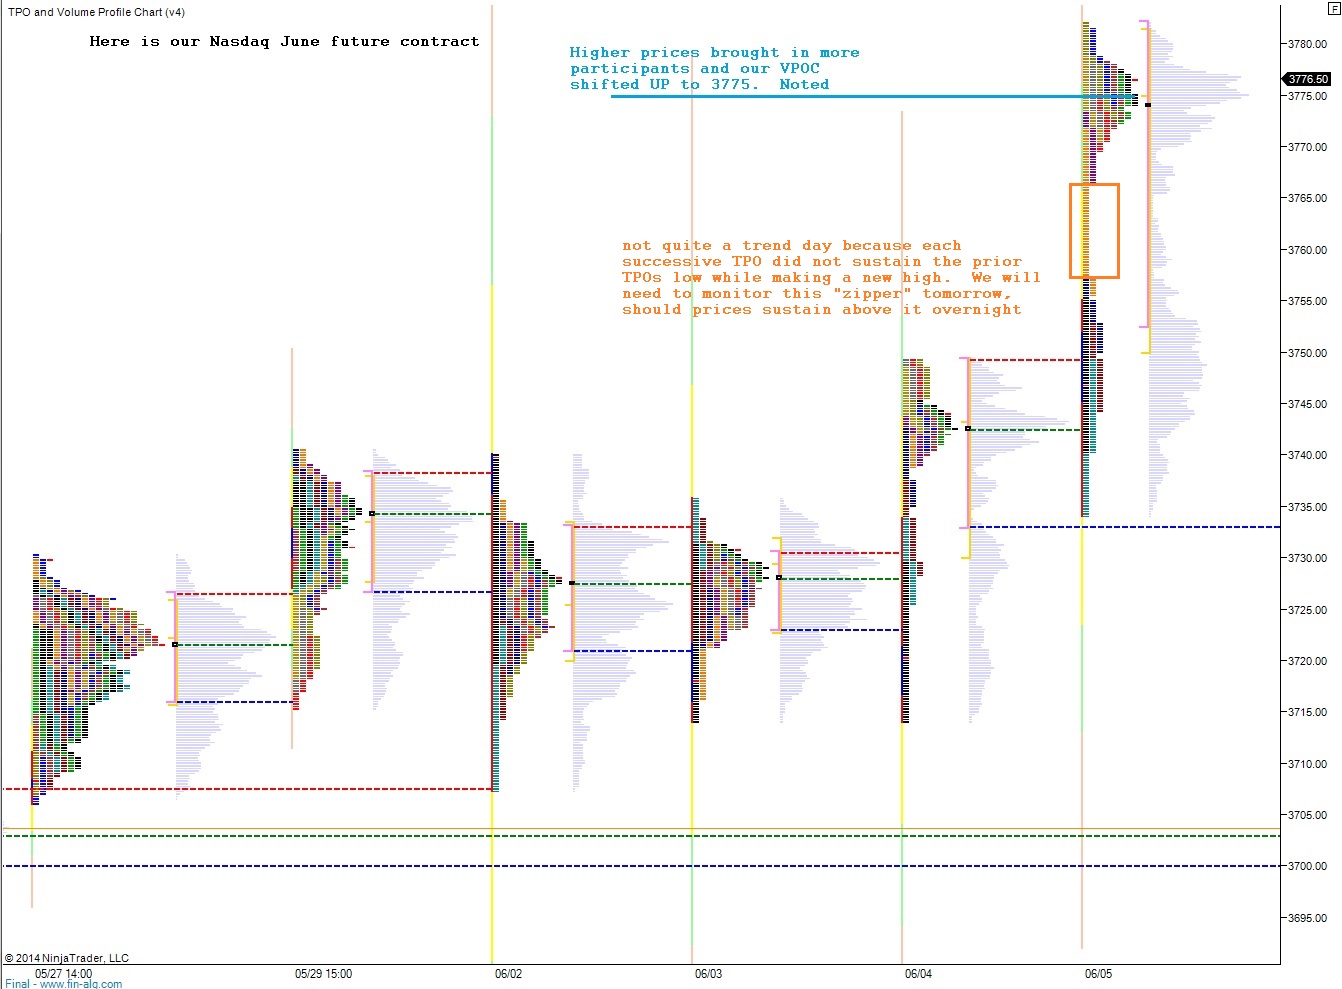
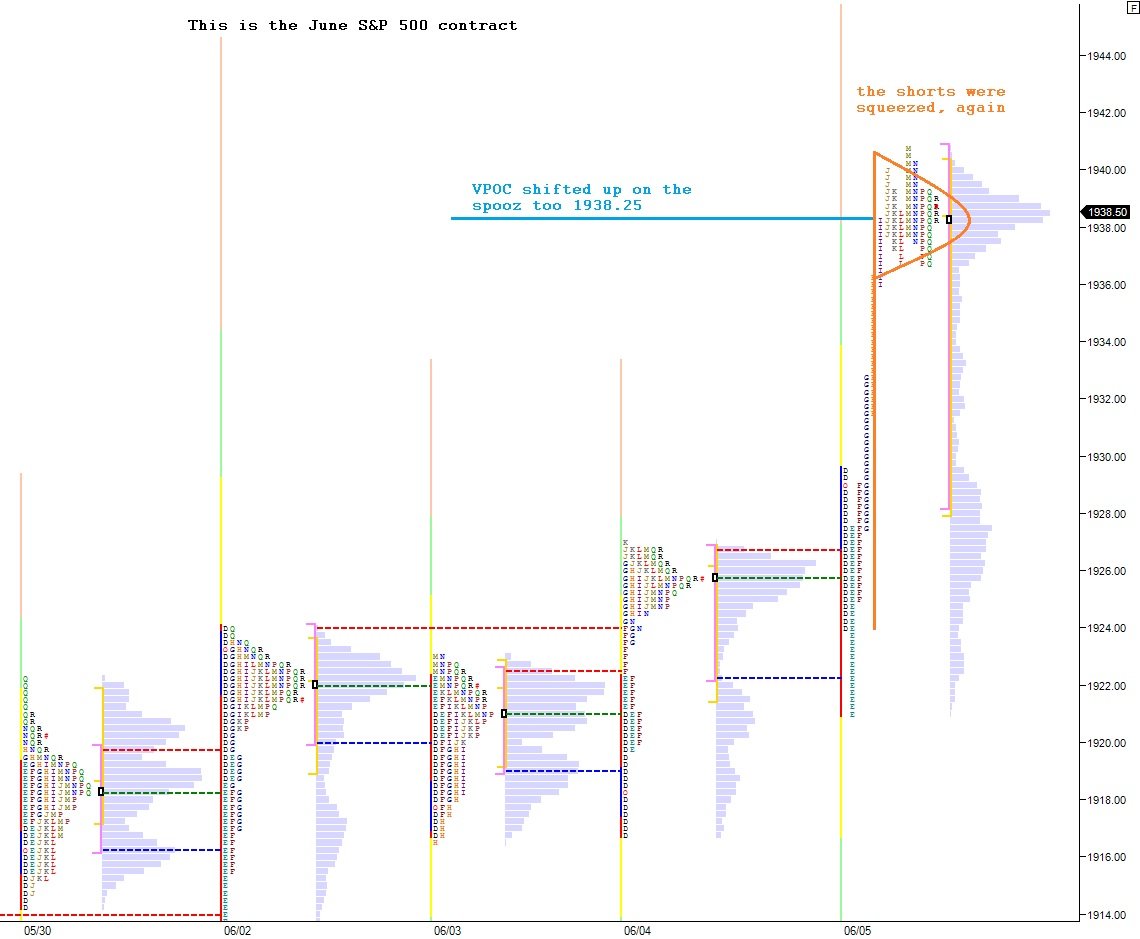
The opposite is when higher prices actually bring NEW participants into the auction.  They have seen the activity and when it reached higher advertised prices it enticed them and they wanted to buy.  The auctioneer is saying very little filler, and the price continues climbing.

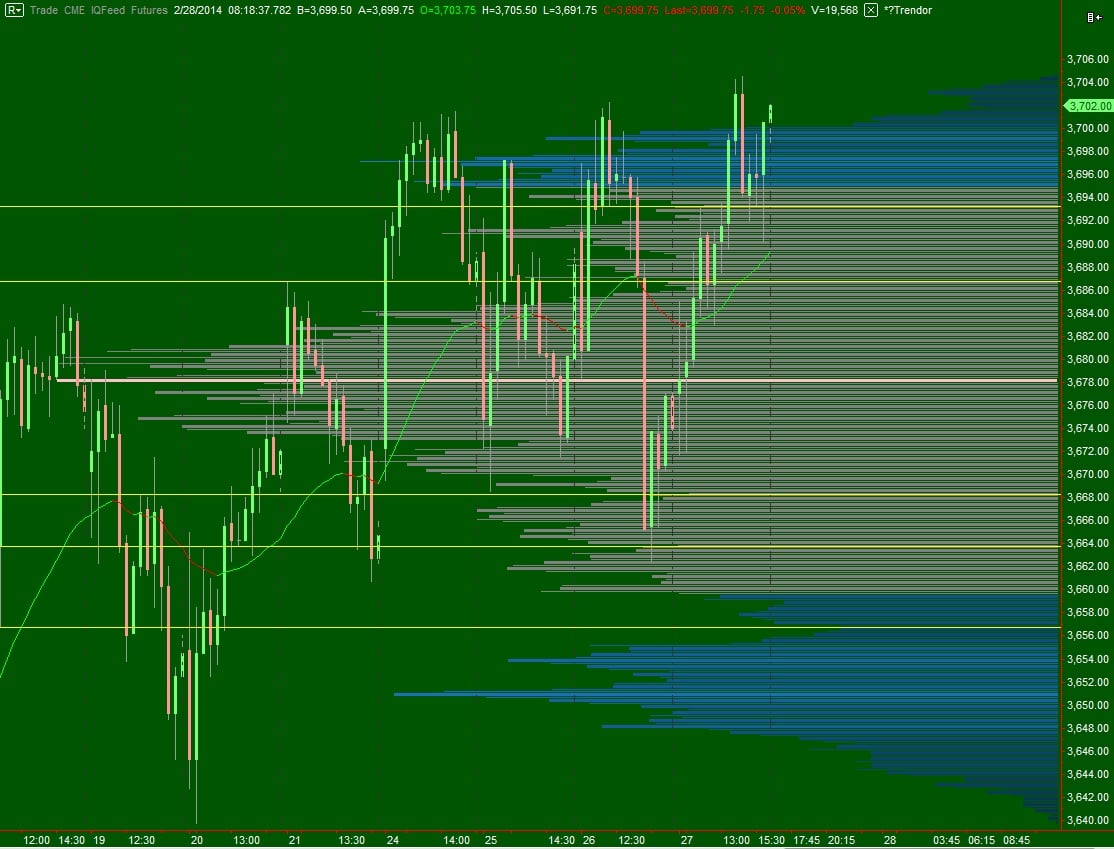
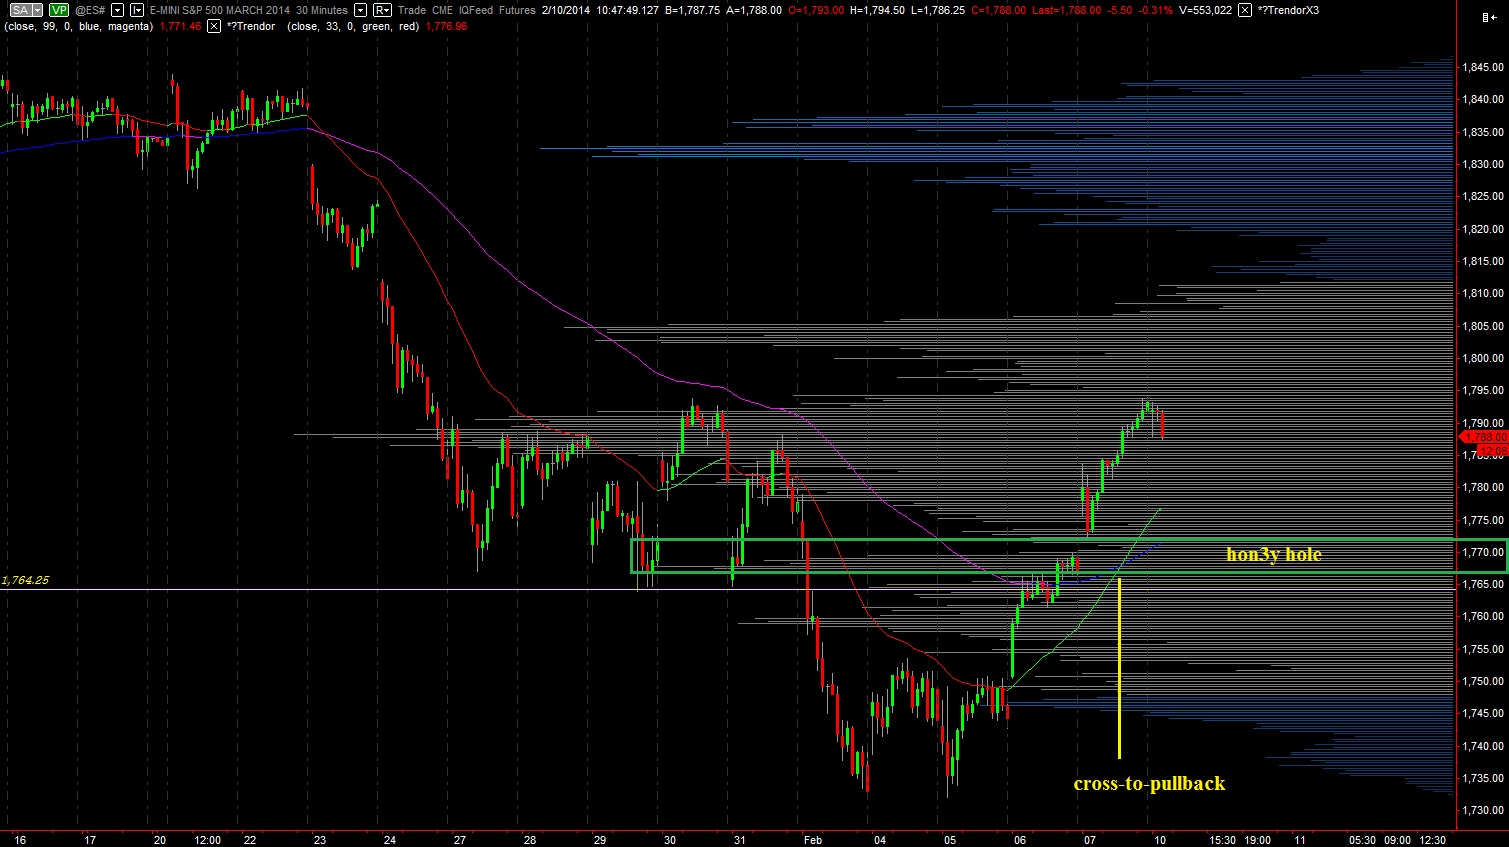
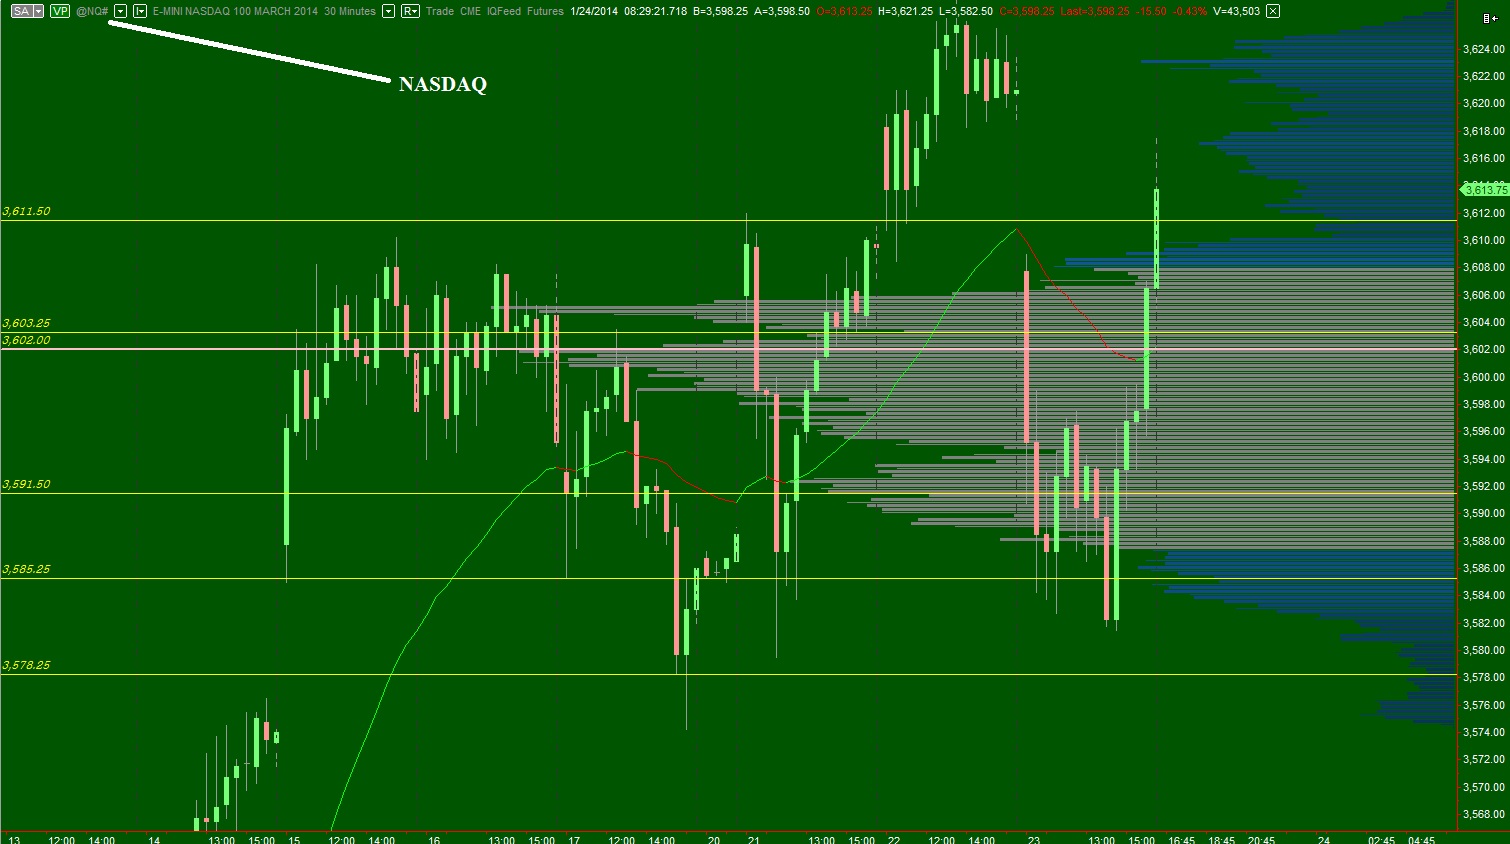
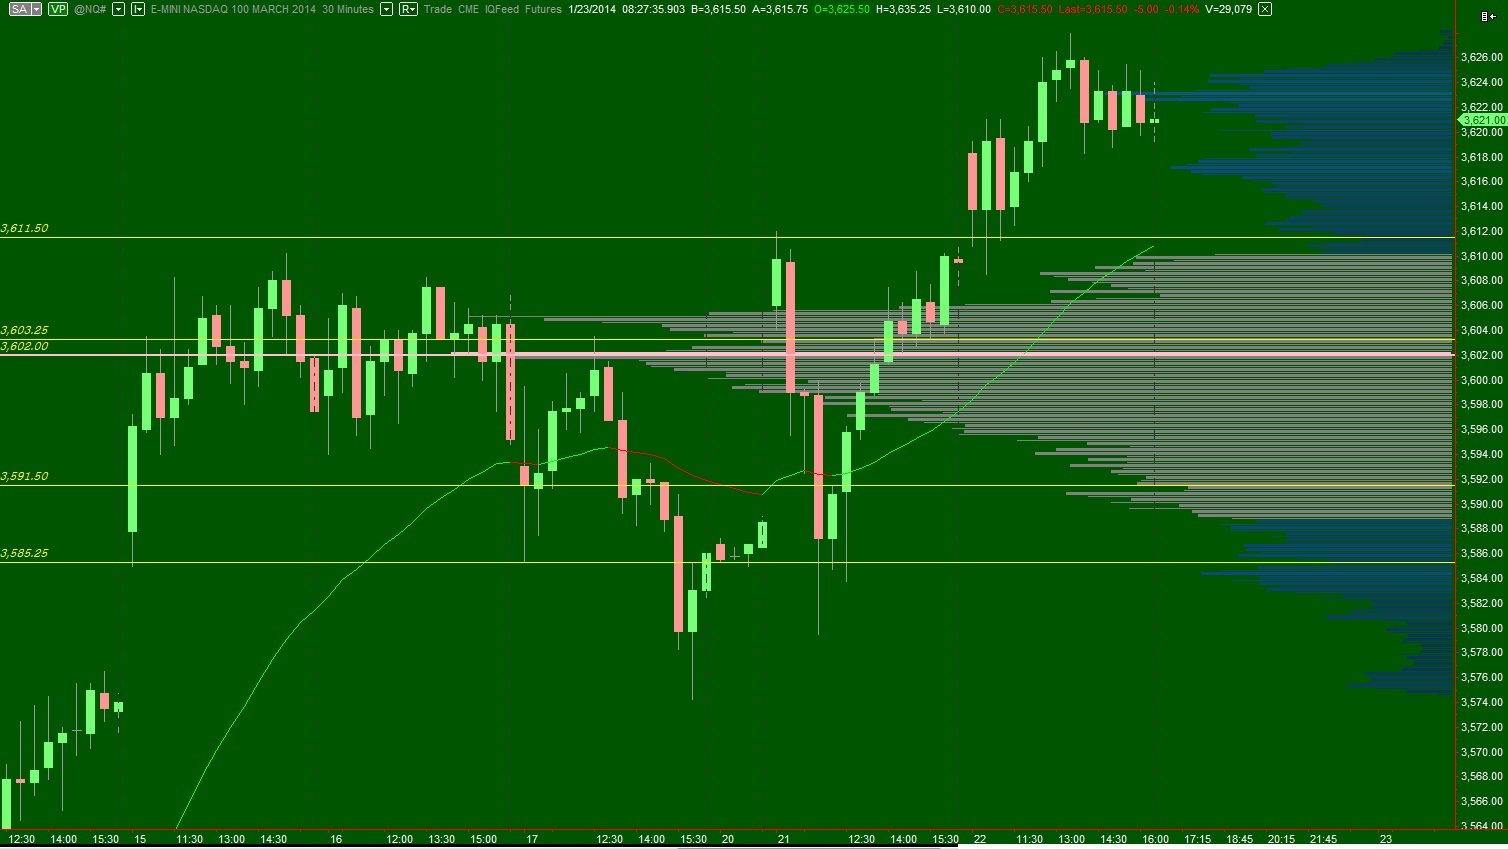
I see that rising VPOC as higher advertised prices generating buying interest.  And even through these are not quite trend day profiles, I am pressing my longs into tomorrow as these contracts trade at all time highs.

Sleep well my little butter cups 😉

Comments »

Navigating The Stratosphere

One of the joys with mapping and tracking balance is you come to moments in the market where then hunt is nearly complete.  Throughout this week, we have been tracking our intermediate timeframe control because it was a very visible development which merited our attention.  We know the long term timeframe is controlled by the buyer, but intermediate term has been in a state of balance spanning back to February 13th.  The intermediate term continues to be in balance, as we are at the upper extreme.  From here, we can either launch into space, or fall victim to constant force of gravity which would lurch us back to the mean.  This is indeed an elevated risk environment.  I have highlighted the intermediate term balance on the following volume profile chart:

NQ_VolumeProfile_intermediateTerm_02282014_monthEnd
The short term is controlled by the buyer.  We successfully tested lower yesterday and once the market found a solid bid it went on an exploration higher.  The result was a new swing high and value migrating just a bit higher.  Value has not yet made a new swing high, though, which is a point we set on 02/24 right at 3700.  Big round numbers tend to behave in a unique manner, 3700 is no exception.  It is my pivot for intraday action today.  I have made some short term observations and envisioned a few scenarios on the following market profile chart of the NASDAQ composite:

NQ_MarketProfile_02282014_monthend

Finally, I think it is even more important today to watch the lagging S&P 500, which has significantly more room to run higher, in the short term.  A key component of this occurring will be strength in the transports and financials.  I have made a few short term observations of the SPX on the following market profile chart:

ES_MarketProfile_02282014_monthend


Comments »

Bullish “Poor High” in Effect

The S&P 500 via its electronic futures contract the /ES printed a poor high on the session.  This refers to a high watermark printed as a double or even triple print.  It is very uncommon for such a print to mark swing high.  Given our recent swing high this morning, it lends a bit of confidence to being long…at least until a new high is made.

ES_MarketProfile_02192014


UPDATE: Also, reader Matt_Bear points to this chart, where he sees a pattern which may preclude higher prices:

MattB_spx2014-02-19-TOS_CHARTS

Comments »

The Day After A Trend Day – Valentine’s Day

The equity futures markets were balanced overnight, however rather opportunistic given the large range and impressive volumes.  The actual auction that took place overnight was very organized and saw good participation from both the buyers and sellers who both seem to be willing to participate at these levels.  This suggests we are coming into balance.

However, there was no definitive point of value reached, as the resulting volume profile suggests a slight imbalance exists via the lack of a smooth, bell-shaped curvature.  Instead the profile shows a slight imbalance to the upside.  I have highlighted this imbalance as well as a few key price points and scenarios on the following market profile chart:

NQ__MarketProfile_02142014

Yesterday was interesting and the morning vision work paid off in spades.  Inside 12631, I was taking through the profile development.  Within the first half hour of trade my entire upside scenario had been captured by a strong opening drive. This was OTF (other time frame) action, or the long term timeframe asserting itself on the marketplace.  OTF shows no regard for support and resistance levels seen on the daily and even intermediate term profiles, instead opting to plow money into the marketplace.  It did not take long to recognize the trend day activity and grab on and ride it until the wheels come off.

The NASDAQ seemed to play catch up yesterday, however, while the S&P put in a milder trend, almost static enough to challenge the trend day structure.  I will be watching the S&P today, to see if it can show strength.  Thus far in the AM, it has been diverging from the NASDAQ.  I have highlighted this divergence on the following market profile chart of the ES future:

ES_MarketProfile_02142014


Also, have a Happy Valentine’s day.  Be extra gay and sappy with your special someone.  But don’t forget about the industrial production numbers at 9:15am and consumer sentiment at 9:55am.  Carry on.

Comments »

$SPX Enters the Hon3y Hole

Grand morning grand traders, may you fill you wallets with several grand this month.  I want to turn your attention to the 30 minute /ES_F chart, our futures contract representing the S&P 500 index.  You can see price working a rotating off of a bounce last week, but encountering some resistance.  Such is the challenge any marketplace encounters when working through a glut of supply.  Remember all of that egregious buying I did last month?  Supply.

Anyhow, I think the SPX is important this week, especially if we see this weakness which is creeping in right now follow through in the afternoon.  With Goldman Sachs on the cusp of a breakdown and little Miss Yellen on deck, everyone is feeling a bit skittish.  An overall aversion to risk at this junction makes sense, just like taking little jabs at mother Russia from your broadcasting sofa.

The path our SPX is taking looks familiar, and is entering a long only environment I am very fond of.  Should we find buyers around 1770, I will be pedal to the metal long.  And wouldn’t it just be swell if I could shed this TZA hedge in the green?  I know you all wish the best for your humble market broadcaster.

Here is where I want to see buyers come in as we enter the hon3y hole:

ES_VolumeProfile_02102014

Comments »

Keep These Charts Close Today

More waves of selling rippled through the marketplace last night, as the afternoon bounce in both the S&P and NASDAQ were faded.  A bit of a risk divergence emerged from the move.  While the S&P was able to take out our low on yesterday’s session, the NASDAQ held.  Since reaching short-term oversold conditions on both indices, we are coming off the lows into the early USA hours.

With my really fancy futures data (FFD) I get to a clean look at exactly the ticks where events of interest have occurred.  I share these ticks with you, finest people of the interwebs, because we should all have this information available while making our educated guess on market behavior.

I will make one note and then present my intermediate term balances.  Yesterday the NASDAQ market profile print had a smack of long liquidation—a temporary market phenomenon driven by forcing participants to liquidate their positions.  It resembles a lowercase letter b.  These typically signal a strong initiative seller entered the market in the morning, but the force of selling was met by sufficient buy flow.  As a result, no further progress was made in the afternoon.  This is what may have sparked the afternoon ramp.  Be aware there are large timeframe traders here, aggressively battling for control of an intermediate term balance.  Try not to get too beat up in the waves they produce.

We are on the [very] low end of intermediate term balance.  I will be looking for signs of buyers. I have highlighted this intermediate term balance using the following two volume profiles:

NQ__VolumeProfile_01242014_INTERMEDIATE_TERM


ES__VolumeProfile_01242014_INTERMEDIATE_TERM

Comments »

Back and Fill

Sell flow worked though the markets last night after the buyers pressed a bit higher during the globex session.  The S&P continues to lag the NASDAQ and one must start to consider which one of these indices is telling the story here.

The /ES_F (S&P electronic future contract) is currently trading 5 points below yesterday’s close.  The gap trade will be in effect today, as buyers work to fill this overnight void.  I have envisioned more back-and-fill action for the S&P as it continues working through intermediate term balance.  Should we instead see an aggressive drive away from intermediate term balance, it would suggests a longer timeframe trader is acting upon the market.  The first chart is a scenario I envision, and the second highlights the intermediate term balance and key levels within it:

ES__VolumeProfile_01232014

ES__VolumeProfile_01232014_INTERMEDIATE_TERM


Turning our attention to the NASDAQ via the /NQ_F contract, we see prices made new swing high yesterday.  It will be interesting to see if these prices sustain.  Overnight the market found buyers at 3610, the intermediate term value area high, and quickly rotated higher.  I will be keen on this level today as a break likely brings a retest of the VPOC at 3602.  Here is the intermediate term balance in /NQ:

NQ__VolumeProfile_01232014_INTERMEDIATE_TERM

Finally our NASDAQ daily market profile is presented below.  You can see it printed a high VPOC suggesting value is migrating higher and perhaps beginning the process of discovery higher, in hunt of new value.  We are set to open inside range, inside value today.  Thus we are presented with a lower risk/reward environment intraday.  Keep in mind a strong drive (either direction) at the open could change this sentiment rather quickly.  Otherwise, my expectation is for price to work through a bit of back-and-fill along with the S&P.   I have presented a scenario below:

NQ__VolumeProfile_01232014


Comments »

Carving Out The Bullish Case

One of the subtle cues the market gave us yesterday during the selloff was the divergence between the NASDAQ and the S&P.  As prices in the S&P made lower lows verses Friday trade, the NASDAQ diverged.  This is a risk divergence and was the first catalyst to take out your shopping list and build some risk.

Sellers were able to sustain control in the S&P on the net session by extending the initial balance lower, taking out prior day lows, printing a lower high/lower low, and pushing value slightly lower.

The NASDAQ was not as clear in regard to control.  Sellers extended the initial balance lower but never took out Friday lows.  We printed a higher high /higher low and value moved to its highest level this year.

Turning our attention to the NASDAQ, overnight prices went to new swing highs at 3621 before finding sellers.  Since then price has bounced around a bit in a relatively balanced manner with a bit of a buying wick up top.  This gives us two bits of sentiment.  First, swing highs are rarely made outside of regular market hours, thus the overnight high is vulnerable.  Second, the overnight inventory is net long, thus we may see some sell flow early on.

We are trading slightly above yesterday’s close which presents a potential gap fill trade back to 3609.50.

Overnight control, buyers

Yesterday control, buyers

Intermediate term control, buyers

Long timeframe control, buyers

I have highlighted a few upside targets, as well as levels of support I will be watching on the following volume profile chart:

NQ_MarketProfile_01222014

Comments »

Big Waves Overnight

Futures are up down a bit overnight after a busy night.  S&P futures printed over seven handles in range while the NASDAQ printed an eighteen handle range.  The action was fast at times and the resulting market profile print shows no signs of balance.

We have a busy economic calendar today including some premarket data.  However, as we approach US trade markets are set to open in range and in value presenting us with a lowered risk reward environment.  This condition could be favorable for individual stocks since the mild climate will not exert macro forces on these plays.

It will be important today to see who is in control of trade.  Yesterday the action was predominately controlled by the local time frame (LTF) and this could be seen as value area highs and lows being faded back to the VPOC all day.  These choppy conditions lack the order flow of other time frame who push us out of short term balance. 

The /ES futures representing the S&P 500 are still trading within intermediate term balance.  I will be watching a micro composite volume profile spanning back to 12/20/2013 which describes this intermediate term balance.  The two closest levels in play are 1834.25 and 1840.50. I have highlighted these key levels on the following /ES chart:

ES__VolumeProfile_01172014

Turning to the NASDAQ futures, yesterday the action was contained entirely within the range of the prior day and we traversed most of the daily range in the last half hour of trade.  The action is nearly identical to the prior day and printed matching VPOCs.  This inside day print can sometimes occur near infection points.  In this tape, it would demonstrate a time based correction at the highs which erodes at short sellers.  Price is slippery below 3594 and opens to door to a gap fill.  If instead we hold 3583.50 we may be successfully leaving intermediate term balance and exploring higher.  Otherwise, the naked VPOC at 3574 becomes a target.  I have highlighted these levels on the following market profile chart:

NQ_VolumeProfile_01172014


Comments »

A Fresh Look at Market Auctions

The behavior of the equity markets last week cleared up any uncertainty as to whether or not everyone was back to doing business.  Volume increased in most instruments and move have increased in size and speed.   Both the NASDAQ and the S&P have been chopping around which creates opportunistic conditions for day traders.  These benign conditions have allowed individual pockets of momentum to make large runs too.

I spent the weekend building out a few new charts since Mirus futures and Ninja trader will not be working properly any time soon.  The first chart is 30 minute candles of the S&P 500 via the /ES contract.  I am using the 30 minute bars to simulate the TPOs of market profile.  I am doing so with high quality tick data which produces a very accurate volume profile.  In this chart we can clearly see the intermediate term balance occurring since 12/20.  I have highlighted the low volume nodes of this chart, as I feel they present strong opportunities for traders to position their books and also observe sentiment:

ES_VolumeProfile_01132014_to_12202013

Next I have made RTH volume profiles for the NASDAQ via the /NQ contract.  These will assist me in observing the day session and who is asserting control of the tape.  We can see price consolidating recently.  The past four sessions have been “P, P, b, b” in structure.  In other words, two short squeezes then two long liquidations, but neither time did the consolidation break.  This is big players wrestling for control. 

At the apex of this action is 3551.75.  This price level has been the scene of many struggles between buyers and sellers and I will be using it as a pivot of sorts today.  I have highlighted this level and my upside and downside targets on the following volume profile chart:

NQ_VolumeProfile_01132014


Comments »