iBankCoin
Home / Tag Archives: $SPY

Tag Archives: $SPY

I Think She Has One More Good Day in Her

We never truly can say what the market should do, nor can we impose our will upon the market.  We can however, through the lens of market profile with a side of auction theory, gauge the likelihood of continuation.  This is why they keep me around, these guys.

I probably would have started locking in longs like many of you if I stayed at my trading terminal, the most aggrandized name for my bossed up PC.  After all, what a pungent thrust, certainly it would be prudent to raise cash.  I pulled a PTJ and headed to the gym an hour before the bell to avoid the angst.

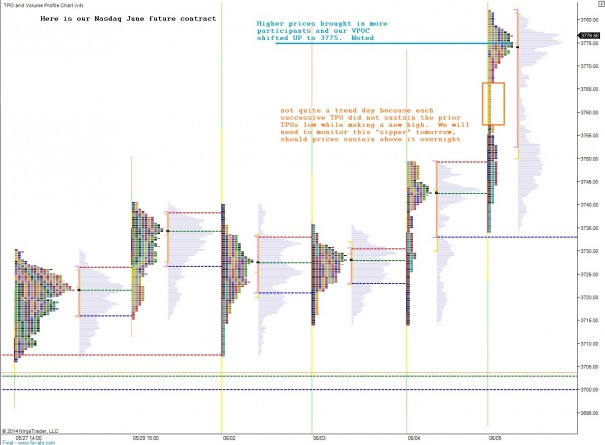
If you have clicked my blog title with haste, insistent upon reason and logic without all the 80’s bravado and unpalatable verbiage, then look no further than the following market profile bits, which I will discuss a bit further below:
NQ_marketprofile_06052014_afterhours

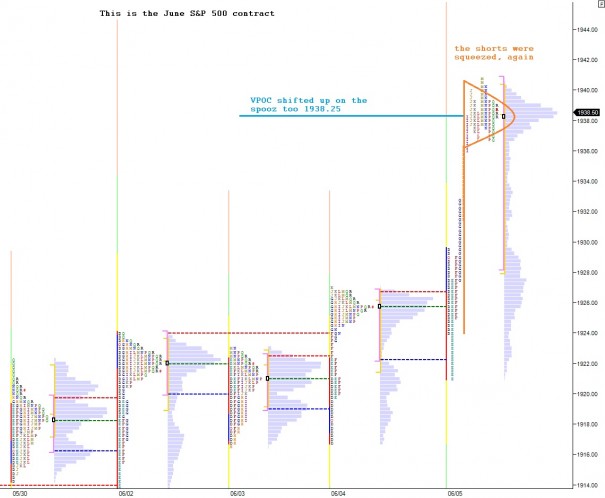
ES_marketprofile_06052014_afterhours

The P-shaped profile is known as a short squeeze.  This is a temporary phenomenon in some cases, and when they occur in the context of a downtrend they often mark the end of the countertrend.  The key is keeping your intermediate timeframe clear.  Is this a downtrend?

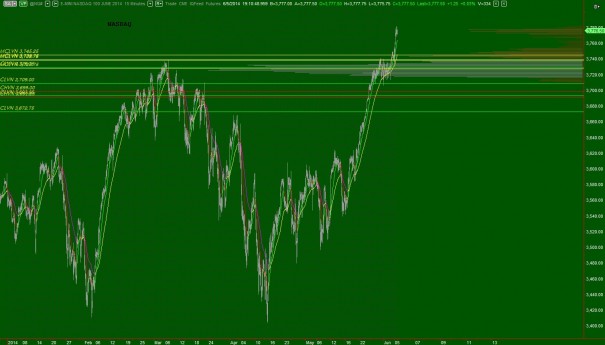
NQ_intterm_06052014_afterhours
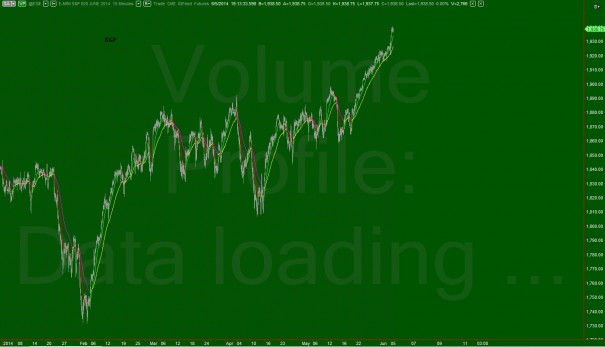
ES_intterm_06052014_afterhours

If you have ever been to a live auction then you have seen this action, or if you have been to a stingy charity event then you have seen the opposite action.  An item  is rolled out and the auctioneer begins their banter about starting bid.  If no one bites then they drop the initial bid.  Once we have interest the process begins.  At the tight-pocketed charity event, after two or three hands are raised everyone starts looking around, afraid to raise their hands.  The auctioneer starts using tons of filler noise, making it seem like the auction is still active when really it is dead.

The opposite is when higher prices actually bring NEW participants into the auction.  They have seen the activity and when it reached higher advertised prices it enticed them and they wanted to buy.  The auctioneer is saying very little filler, and the price continues climbing.

I see that rising VPOC as higher advertised prices generating buying interest.  And even through these are not quite trend day profiles, I am pressing my longs into tomorrow as these contracts trade at all time highs.

Sleep well my little butter cups 😉

Comments »

The Day After A Trend Day – Valentine’s Day

The equity futures markets were balanced overnight, however rather opportunistic given the large range and impressive volumes.  The actual auction that took place overnight was very organized and saw good participation from both the buyers and sellers who both seem to be willing to participate at these levels.  This suggests we are coming into balance.

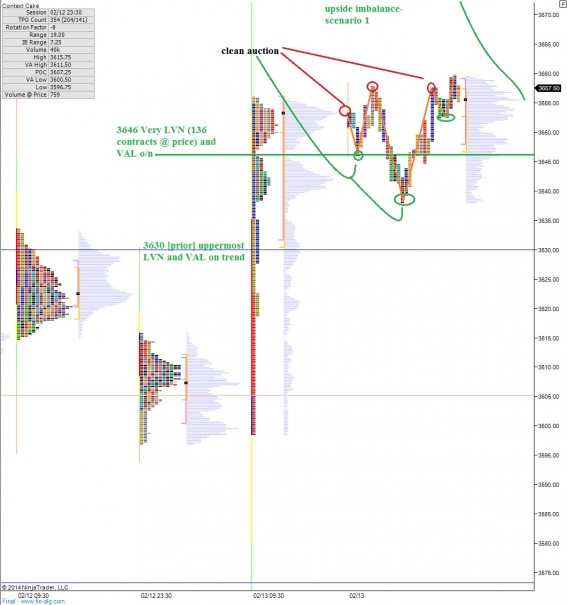
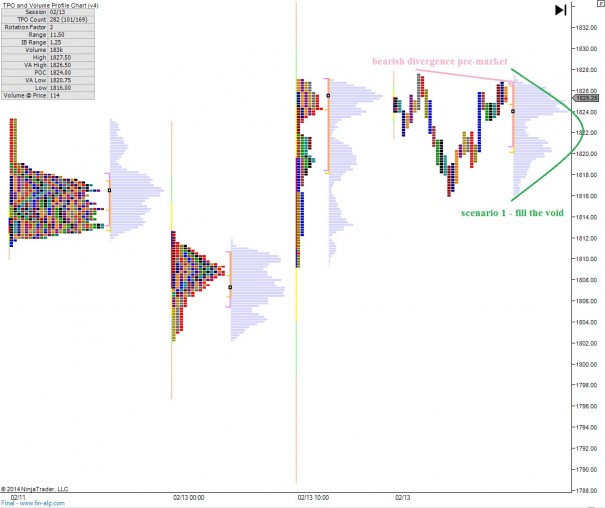
However, there was no definitive point of value reached, as the resulting volume profile suggests a slight imbalance exists via the lack of a smooth, bell-shaped curvature.  Instead the profile shows a slight imbalance to the upside.  I have highlighted this imbalance as well as a few key price points and scenarios on the following market profile chart:

NQ__MarketProfile_02142014

Yesterday was interesting and the morning vision work paid off in spades.  Inside 12631, I was taking through the profile development.  Within the first half hour of trade my entire upside scenario had been captured by a strong opening drive. This was OTF (other time frame) action, or the long term timeframe asserting itself on the marketplace.  OTF shows no regard for support and resistance levels seen on the daily and even intermediate term profiles, instead opting to plow money into the marketplace.  It did not take long to recognize the trend day activity and grab on and ride it until the wheels come off.

The NASDAQ seemed to play catch up yesterday, however, while the S&P put in a milder trend, almost static enough to challenge the trend day structure.  I will be watching the S&P today, to see if it can show strength.  Thus far in the AM, it has been diverging from the NASDAQ.  I have highlighted this divergence on the following market profile chart of the ES future:

ES_MarketProfile_02142014


Also, have a Happy Valentine’s day.  Be extra gay and sappy with your special someone.  But don’t forget about the industrial production numbers at 9:15am and consumer sentiment at 9:55am.  Carry on.

Comments »

$SPX Enters the Hon3y Hole

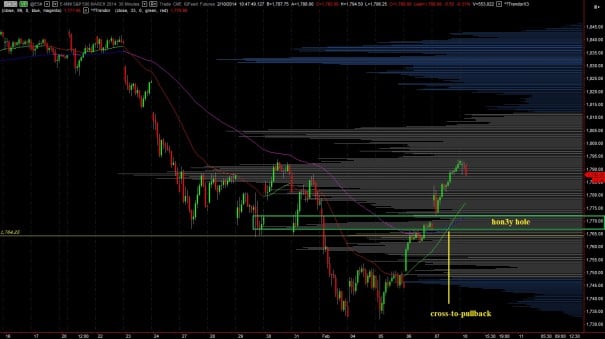
Grand morning grand traders, may you fill you wallets with several grand this month.  I want to turn your attention to the 30 minute /ES_F chart, our futures contract representing the S&P 500 index.  You can see price working a rotating off of a bounce last week, but encountering some resistance.  Such is the challenge any marketplace encounters when working through a glut of supply.  Remember all of that egregious buying I did last month?  Supply.

Anyhow, I think the SPX is important this week, especially if we see this weakness which is creeping in right now follow through in the afternoon.  With Goldman Sachs on the cusp of a breakdown and little Miss Yellen on deck, everyone is feeling a bit skittish.  An overall aversion to risk at this junction makes sense, just like taking little jabs at mother Russia from your broadcasting sofa.

The path our SPX is taking looks familiar, and is entering a long only environment I am very fond of.  Should we find buyers around 1770, I will be pedal to the metal long.  And wouldn’t it just be swell if I could shed this TZA hedge in the green?  I know you all wish the best for your humble market broadcaster.

Here is where I want to see buyers come in as we enter the hon3y hole:

ES_VolumeProfile_02102014

Comments »

Big Waves Overnight

Futures are up down a bit overnight after a busy night.  S&P futures printed over seven handles in range while the NASDAQ printed an eighteen handle range.  The action was fast at times and the resulting market profile print shows no signs of balance.

We have a busy economic calendar today including some premarket data.  However, as we approach US trade markets are set to open in range and in value presenting us with a lowered risk reward environment.  This condition could be favorable for individual stocks since the mild climate will not exert macro forces on these plays.

It will be important today to see who is in control of trade.  Yesterday the action was predominately controlled by the local time frame (LTF) and this could be seen as value area highs and lows being faded back to the VPOC all day.  These choppy conditions lack the order flow of other time frame who push us out of short term balance. 

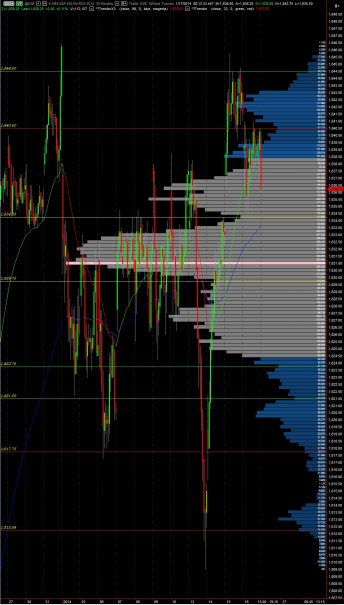
The /ES futures representing the S&P 500 are still trading within intermediate term balance.  I will be watching a micro composite volume profile spanning back to 12/20/2013 which describes this intermediate term balance.  The two closest levels in play are 1834.25 and 1840.50. I have highlighted these key levels on the following /ES chart:

ES__VolumeProfile_01172014

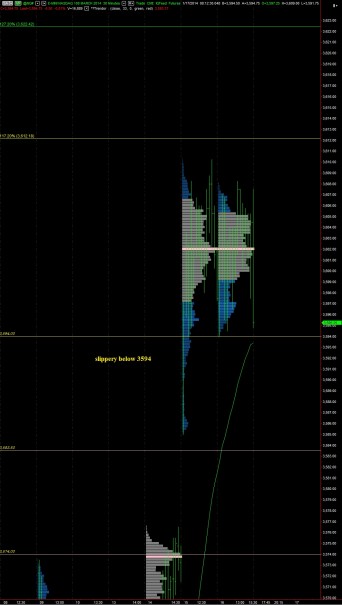
Turning to the NASDAQ futures, yesterday the action was contained entirely within the range of the prior day and we traversed most of the daily range in the last half hour of trade.  The action is nearly identical to the prior day and printed matching VPOCs.  This inside day print can sometimes occur near infection points.  In this tape, it would demonstrate a time based correction at the highs which erodes at short sellers.  Price is slippery below 3594 and opens to door to a gap fill.  If instead we hold 3583.50 we may be successfully leaving intermediate term balance and exploring higher.  Otherwise, the naked VPOC at 3574 becomes a target.  I have highlighted these levels on the following market profile chart:

NQ_VolumeProfile_01172014


Comments »

Catch A Dipper By Their Tail

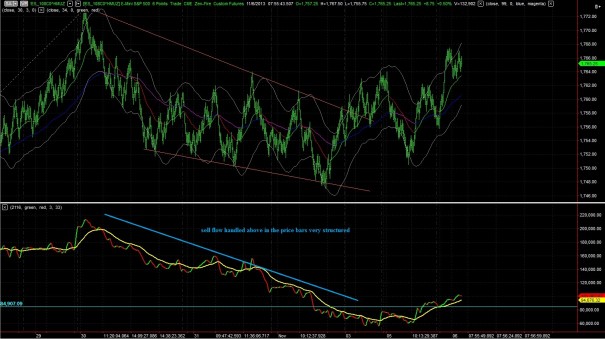
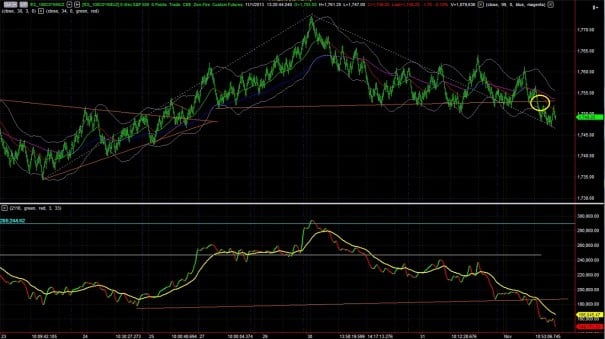
Early last week we were hot on the trail of a suspected whale on the tape: a large seller who perhaps was much more privy to future knowledge then us, directing massive AUM, and quietly entering the market.  It was a contextual concept that framed our decision making process.

Every morning I would delve a bit deeper into this idea by drilling into the market profiles and determining where this potential bear-whale could show her claws.  She never really succeeded.

As more information becomes available, it now appears what we were observing was not a large individual, but instead a collective profit taking by global money managers.  And coming into today’s gap higher, it appears the market absorbed the profit taking exceptionally.  One of the components of this distribution, or rotation, which kept me constructive on my swing long positions was the structure of the market as we encountered heavy selling.  Have a look:

ES_BARCHART_1106013

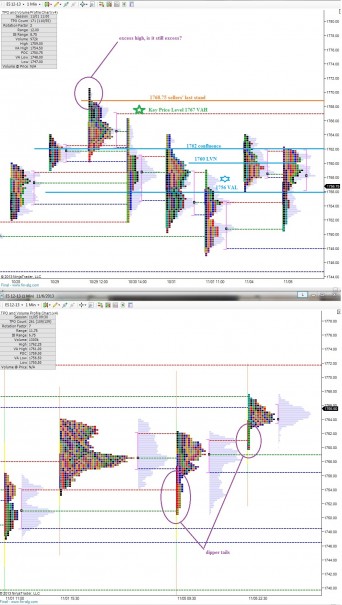
The key to determining a successful entry into the year-end performance change in my view is establishing value above 1767.  We would then be told that value is migrating to all-time highs and being accepted.

Down below, the bulls don’t want to lose yesterday’s value area low at 1756 in short order because that would represent a swift rejection by the sellers.

I have highlighted the above levels and a few interesting foot (tail) prints on the following market profile charts:

ES_MarketProfile_11062013

Comments »

Understanding Price Movement

The markets did very little overnight and continue to hold these elevated levels with a modicum of rotation.  This tight range is much like the base of a lamp where the more narrow it is, the easier it is to tip the lamp over.

Therefore we should define some reference points where the market may spill over in either direction.  Daily highs and lows are a simple measure of balance disruption and effective, but I like to envision what a balanced profile shape would be.  That way I can observe if moves away from value are normal parts of the current auction or an attempt by price to explore elsewhere.

I have drawn a few scenarios out and highlighted prices of opportunity on the following market profile charts:

ES_MarketProfile_10222013

Comments »

View from The Summit

The S&P futures traded in a tight and balanced range overnight, holding the high water mark levels established Friday afternoon.  Last week’s action was so dynamic it left behind areas of poor auction.  The market wasted little time climbing to these highs and as a result we do not have a strong foundation of auctions below.

The weekend brought nothing deemed significant enough to re-price the markets, so we can interpret the early AM moves relative to our current reference point to gauge the early-week conviction of market participants.

To my eye it appears less will without question be more in today’s environment as price action looks choppy and quiet.

I have highlighted a few scenarios and levels of opportunity on the following market profile charts:


ES_MarketProfile_10212013

Comments »

Apple Cider Vinegar to Aid Digestion

What was interesting coming into trade yesterday morning was the largely impressive and vastly under the radar strength in the Euro dollar which we observed via the 6E contract.  The euro is sitting at multi-year resistance which many macro funds are leaning on and it went on a full out rout higher.

Then our markets did, too.

Regarding news flow, the strength in the indices marks a victory for Washington DC.  And precious metals ripped yesterday too, so everyone enjoyed some cake in a rather hedonistic manner.

Market strength continued overnight with one the bigger drivers being the strong earnings out of Google.  It makes sense to pay attention to the market’s reaction to the market’s reaction of this positive news.

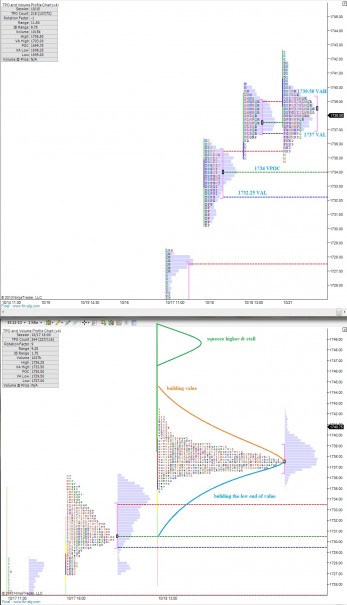
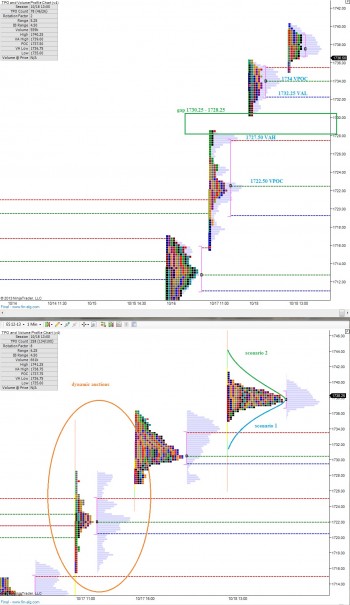
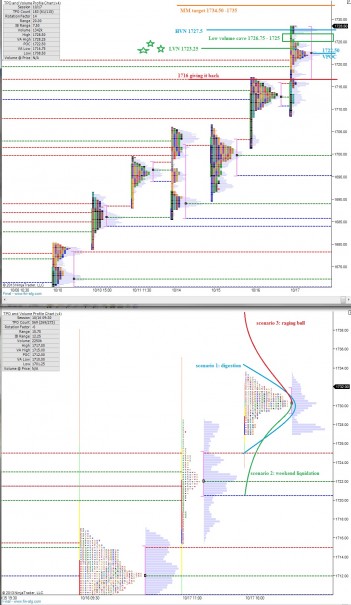
As of this writing, the market is digesting near the highs, the /ES has a measured move target of 1734.50.

Yesterday’s profile has the toothy characteristics of a trend day, where volume (value) follows the price higher.  I have highlighted the volume zones I will be observing today as well as a few potential scenarios on the following market profile charts:

ES_MarketProfile_10182013

Comments »

Sniffing Out a Big Seller

ES_MarketProfile_10172013Quiet markets overnight mostly.  The Euro dollar made a strong move overnight which is interesting because it has been resting at a multiyear bracket high.  It will be interesting to see if this currency’s strength has any correlative effects on US equities.

Overnight profiles in the /ES and /NQ suggest a relatively balanced trade suggesting any news flow overnight was either expected or non-material or never happened at all.  We are seeing a bit of selling creep onto the tape as the USA comes online, and it will be interesting to see if the sellers can gain any traction at these elevated index levels.

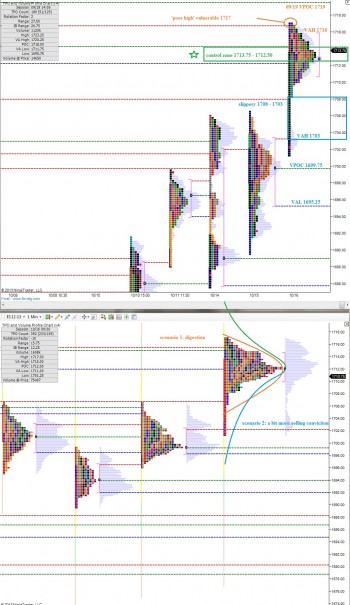
Yesterday we printed at poor high at 1717 which clues us in we may see higher prices in the near-term.  We also saw a huge flow of aggressive buying into the closing bell get absorbed with ease by a passive seller.  This suggests the power is starting the wean as this bull presses on.

I have highlighted a control zone today on the profile and I think whichever party best dictates price around this area and is able to press from this area will gain control today.  I also highlighted a few other key price levels and potential scenarios on the following market profile charts:


Comments »