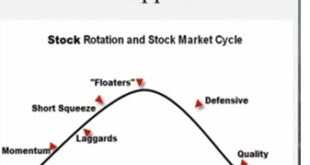
I haven’t posted all that much on the OABOT. Regrettably I haven’t put the kind of time into the development of it in quite some time. Fortunately I still have a lot of prepared material on it. First off you have to consider “what makes a stock worth buying?” Such a question is what got me started on the OABOT.
Here is a link to the Spreadsheet mapping out my early concept for OABOT. Reading it you may have a better understanding at how I was able to construct the OABOT and what my thoughts and planning was going into it. I have dramatically changed the criteria and is nothing like what I have provided of how to define a stock in a cycle or how to score it, but it should give you the idea.
Past posts on OABOT:
A vision for the future of OABOT
I also constructed an OABOT document to explain what it is and how it works. oops, can’t upload right now due to the size, and the site I uploaded it to is down.
Lately the way I like to use it is grab 80 names from each “risk category” then put it into finviz and scan 400 stocks and narrow the list. There are two ways to rank stocks either taking into account “what’s working” to boost stocks that are in the right group, and just by ranking by overall setup score. Usually I like maybe 10% of the setups when doing it this way which gives me a pretty good list. If I use the summary tab to find the best themes, and then categorize the exact industry in that theme and determine what phase of the risk cycle is working in that idea or the next one, I have a very concentrated list that in a couple examples I liked about 30-40% of the names I picked. This really confirmed for me that finding a group that sets up together and finding the right classification of stock within that group will really boost the accuracy of what I’m doing and definitely will be a major part of improving the tool in the future. Unfortunately adding a multiplier combining setup score AND which groups are working ran into problems since it over rated a lot of very small industry groups with less then half a dozen stocks in them.
update 3/15: I think I forgot to attach this document back when I first made this post so I’m adding it now.
OABOT and NEO: The Next Stage


Apparently as of the day after I made this post you now need a finviz elite membership to export… and even if you had one you’d have to be logged in which is annoying enough but also is something I don’t think can be done automatically from excel anyways.
In other words, the OABOT as a project is suspended. Breadth updates cannot be provided easily either. Was just planning to put some work in on it soon but it cannot be done now.
I’ve got an Excel spreadsheet that pulls data from a combination of the Nasdaq website and Yahoo. It’s slow and might not meet your scanning needs, but you’d at least be able to see daily change info for each stock/industry/sector.
Cool, thanks MFalke do you have a download link to it anywhere, or no?
I know there are some spreadsheets on investexcel.net I might try there too but don’t think I’ll be able to find anything that replicates what I had.