Greetings everyone!
Sunday mornings are usually a time of focus for the kind and patient scientists at iBankCoin laboratory. Today the mind is adrift. Perhaps the seasons change has affected our focus as it becomes increasingly evident that soon our inventories will be put to the test as the vicious sting of winter bears down on our homes and person. It is also October, our absolute favorite month—a time when society more generally accepts the dark arts and embraces ‘spirituality’. As scientists we find the superstitions that affect the common mind wholly absurd, but it is amusing nonetheless.
It could be the passing of another meaningless milestone that is causing distraction. For 150 consecutive weeks I have taken to the robots and prepared a research report for the good folks inside Exodus. Many parts are repetitive by design. They serve to remind me ad nauseam about core principles of trading. They are also there for any new comer to read. But in general, these repetitious portions of the report can be glanced over without expending much time. Other parts of the report are dynamic as events unfold.
One of the most important components of the Strategy Session is the ‘Index Model’ which is a quantitative model built using auction theory and the predictive algorithms inside Exodus. The two schools of thought are combined to form a 5-day directional bias. This helps press winning trades further during the week. It also helps frame another important component of the Strategy Session which is the ‘Executive Summary’. The Executive Summary attempts to use as few words as possible to describe the type of price action we expect in the upcoming week.
By forcing the mind to be extremely selective with each word, it makes the statement actionable, at least for our team’s head trader, who lives somewhere inside the primal core of my brain, whose name is RAUL. RAUL uses the work done by our team of scientists, who live and work somewhere on the right side of my brain. The update posted every Sunday to the public iBankCoin blog is of course written by our chief scientists who humbly occupies a small space on the left side of my brain.
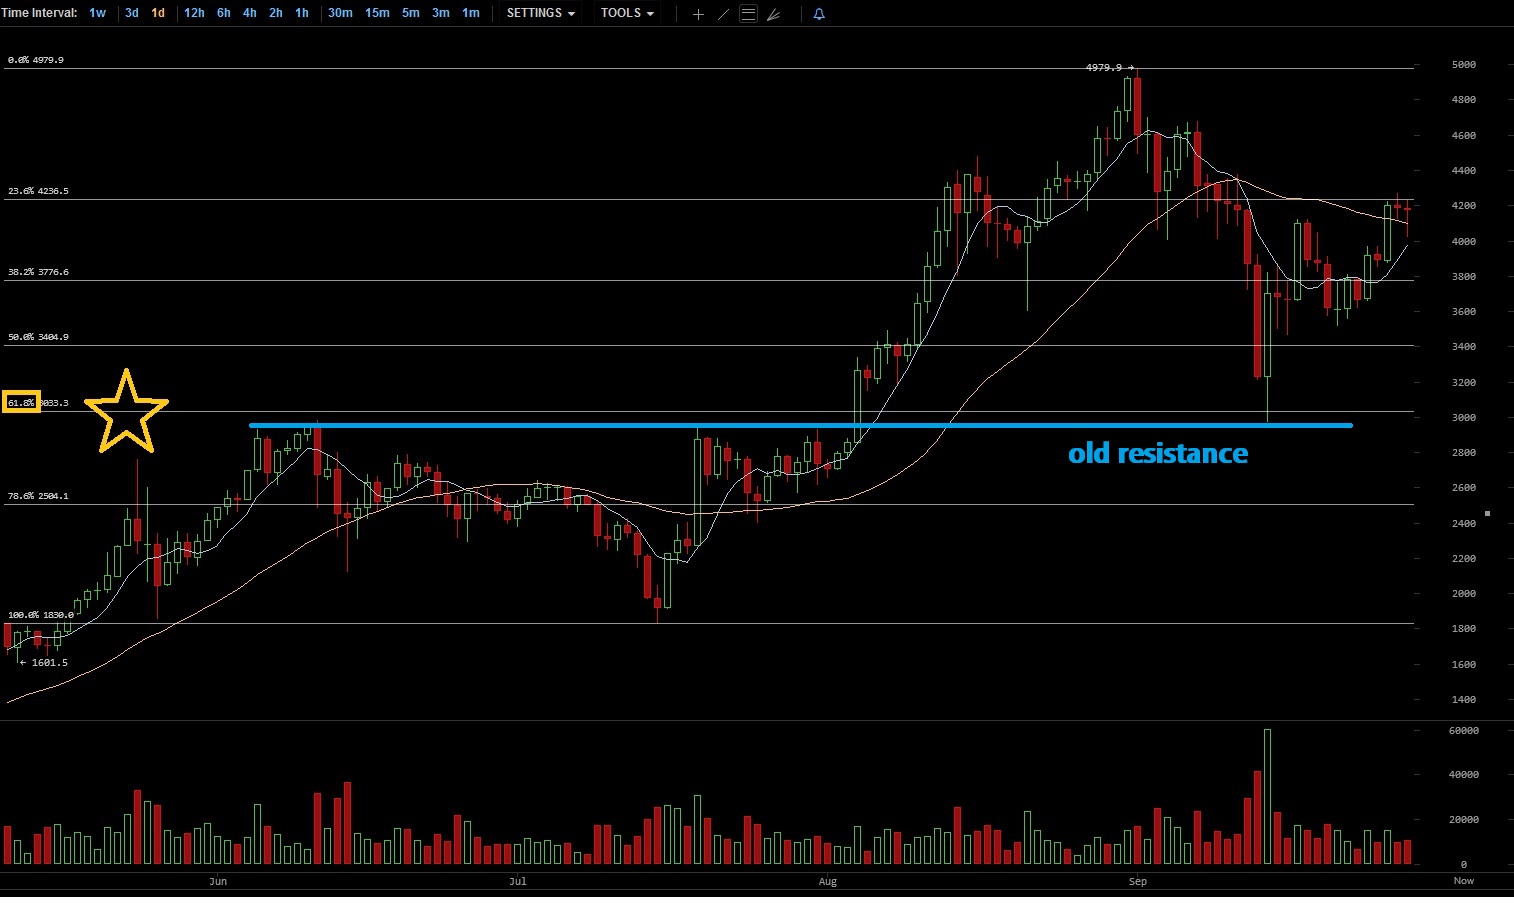
One of the most interesting components of the Index Model is its historic ability to predict the initial direction of movement in the S&P 500. Using a simple ATR(14) band as an objective means of testing the predictions, the bias generated by the model has predicted with a 66.4% probability which band will be tagged first. For example, the upcoming week has a high band at 2526.25 and a low at 2507.25. The S&P 500 has a ‘strong bull’ bias heading into next week. That means there is a 66.4% probability we go lower first and tag 2507.25 before 2526.25.
Pair the above statistic with the model generating an extreme Rose Colored Sunglasses bullish bias, which simply expects a calm, sideways drift, and you have logical reason to buy into weakness early next week—should we see it.
Anyways, we are all feeling rather generous on this cool, first day of October. Therefore the entire 150th Strategy Session is reproduced below, in completion.
Before you have a read of it, a quick reminder that this Tuesday, October 3rd from 5:30-7pm there will be a free investors conference in Detroit hosted by RAUL, the team of scientists, and the head scientist. One of us will also be on iBankCoin YouTube live around 5:45pm doing a 30-minute live presentation where the 3rd installment of our top-down portfolio will be built. If you live near Detroit, click here to RSVP and come to the event. Otherwise, subscribe to our YouTube channel to be updated when I go live. Or, just keep an eye on this blog for a replay of the event. Full disclosure, our YouTube channel does post political content. So if you are not trying to see political videos, then just keep an eye on this blog and I will post a link to just the demonstration video.
Without further adieu, here is the 150th Strategy Session, enjoy!
I. Executive Summary
Raul’s bias score 3.83, Medium Bull*. Look for a sideways drift into the new month, perhaps slightly working to the upside. The third reaction to Friday’s non-farm payroll data may dictate direction into the weekend.
*extreme Rose Colored Sunglasses e(RCS) bullish bias triggered, see Section IV
II. RECAP OF THE ACTION
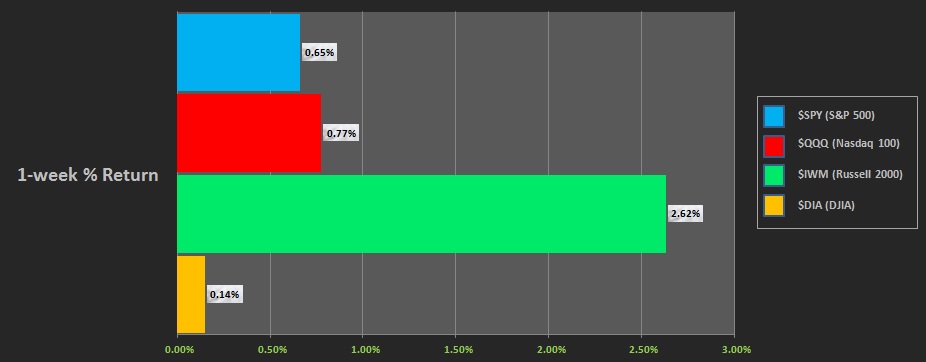
Monday the equity markets were for sale, working lower and ultimately discovering a strong responsive bid. Then we spent the rest of the week working higher. The Russell was especially strong, suggesting risk appetite is strong.
The performance of each index can be see below:
Rotational Report:
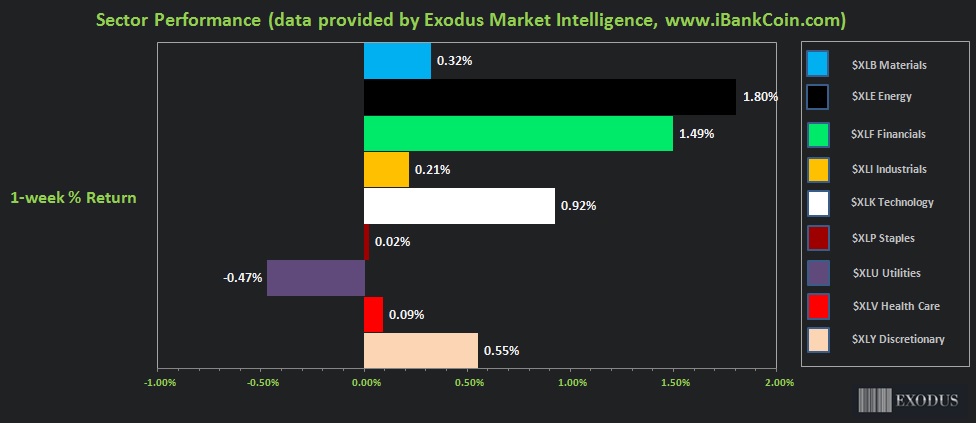
Energy and financials lead the way while tech is a nearby flank. Utilities weak.
Bullish
For the week, the performance of each sector can be seen below:
Concentrated Money Flows:
Exodus [PPT 2.0] streamlines how we can research the individual behavior of each industry and how it pertains to overall market sentiment.
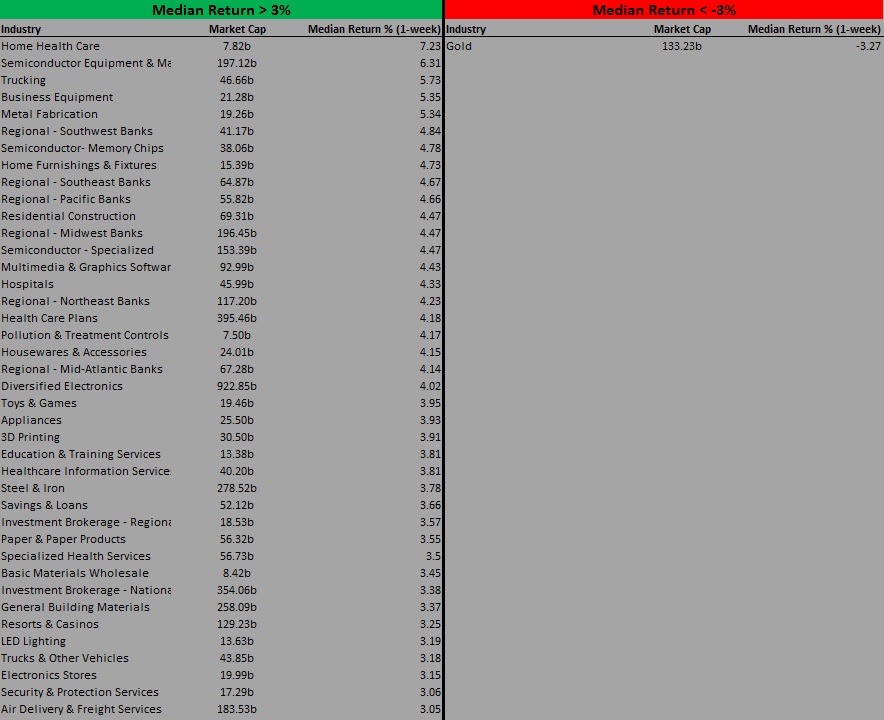
Using the Industries screen, we can filter for the Median Return [1 week] of each industry. I have established an arbitrary -/+ 3% cutoff for qualifying industries of interest.
Money flows skewed heavy to the buy side. Only gold on the sell.
Bullish
Here are this week’s results:
III. Exodus ACADEMY
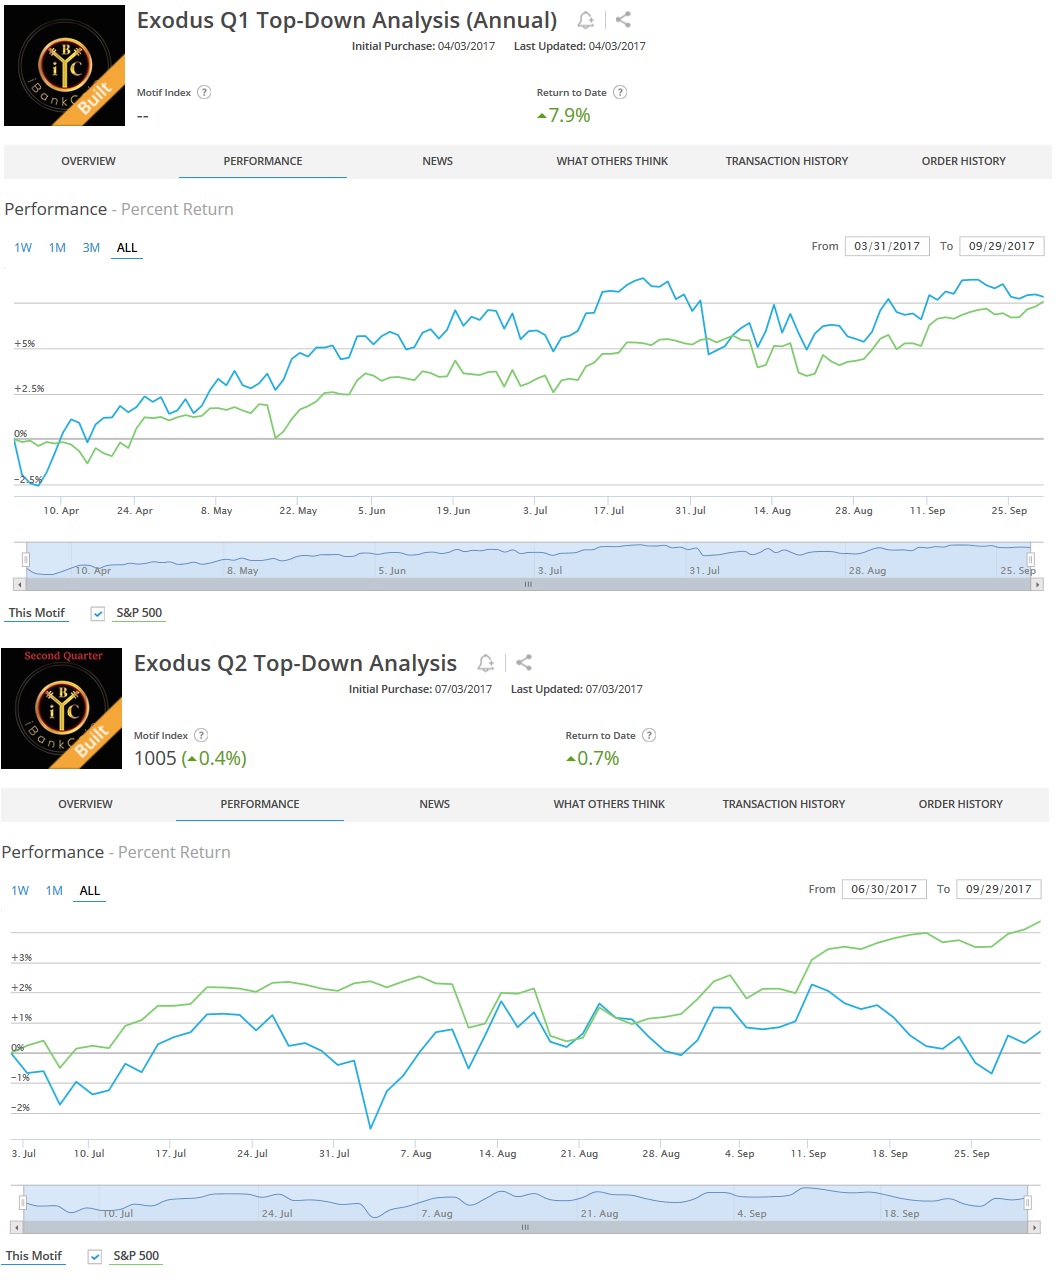
Q3 top-down systematic portfolio build
The 9-month return column available on the screener is a useful tool for evaluating performance over the last three quarters. It is a key component of building the Q3 top-down basket.
Note: The next two sections are auction theory.
What is The Market Trying To Do?
Week ended searching for sellers.
IV. THE WEEK AHEAD
What is The Market Likely To Do from Here?
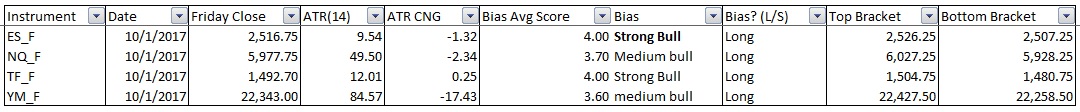
Bias Book:
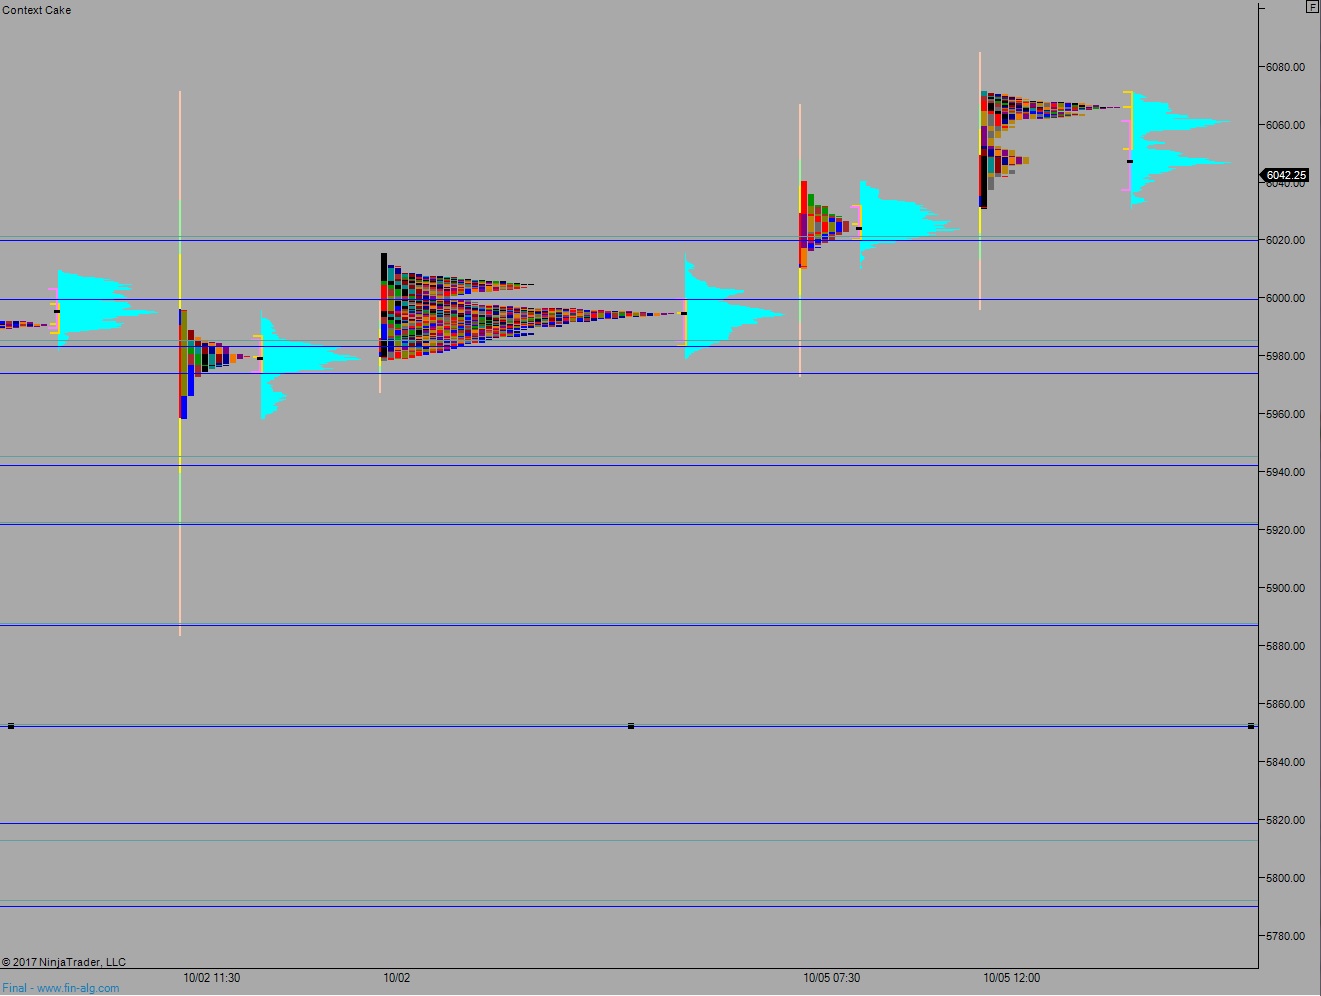
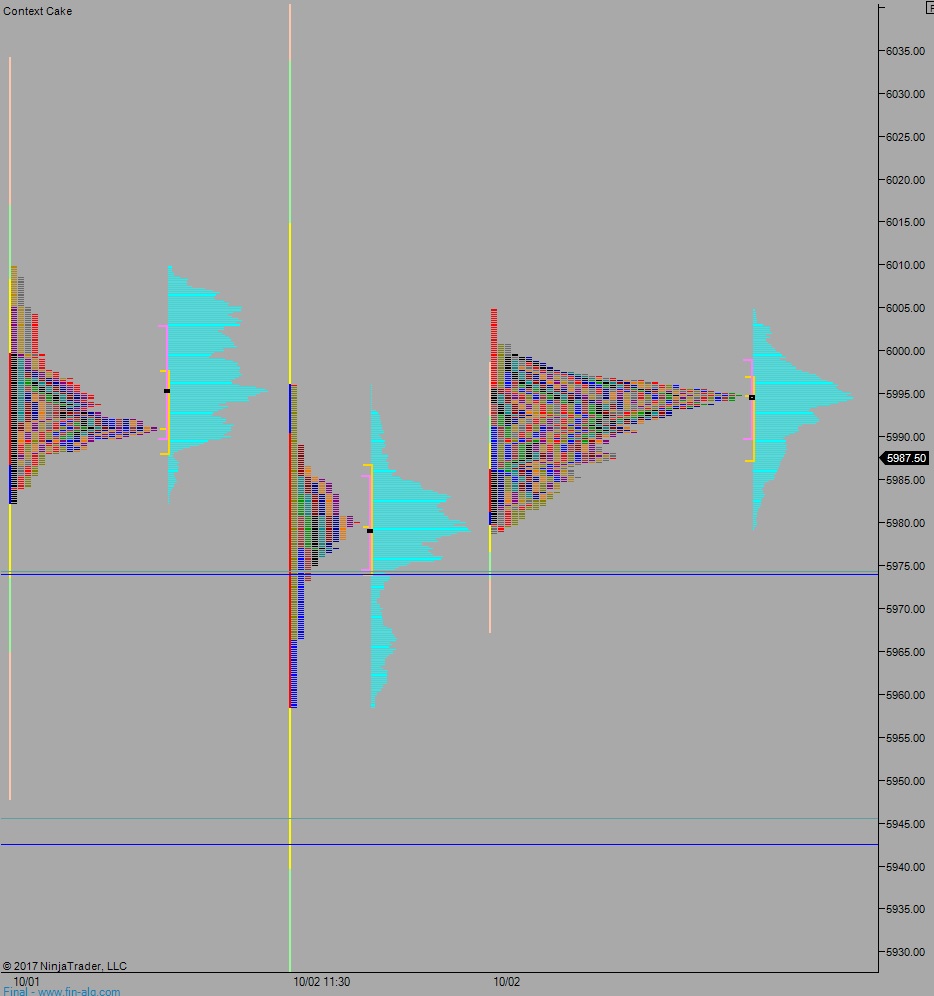
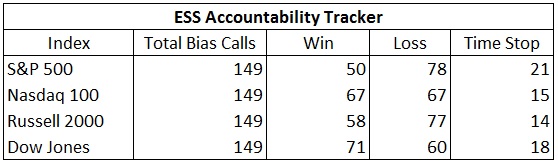
The following biases were formed using basic price action and volume profile analysis. By objectively observing these actual attributes of the market we gain a sense of the overall market context. To quantify the effectiveness of this approach, each of the 4 equity indexes (/ES, /NQ, /YM, and /TF) has been assigned a fixed long/short target using a standard 14-period ATR. Each week there will be an outcome of win, loss, or timed stop on all four indexes. The first bracket level hit is deemed the winner in the event that both sides are tagged. This will be tracked and included in the Exodus Strategy Session.
Here are the bias trades and price levels for this week:
[Note: All levels are as quoted on the front month future contract (currently December 2017) by the IQFeed Data Servers. Prices may differ slightly from your data provider. If you do not have a platform which provides real-time futures quotes, please click here for a free (but limited) alternative.]
Here are last week’s bias trade results:

Bias Book Performance [11/17/2014-Present]:
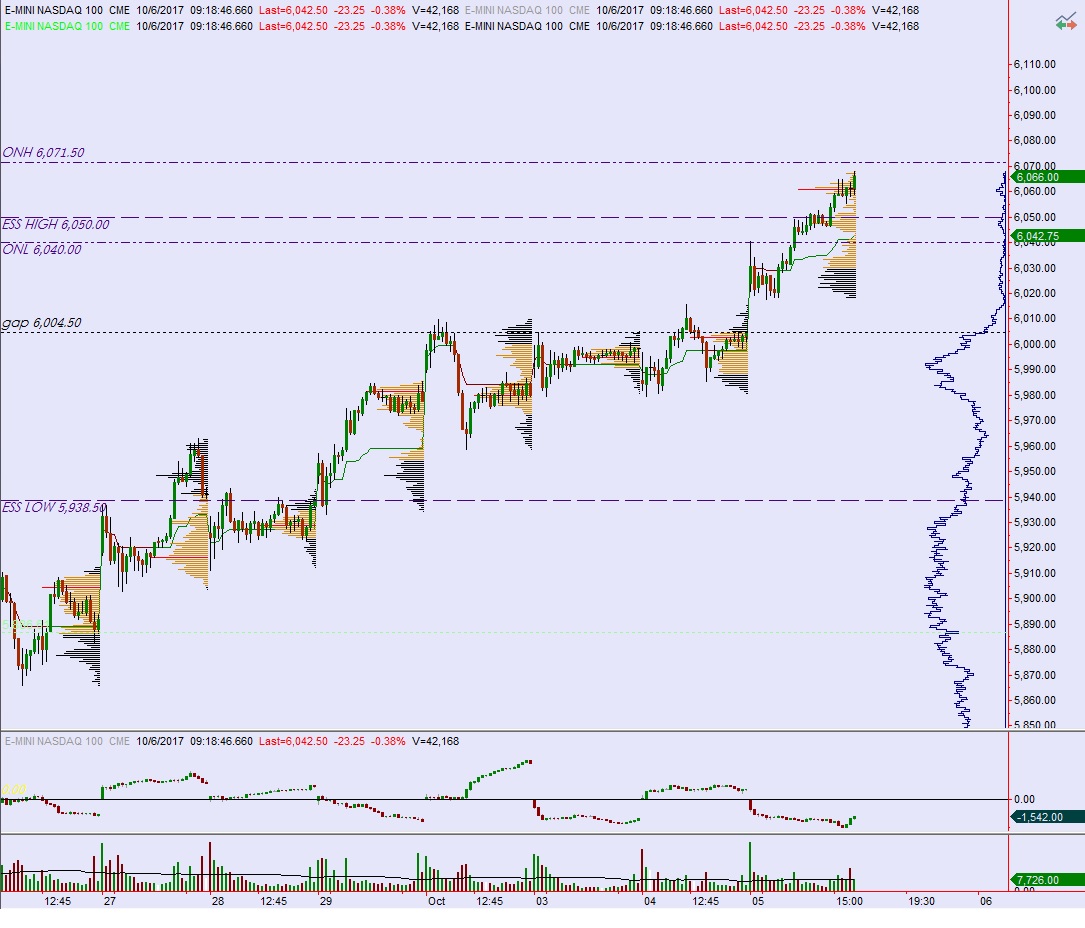
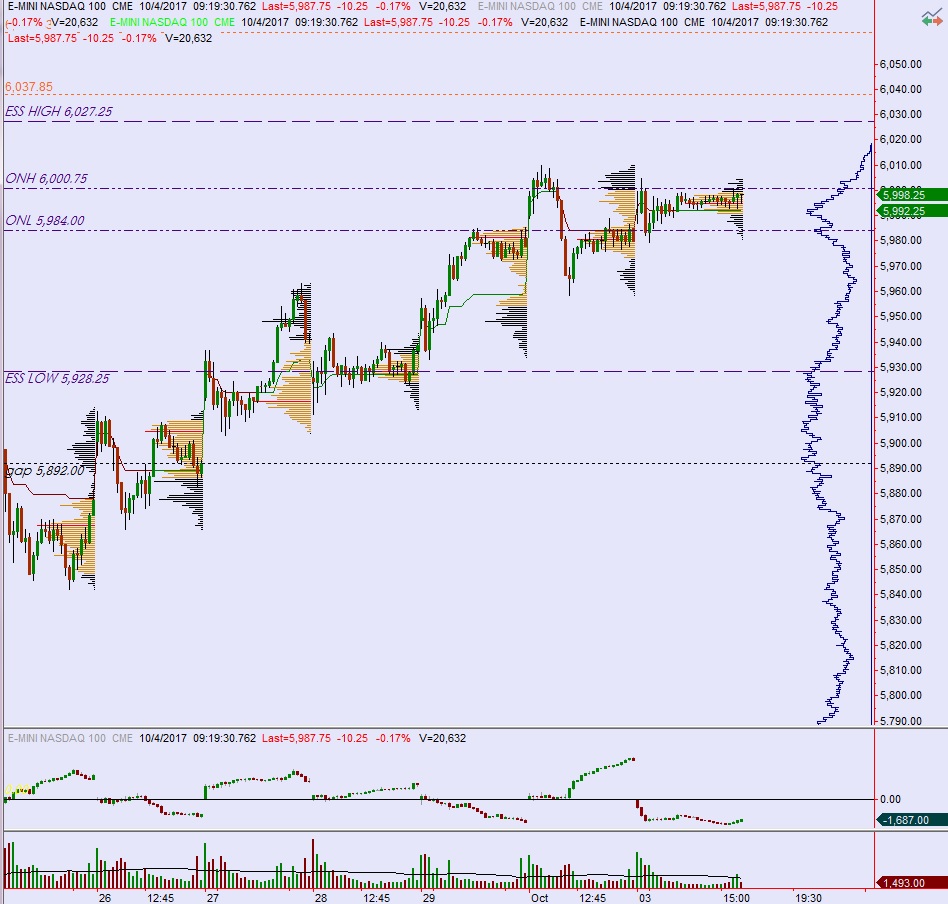
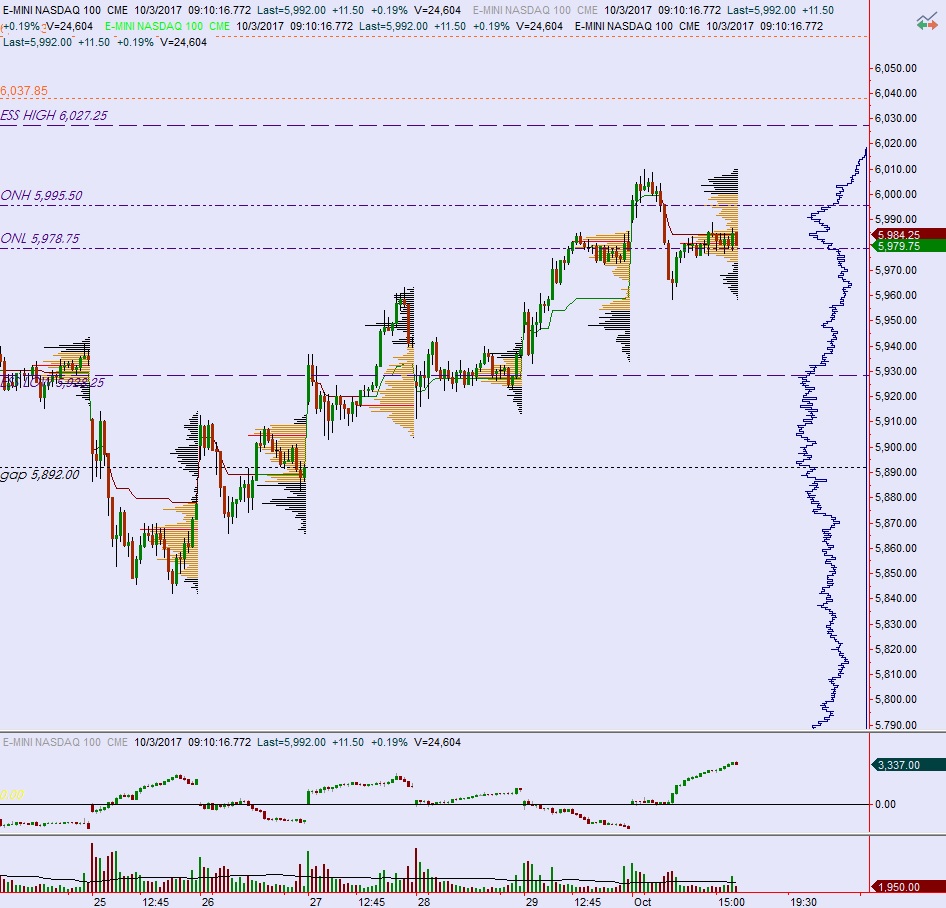
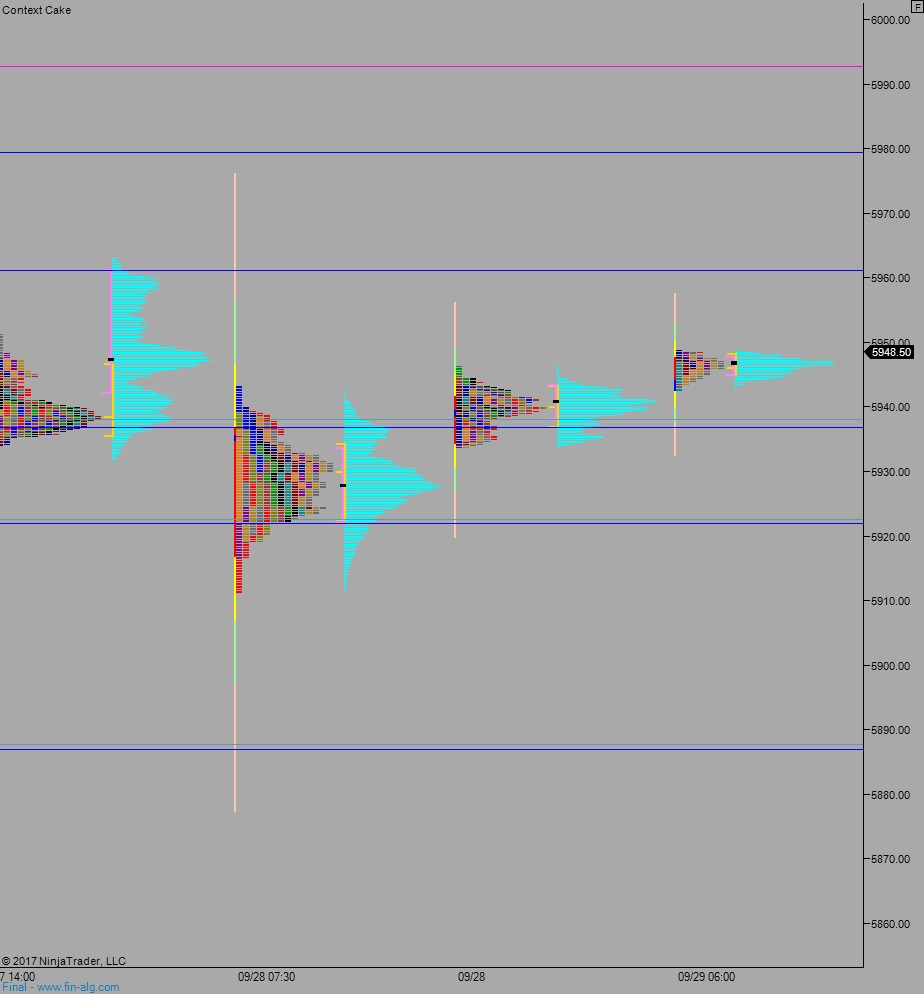
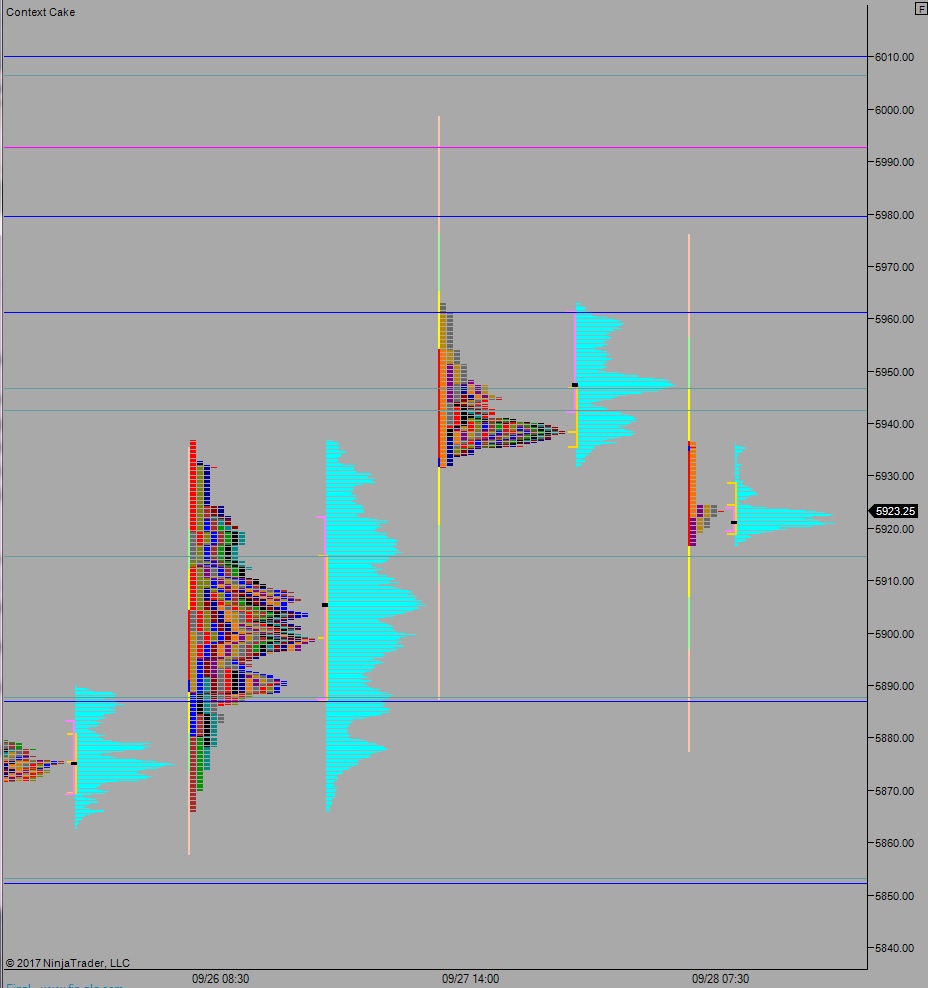
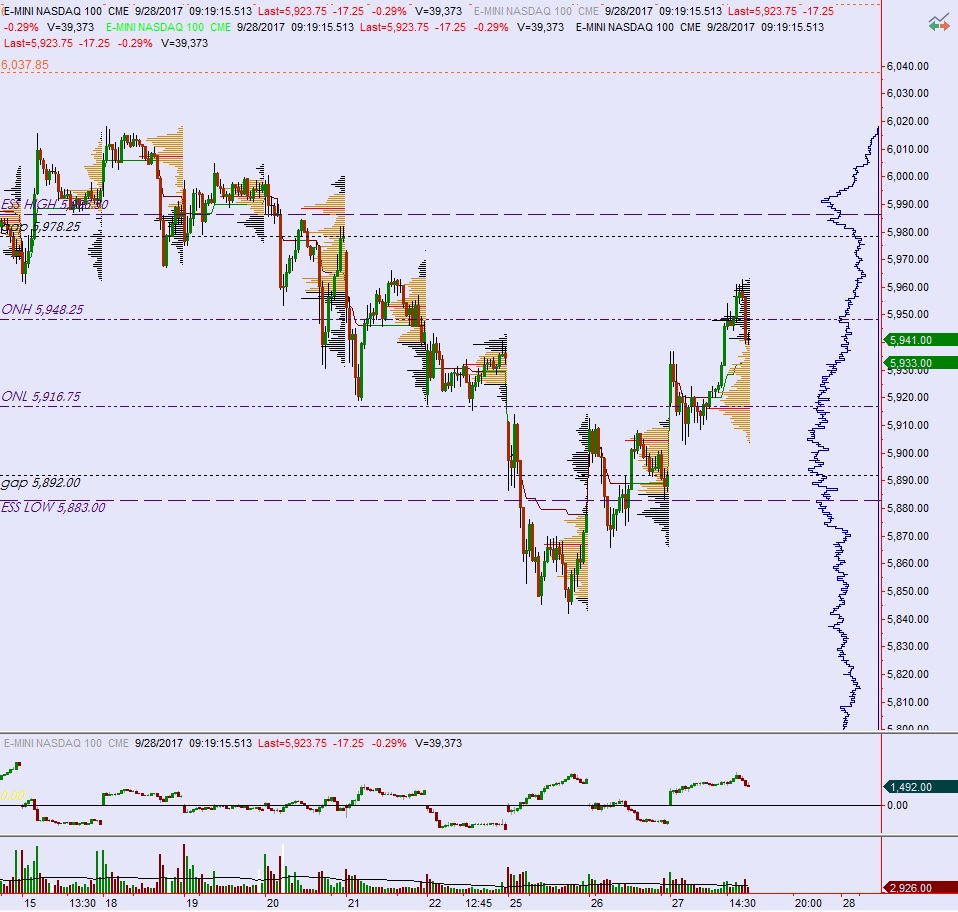
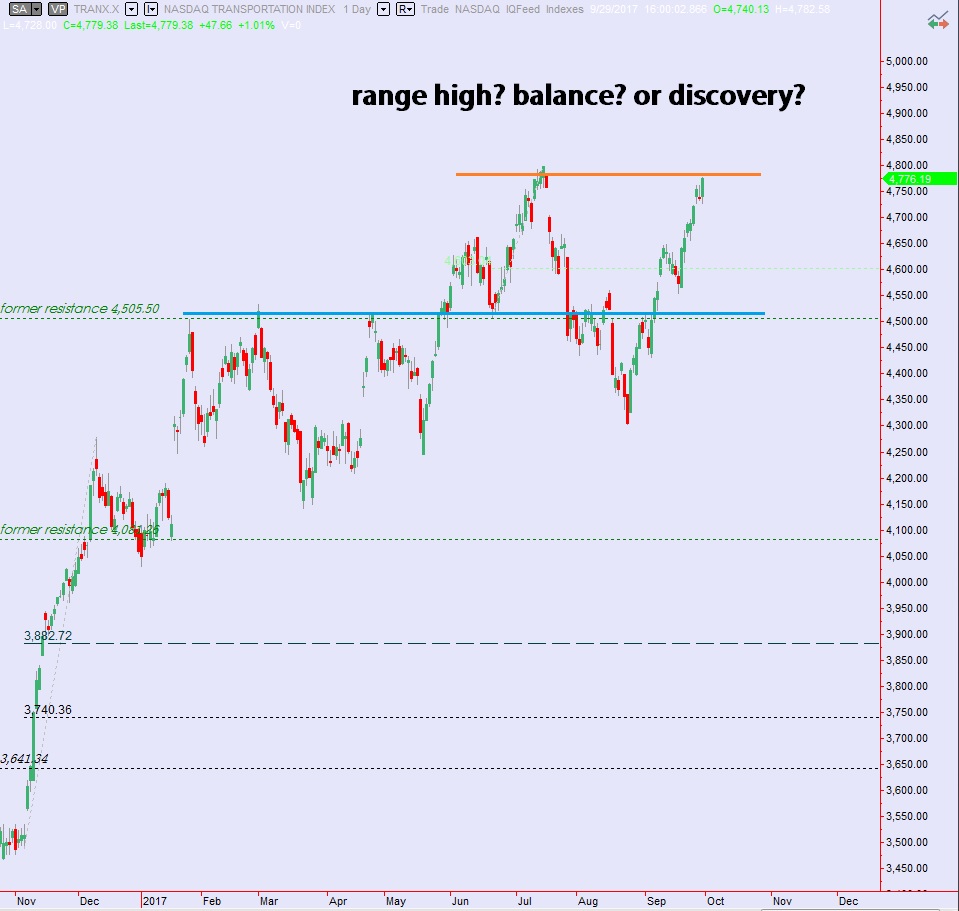
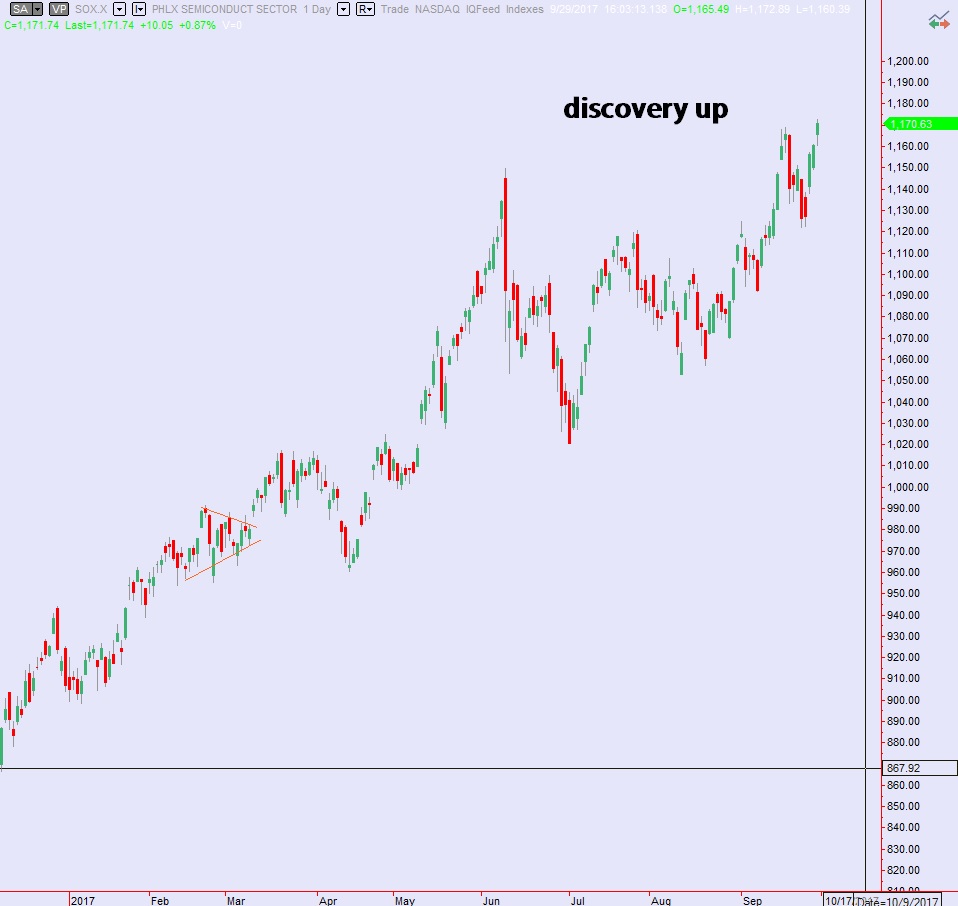
Compression Watch: Semiconductors succeed in discovery, transports not far behind
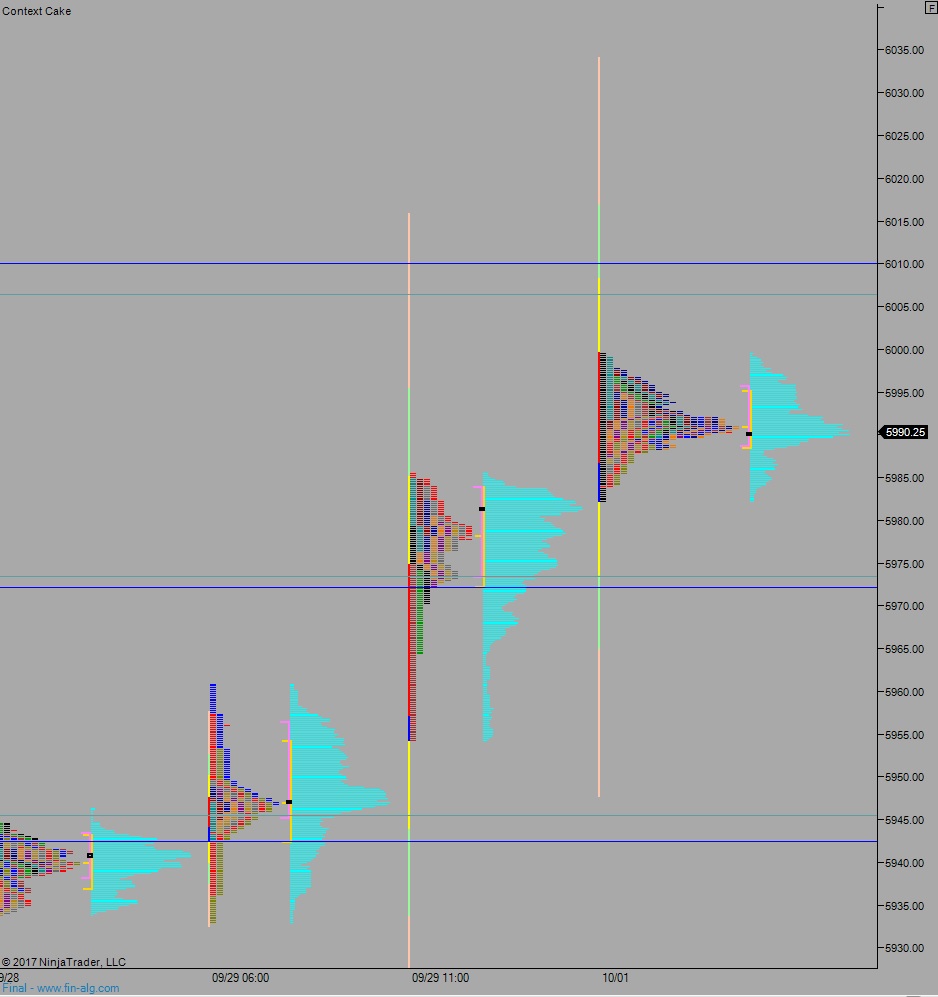
Markets fluctuate between two states—balance and discovery. Discovery is an explosive directional move and can last for months. In theory, the longer the compression leading up to a break, the more order flow energy to push the discovery phase.
We are monitoring two instruments, the Nasdaq Transportation Index and the PHLX Semiconductor Index.
Transports still appear to be attempting discovery higher. There is not much resistance left to keep the market in balance.
See below:
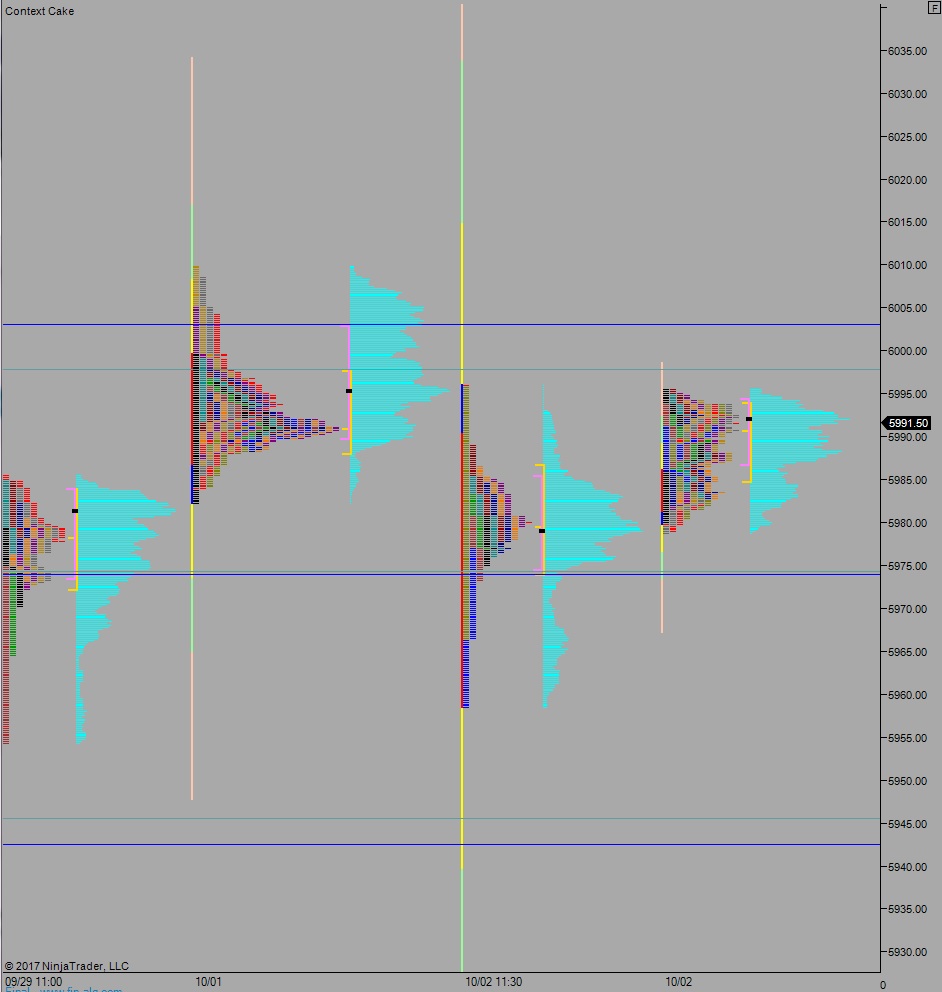
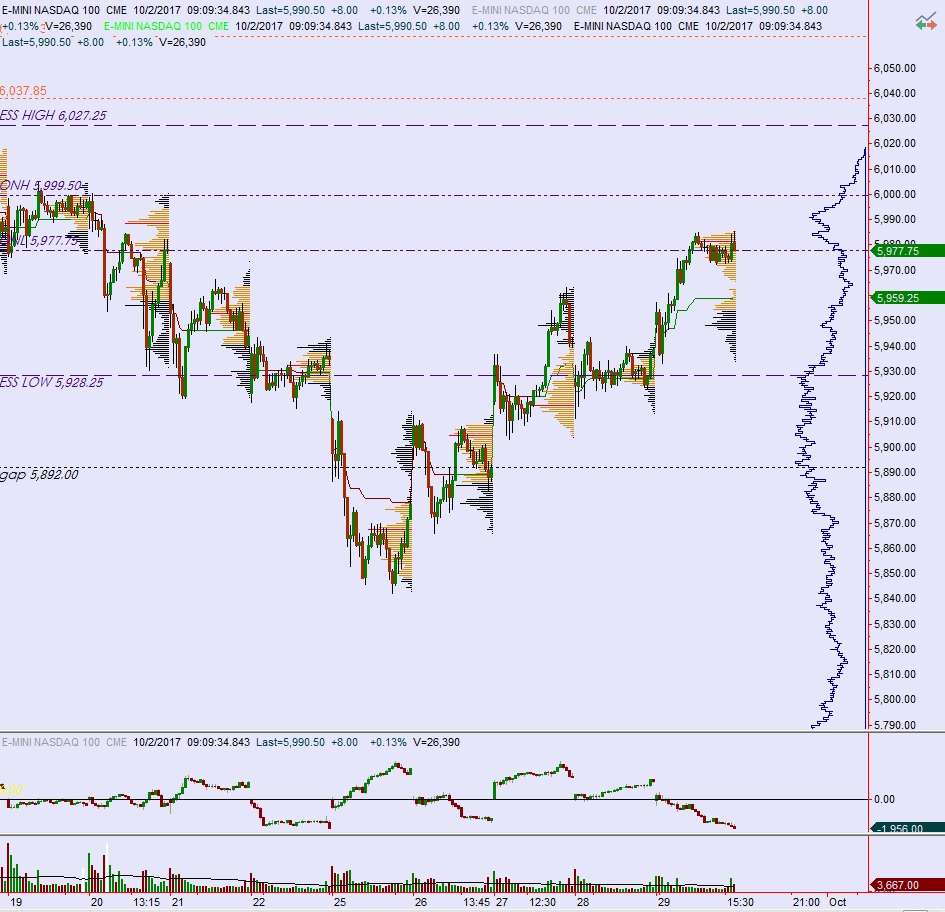
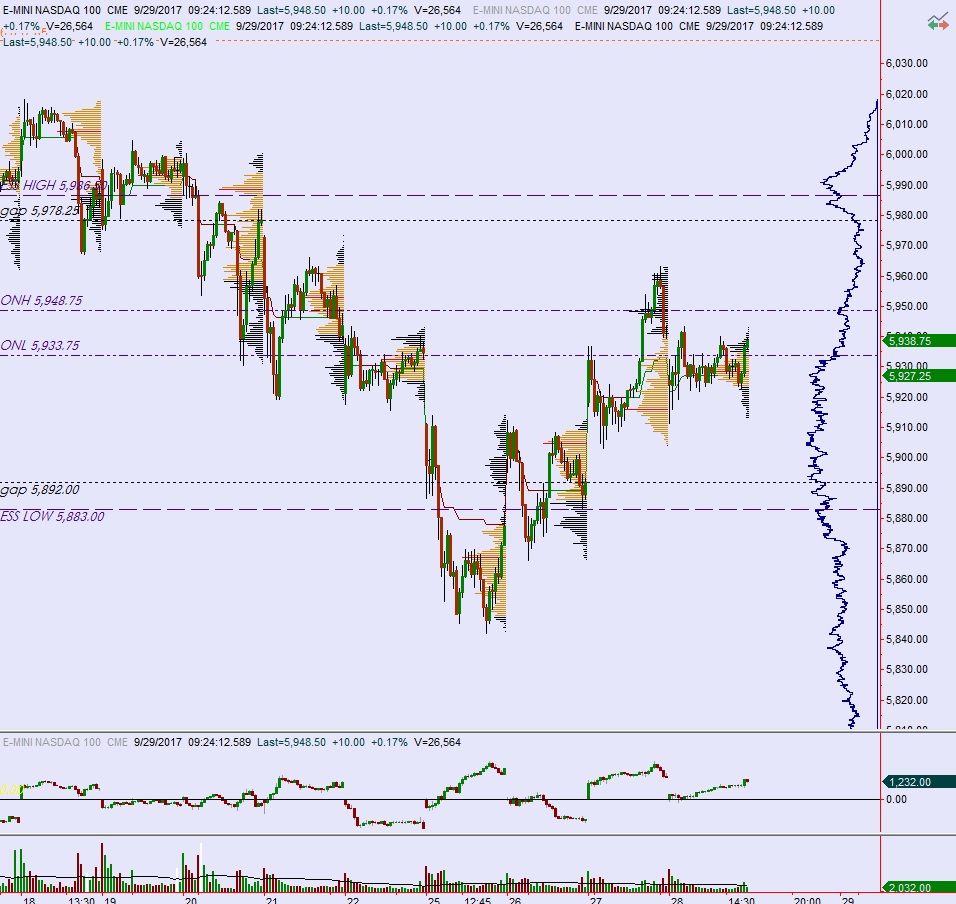
Semiconductors are discovering higher. The powerful, year-long rally continues.
See below:
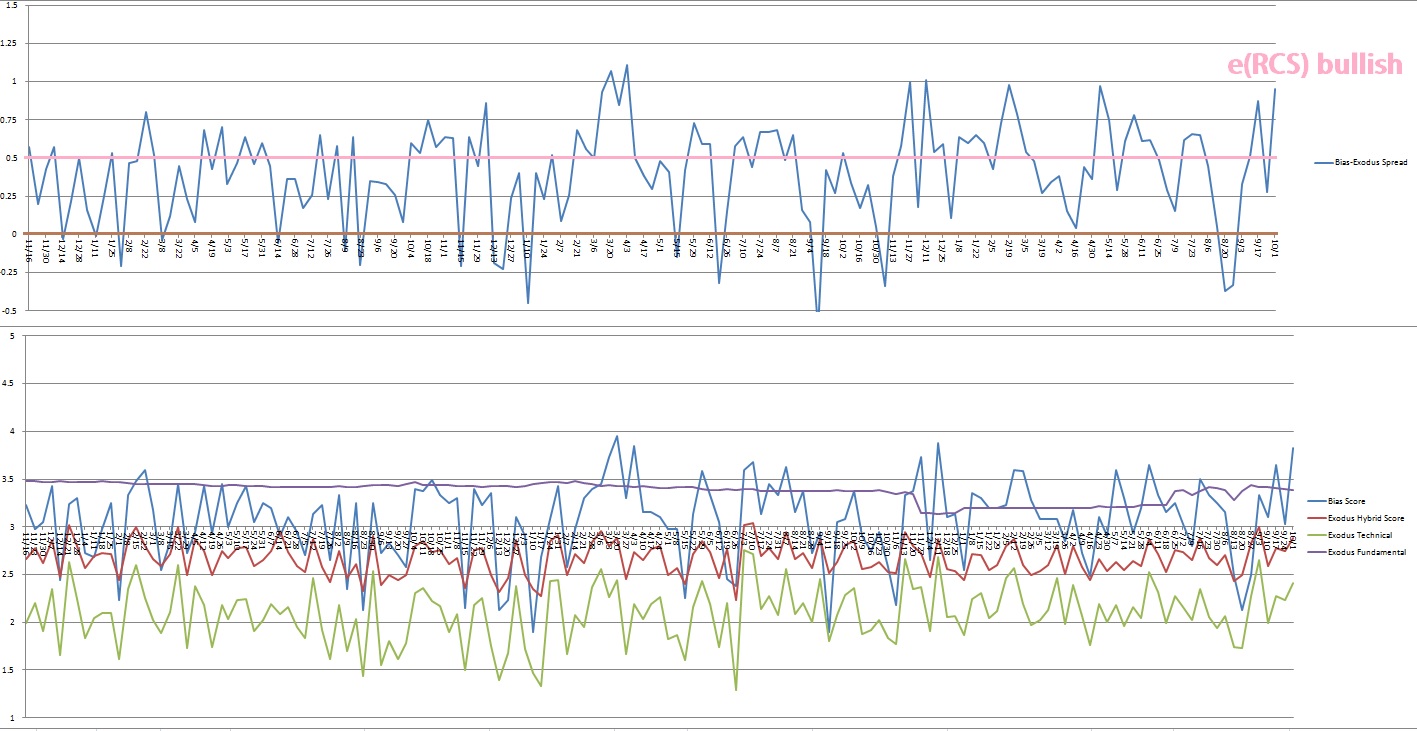
V. INDEX MODEL
Bias Model: extreme Rose Colored Sunglasses
Model is showing extreme rose colored sunglasses into next week. This signal expects a calm, sideways drift perhaps with a slight upward bias.
Here is the current spread:
VI. QUOTE OF THE WEEK:
“I saw an angel in the block of marble and I just chiseled until I set him free.” – Michelangelo
Trade simple, refine your process only as needed
Comments »