iBankCoin
Home / Market Profile (page 141)

Market Profile

Building Expectations for The Day

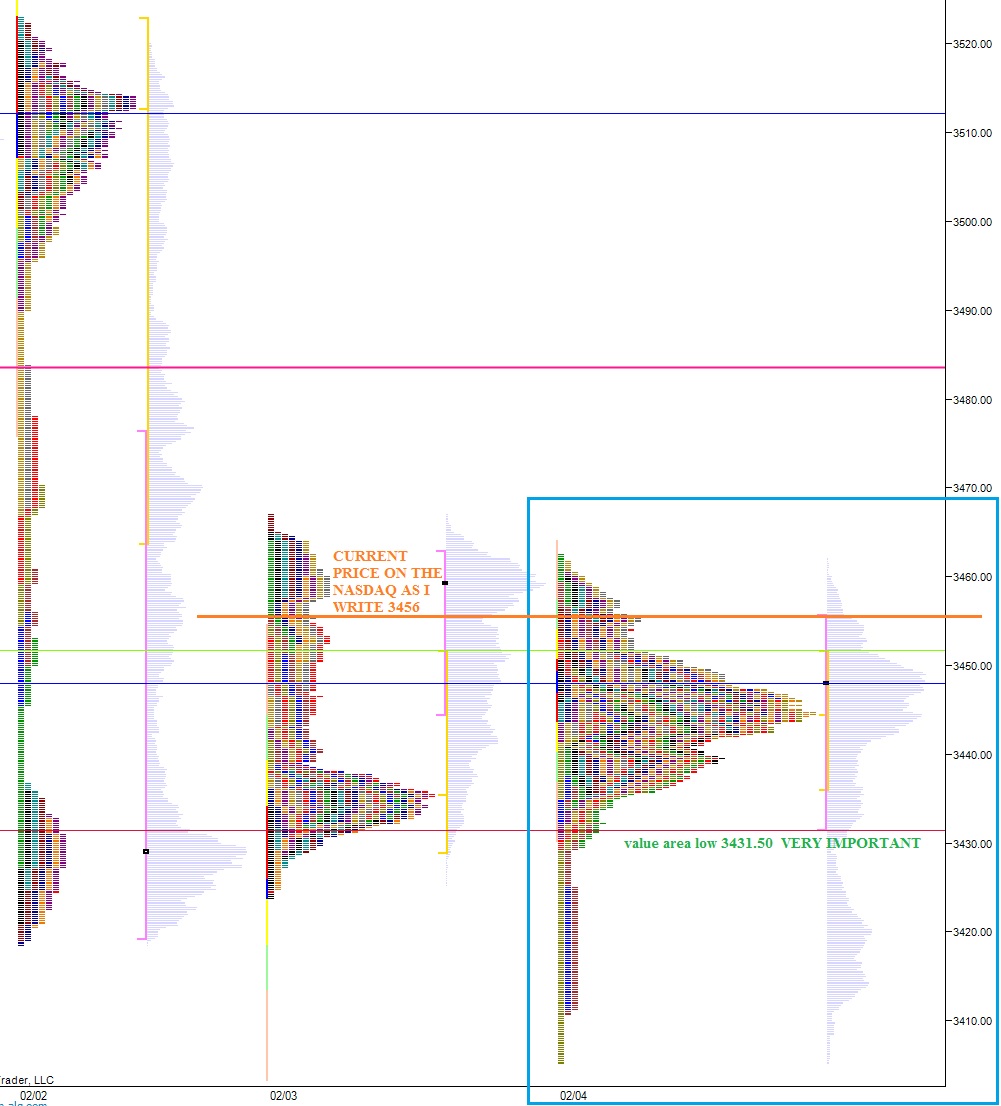
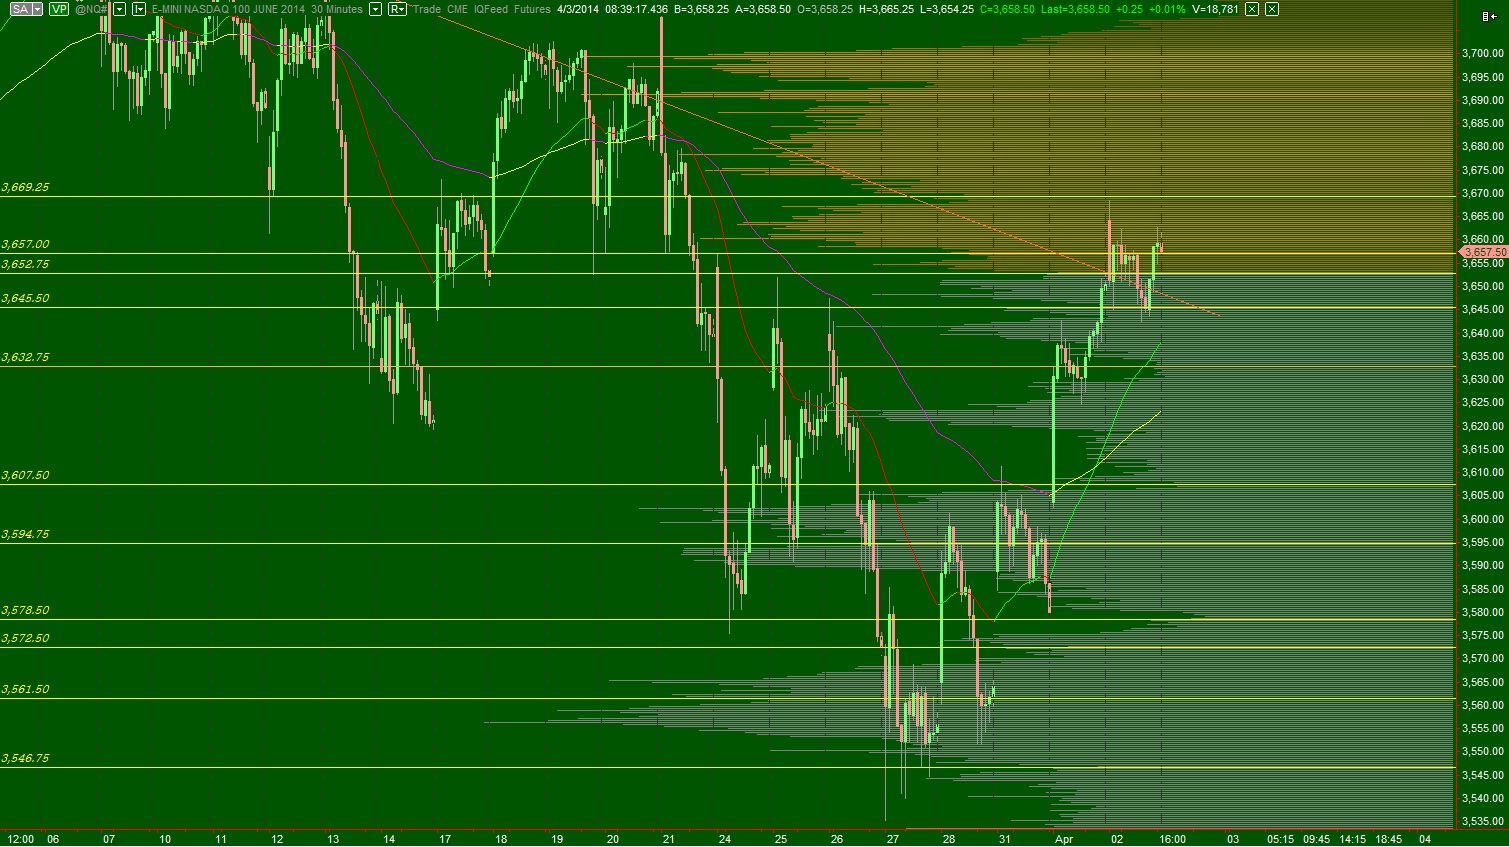
NASDAQ futures worked higher overnight building upon the afternoon strength buyers were able to muster.  The responsive buying ignited soon after price took out the year-to-dates lows on the /NQ contract.  Instead of the new lows bringing more sellers into the marketplace, we saw volume dry up at the levels and then a sharp response from buyers.  The bounce that materialized has the potent look of a durable swing low for the next few trading days.

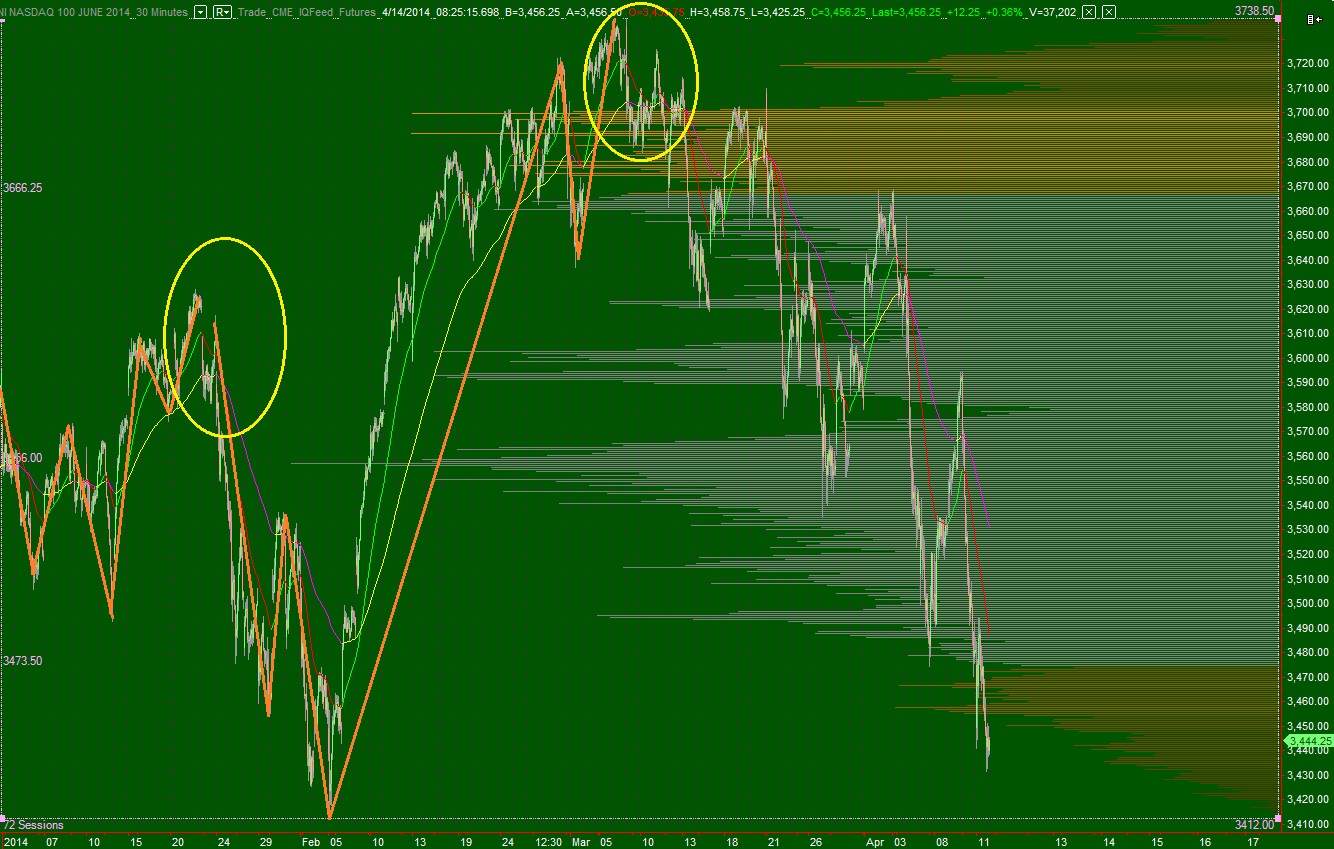
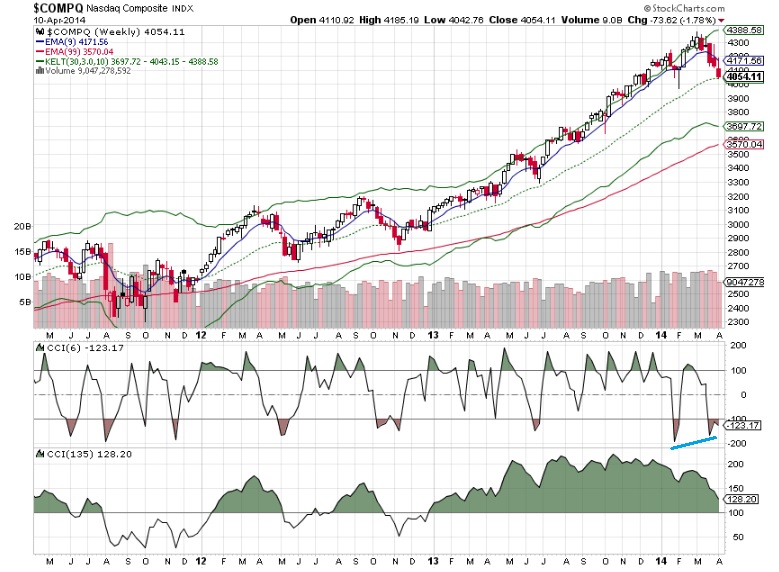
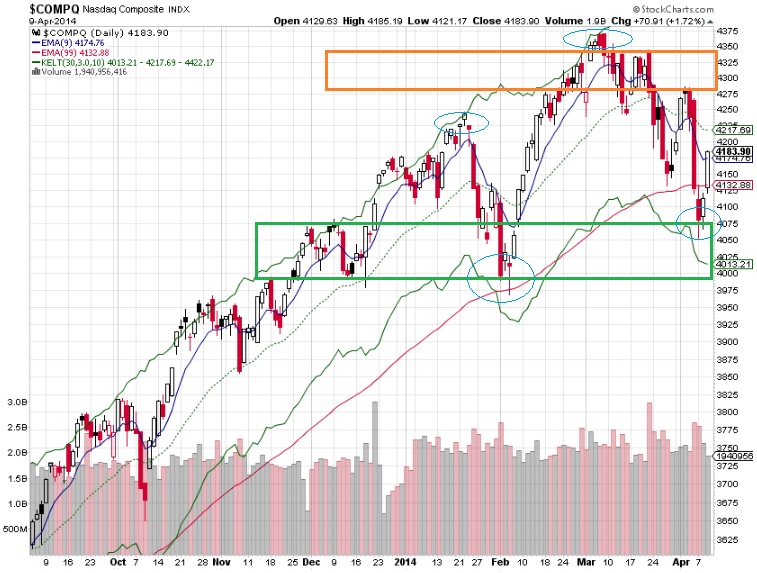
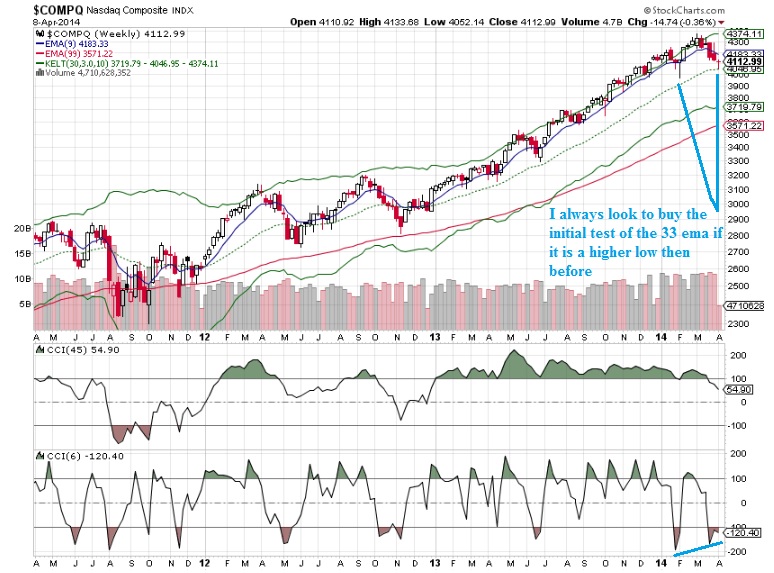
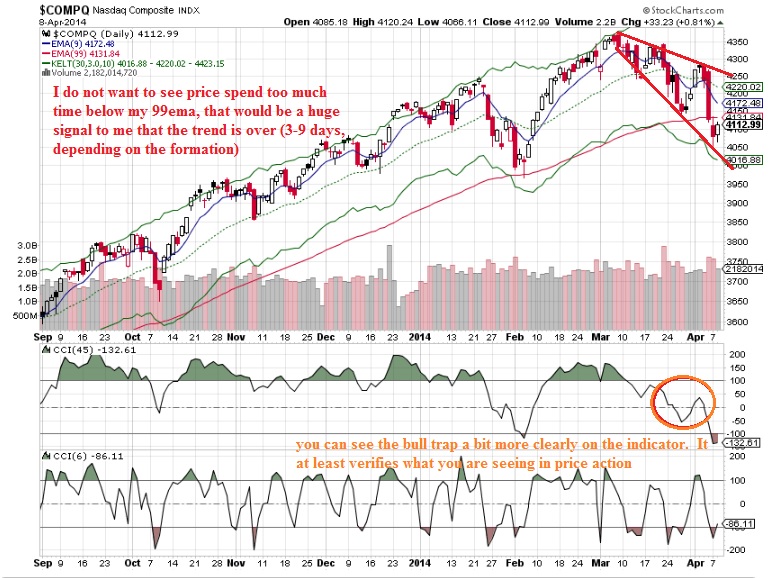
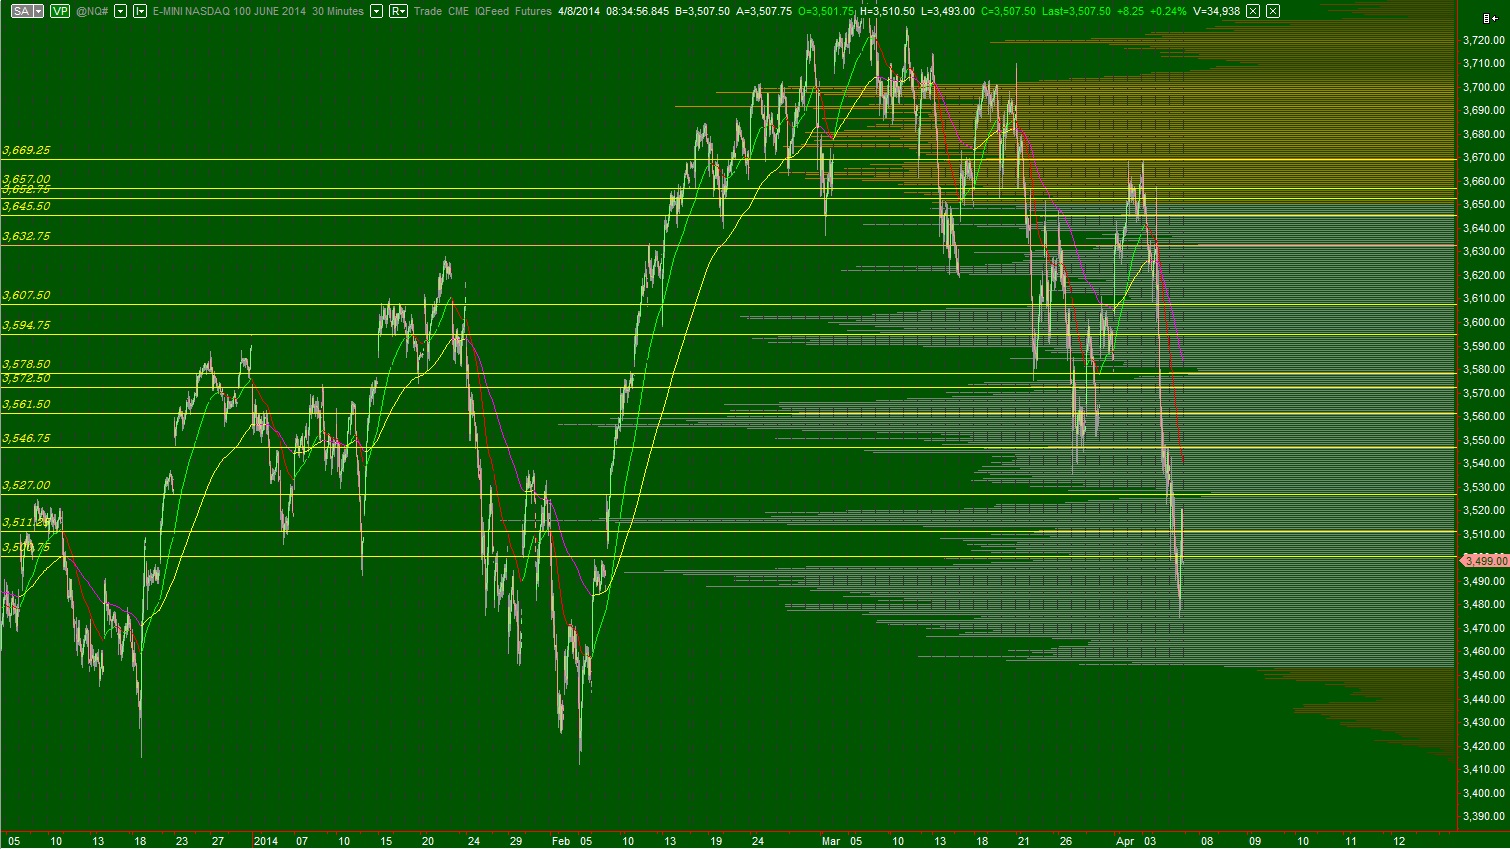
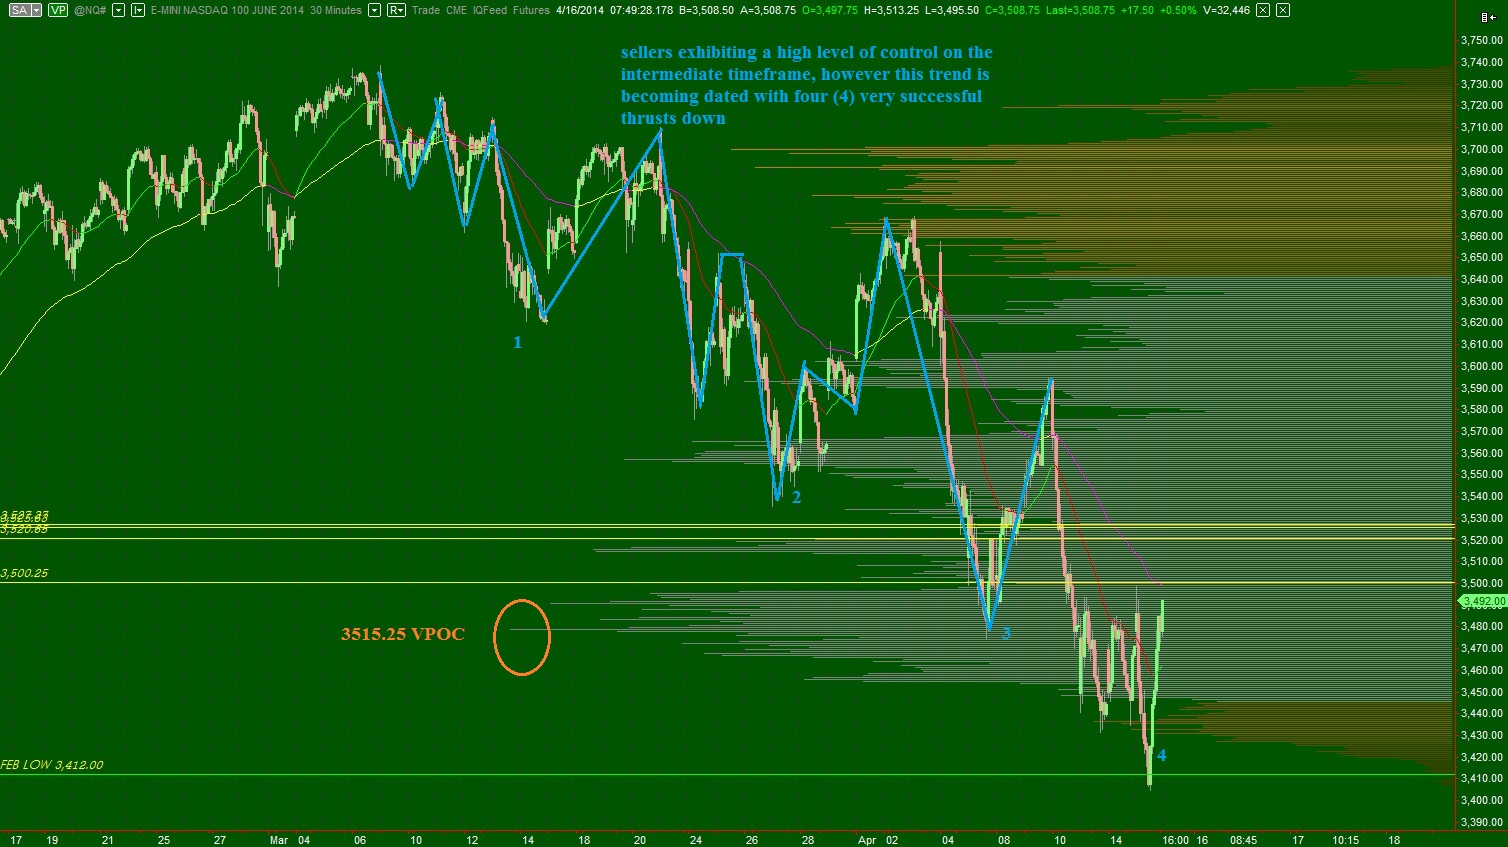
The long term auction has been disrupted after being controlled by the buyer for over a year.  Today the picture of the NASDAQ composite has changed a bit.  I perceive the long term auction as in balance which dates back to November 11th, or 11/11/13.  I do not choose these dates at random but instead observe the past market activity and how it relates to our newly revealed information.  My largest moving average (99EMA) is starting to turn lower on the daily chart but we do not have clear alignment of the moving averages which would add to a case for seller control.

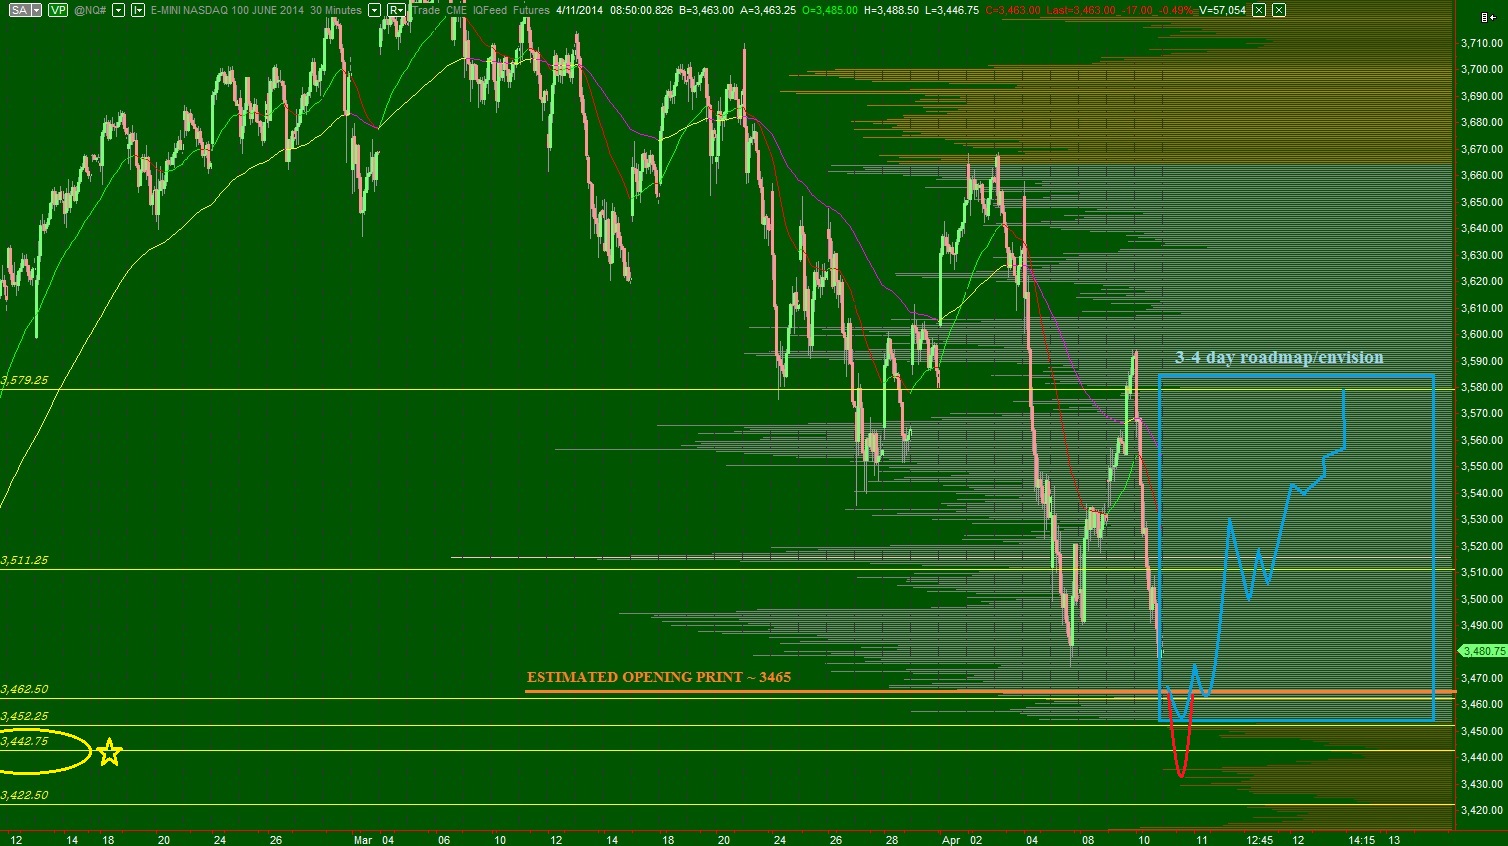
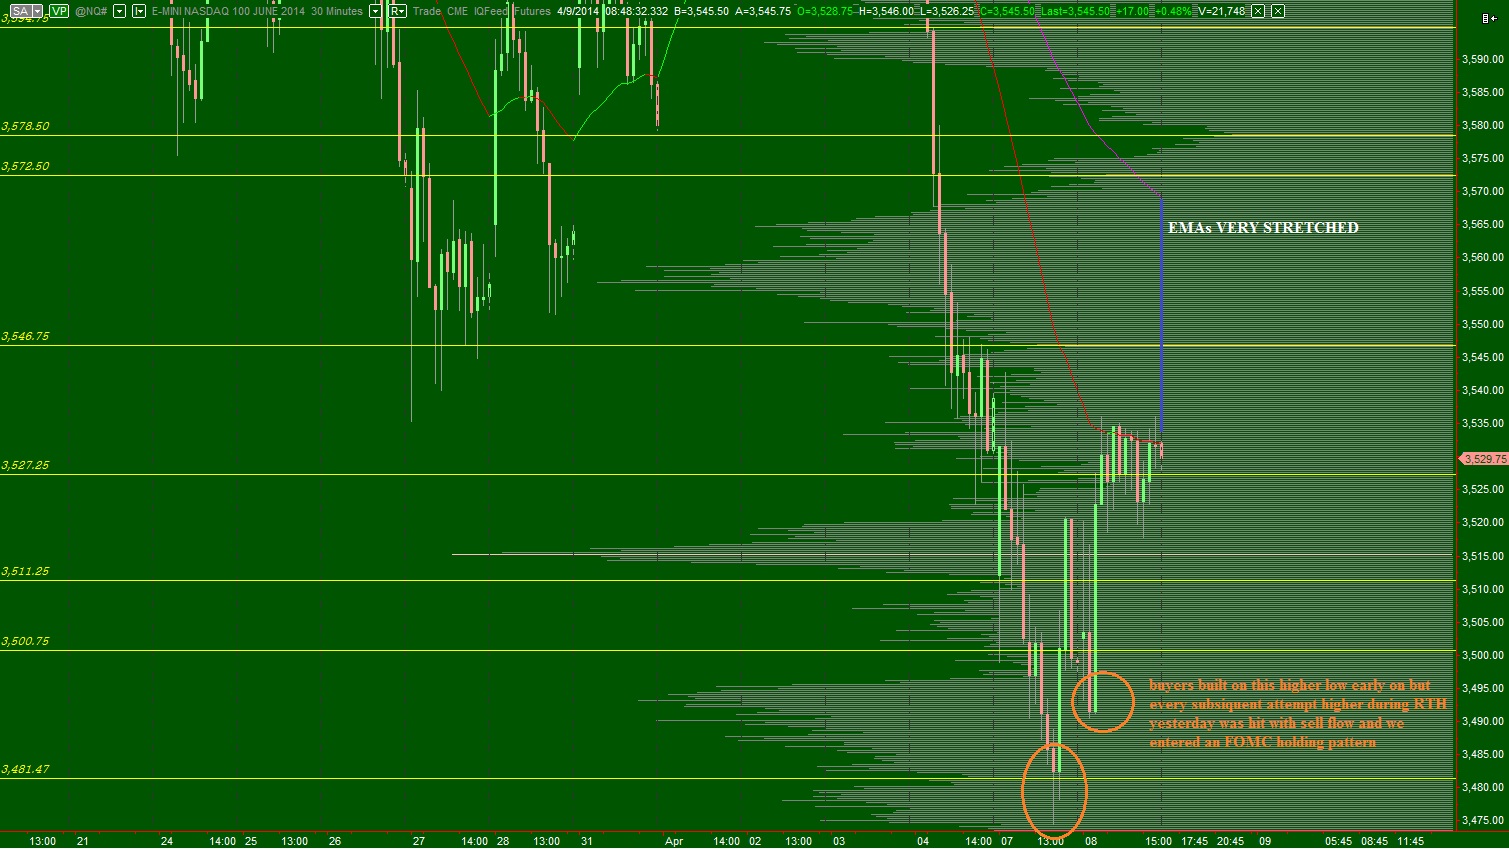
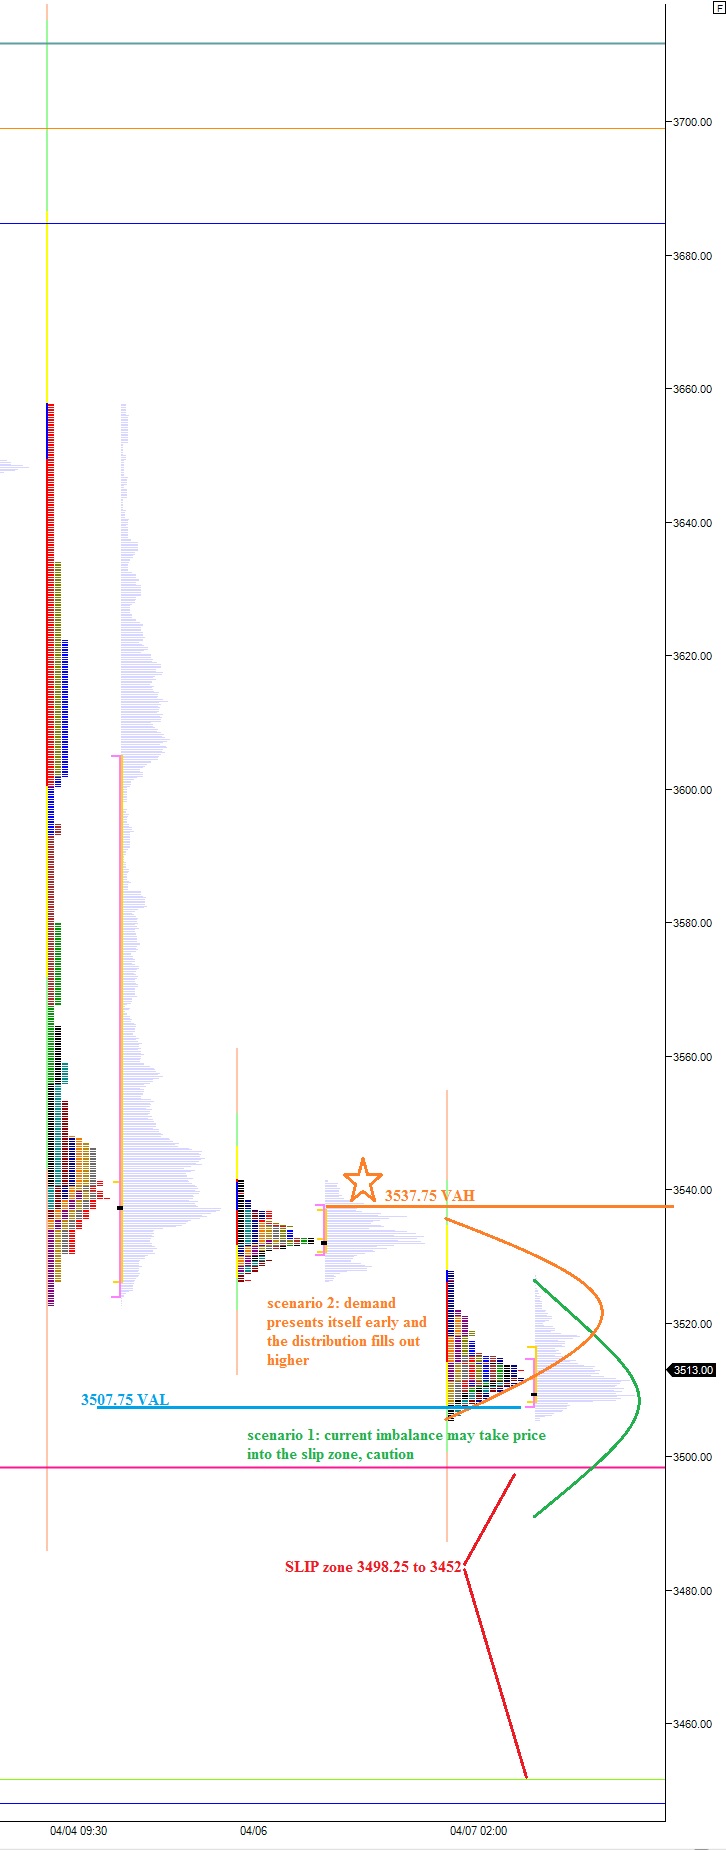
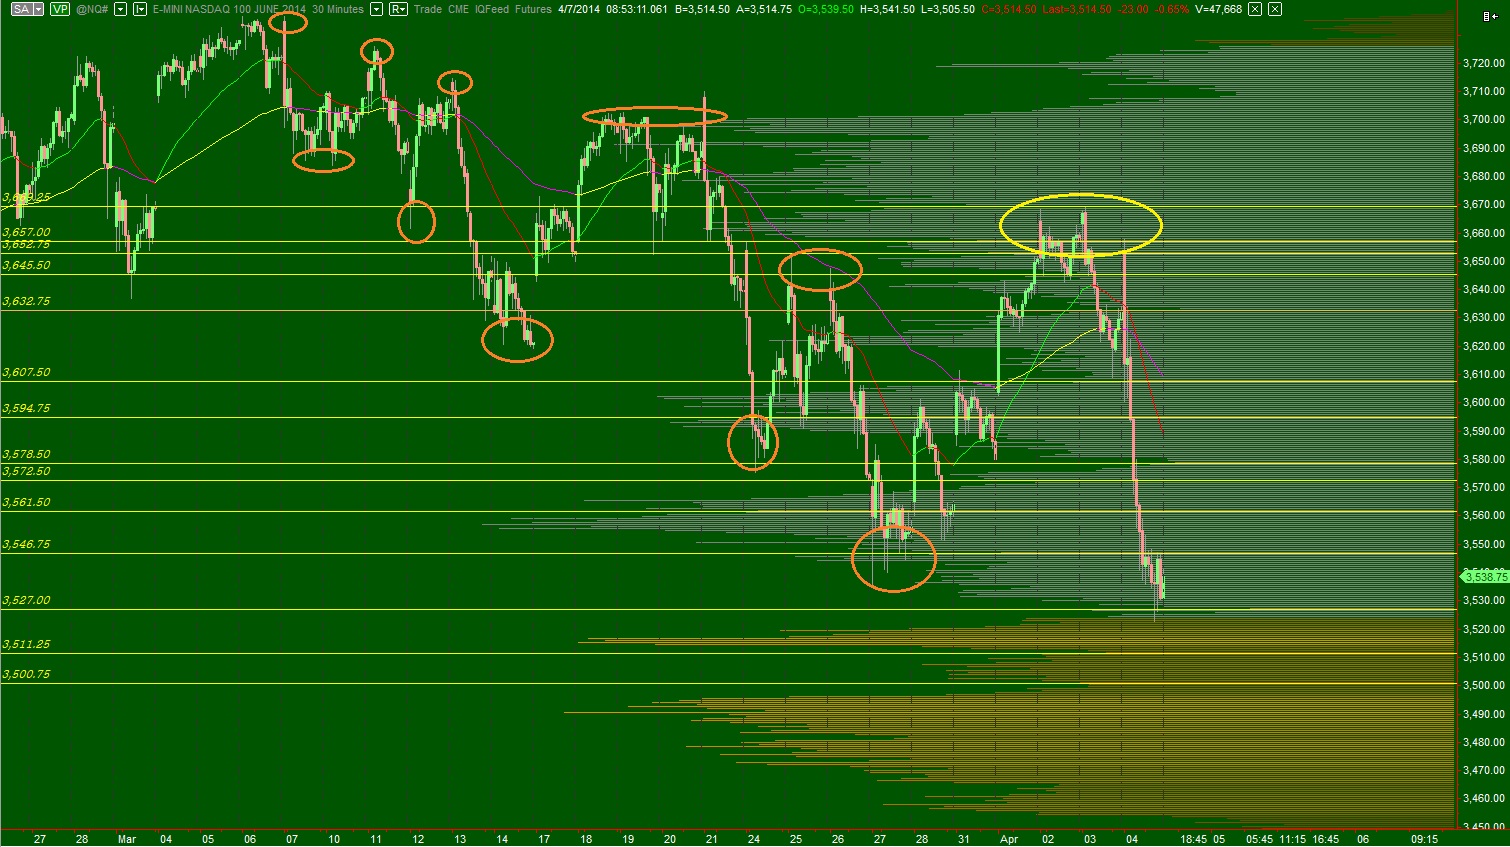
I have built the intermediate composite volume profile to span from 11/11 to today so we can observe the volume taking place inside the auction.  It is hard to see, but 3515.25 is the volume point of control or the largest tip on the profile.  These are prices that both buyers and sellers consider fair and we conduct large amounts of trade at.  My goal currently is to sell some of my swing long exposure above this level.  Intraday, if I see price building acceptance above this level then I will look to trade a long beyond it.  I have highlighted this level was well as my swing trade targets on the following intermediate term profile:
NQ_VolumeProfile_intermediateTerm_04162014

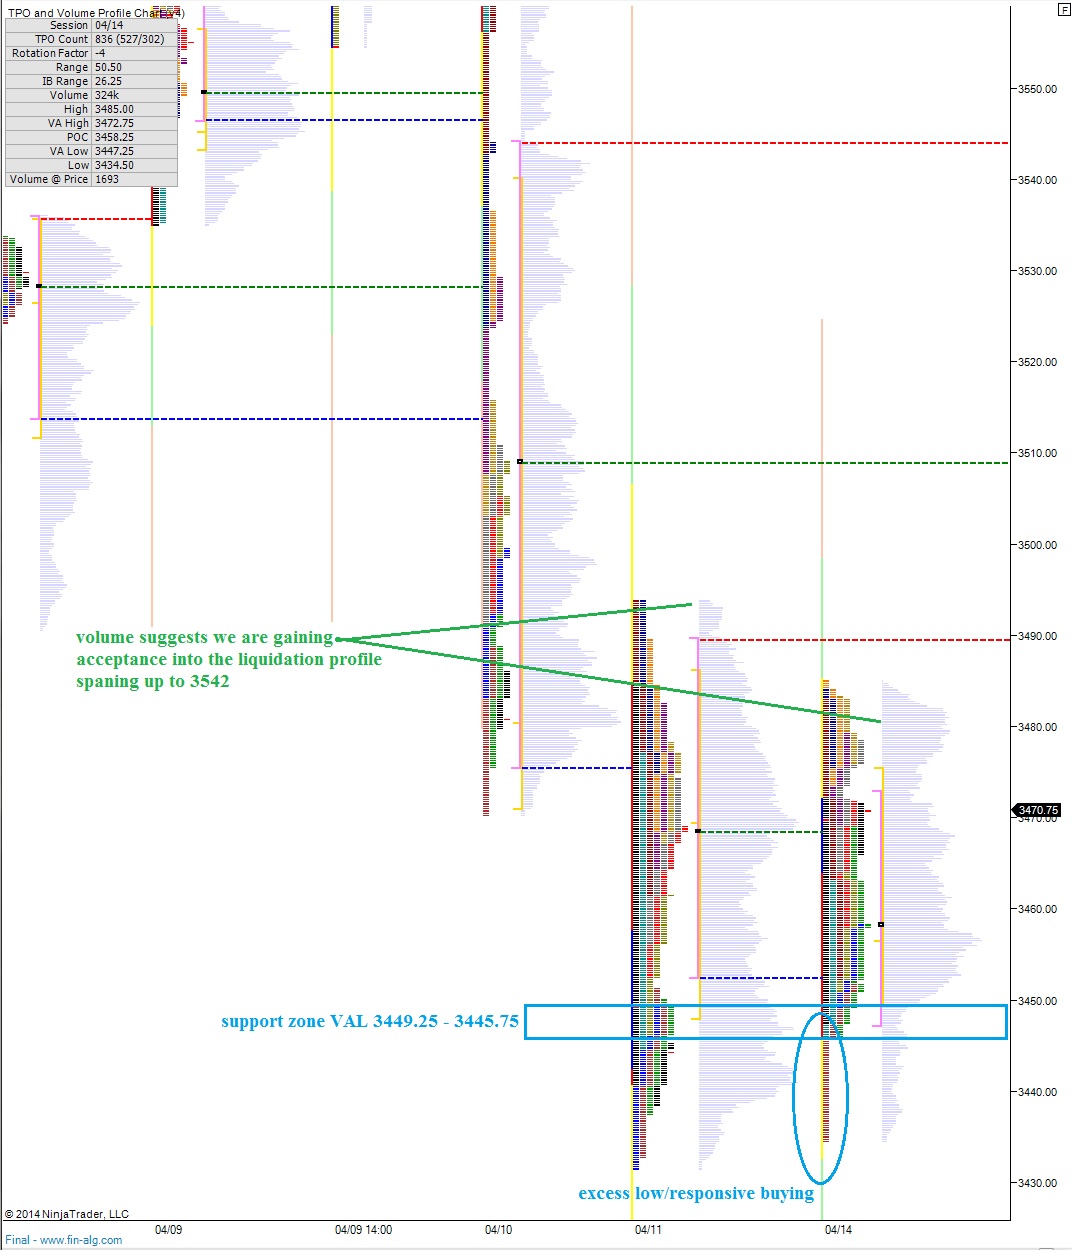
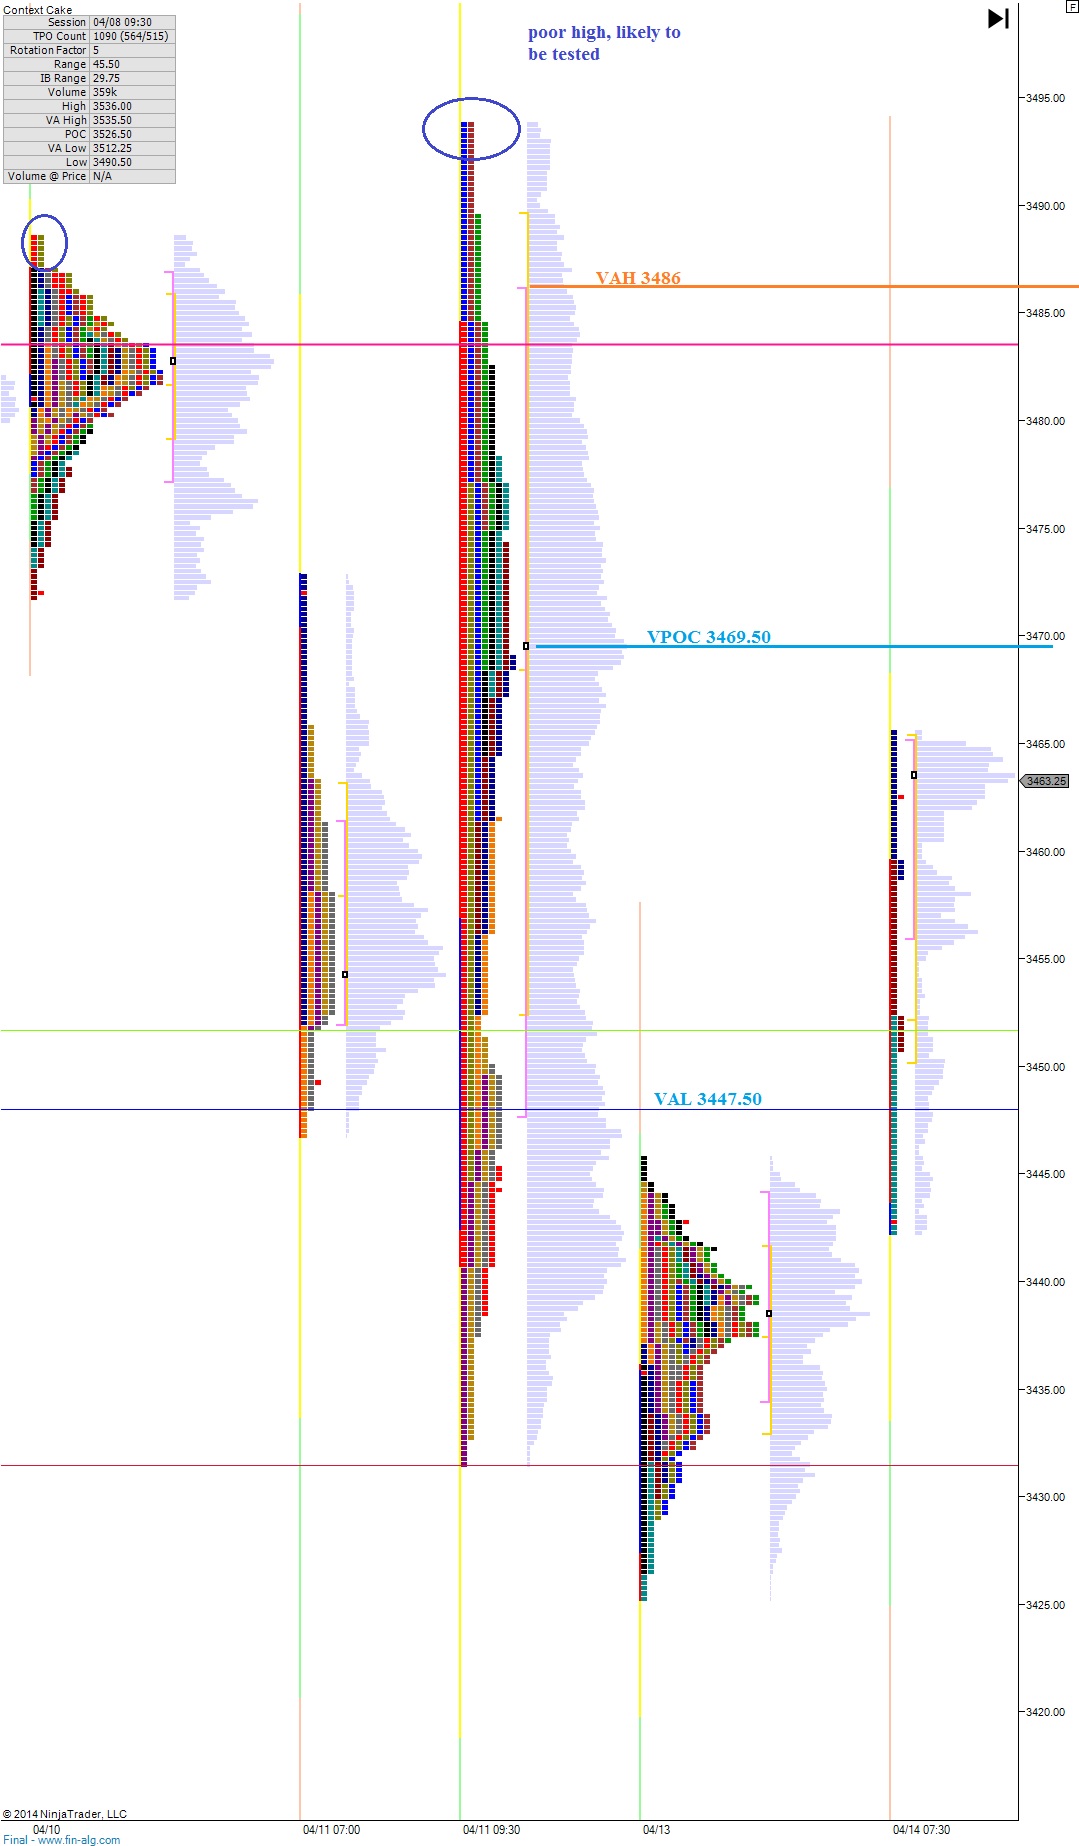
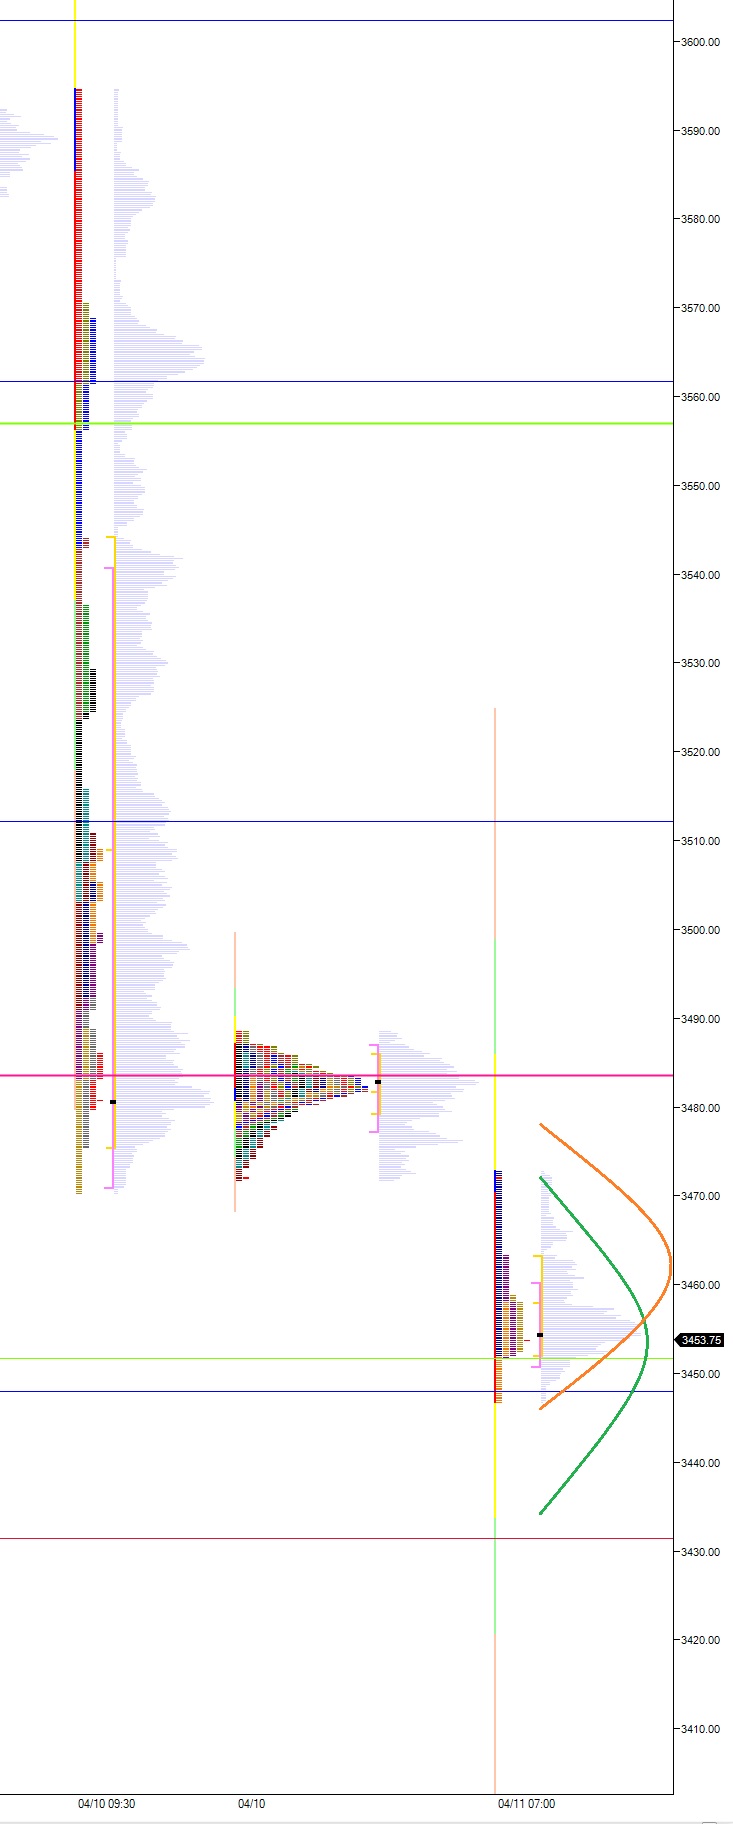
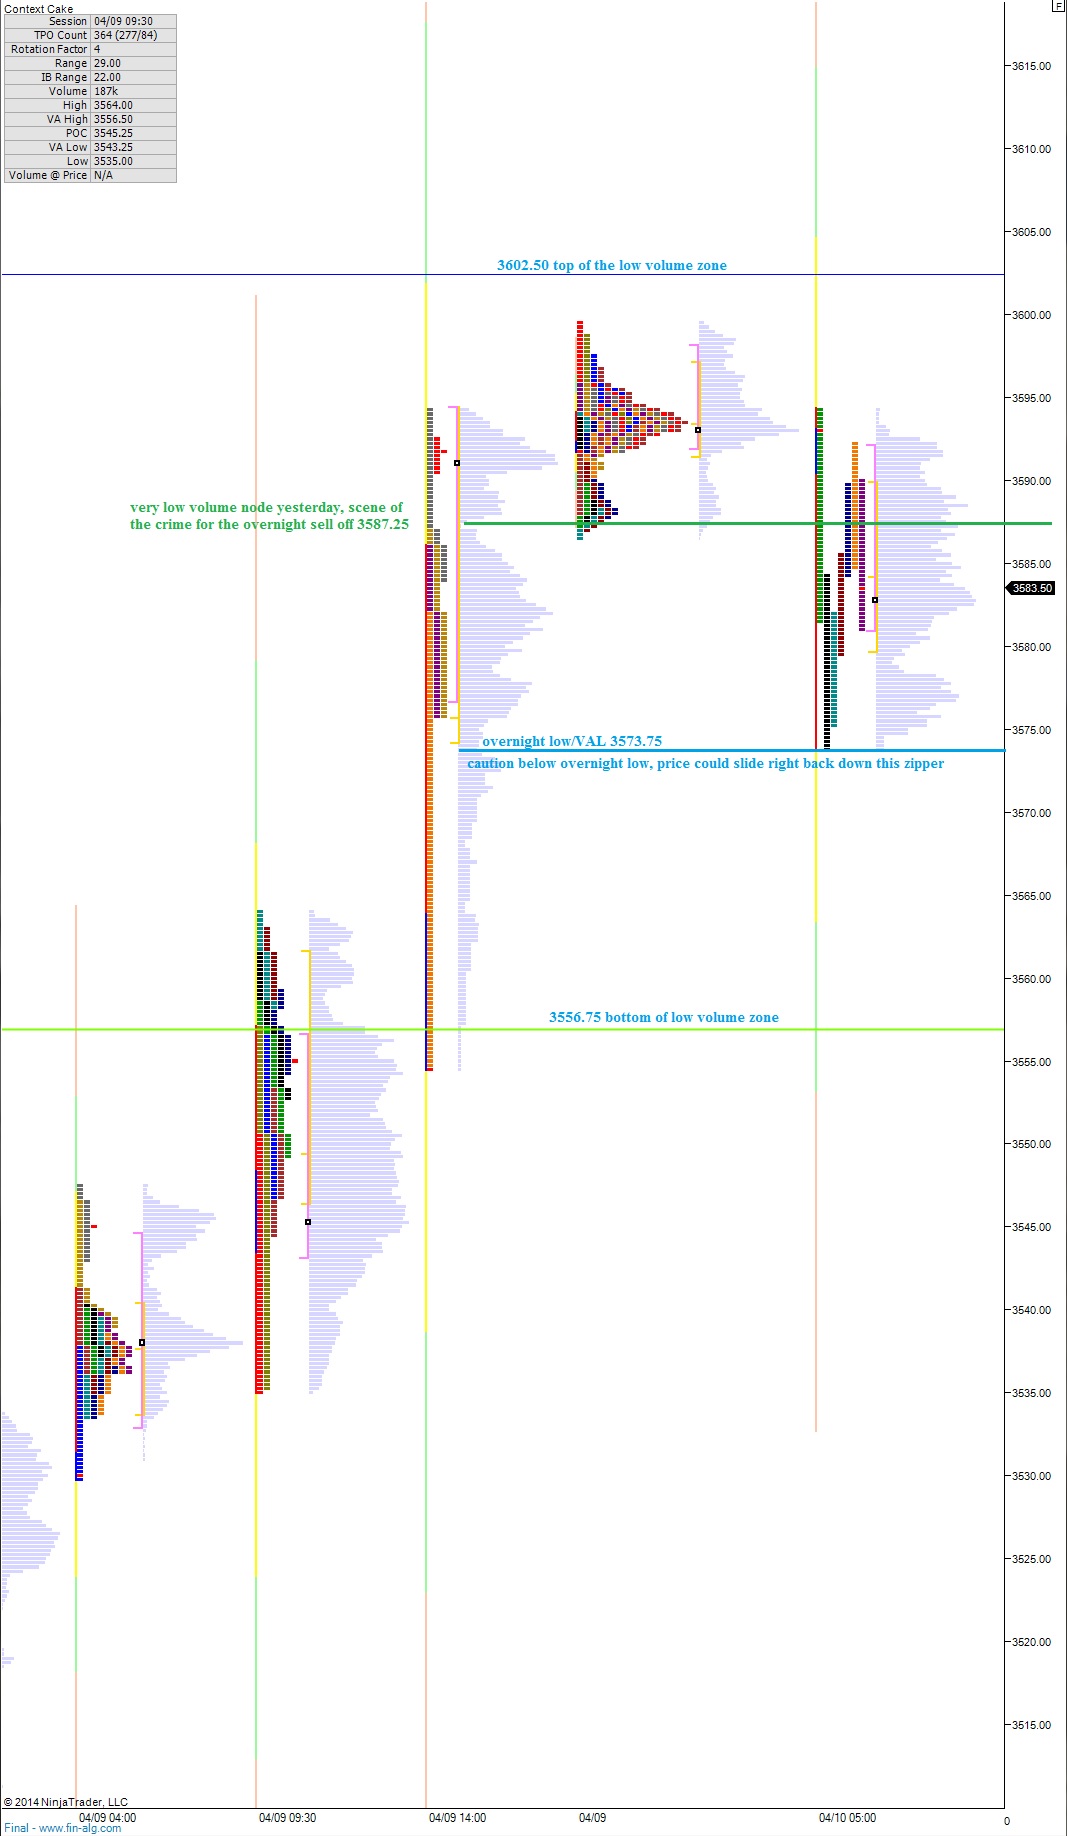
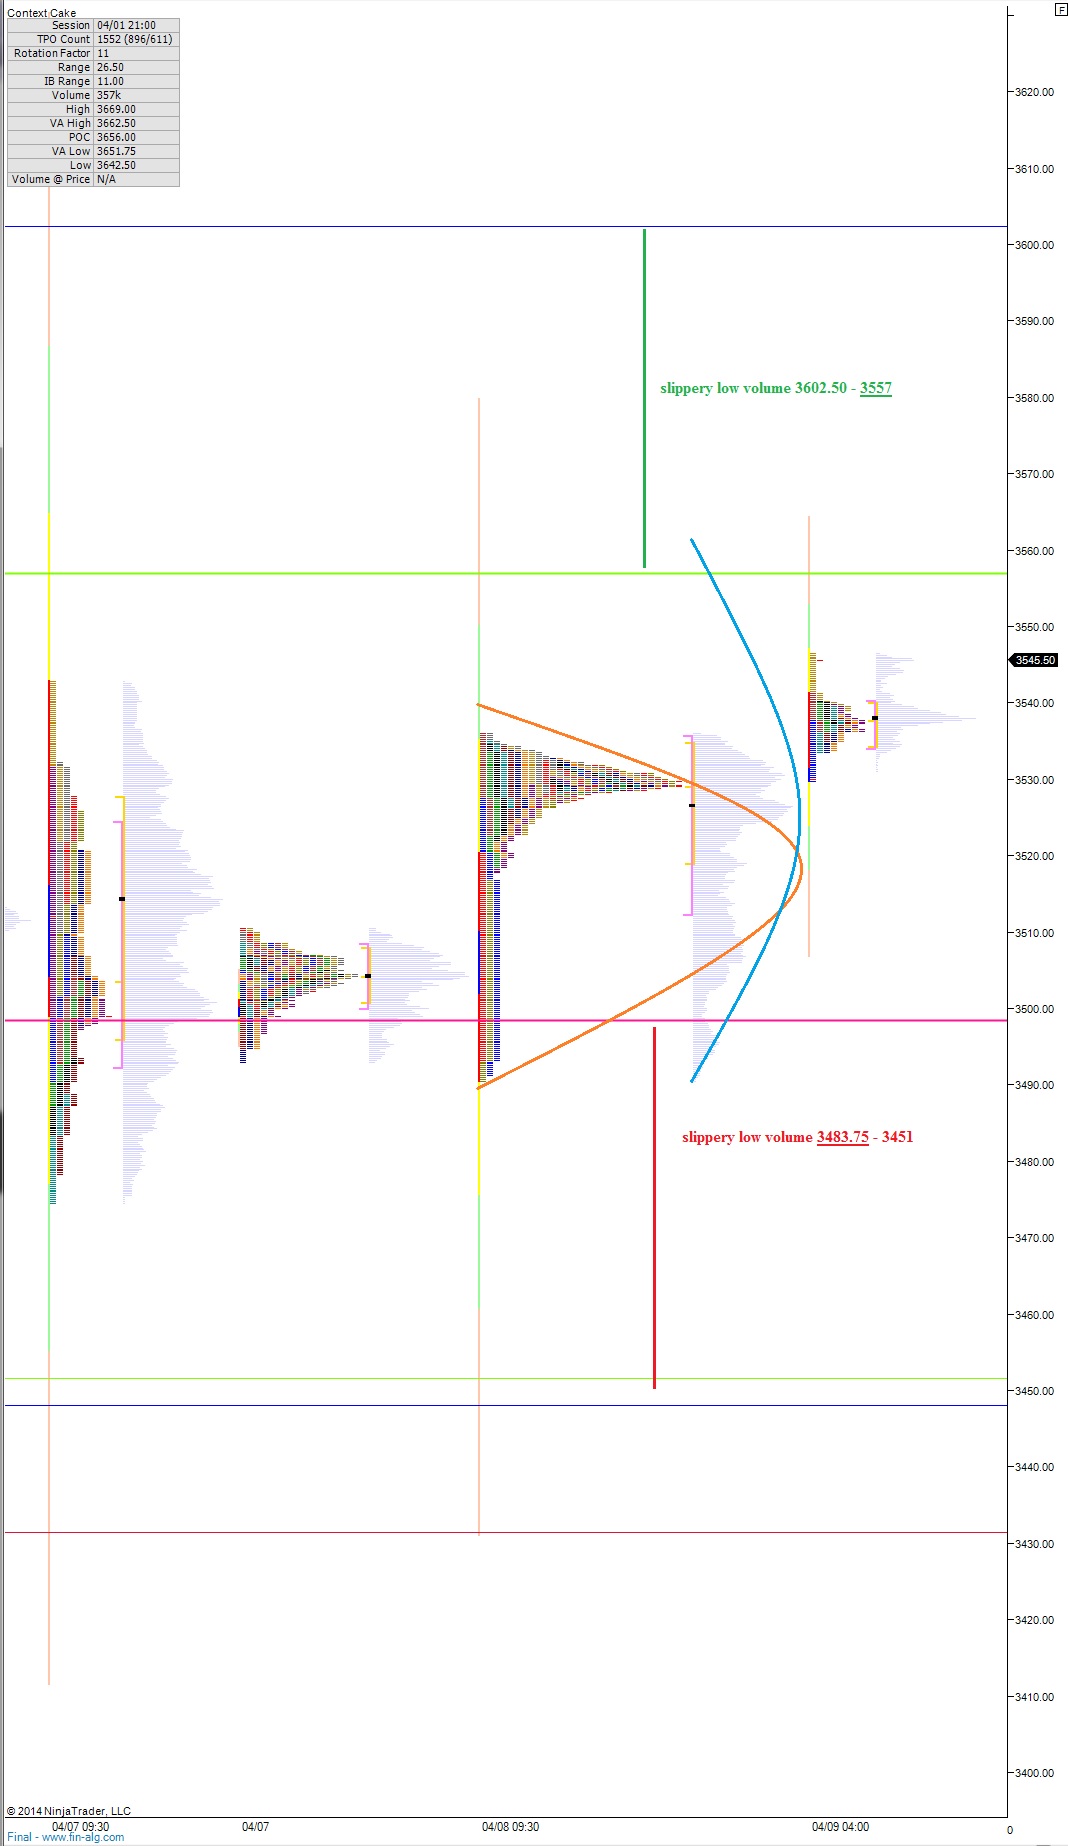
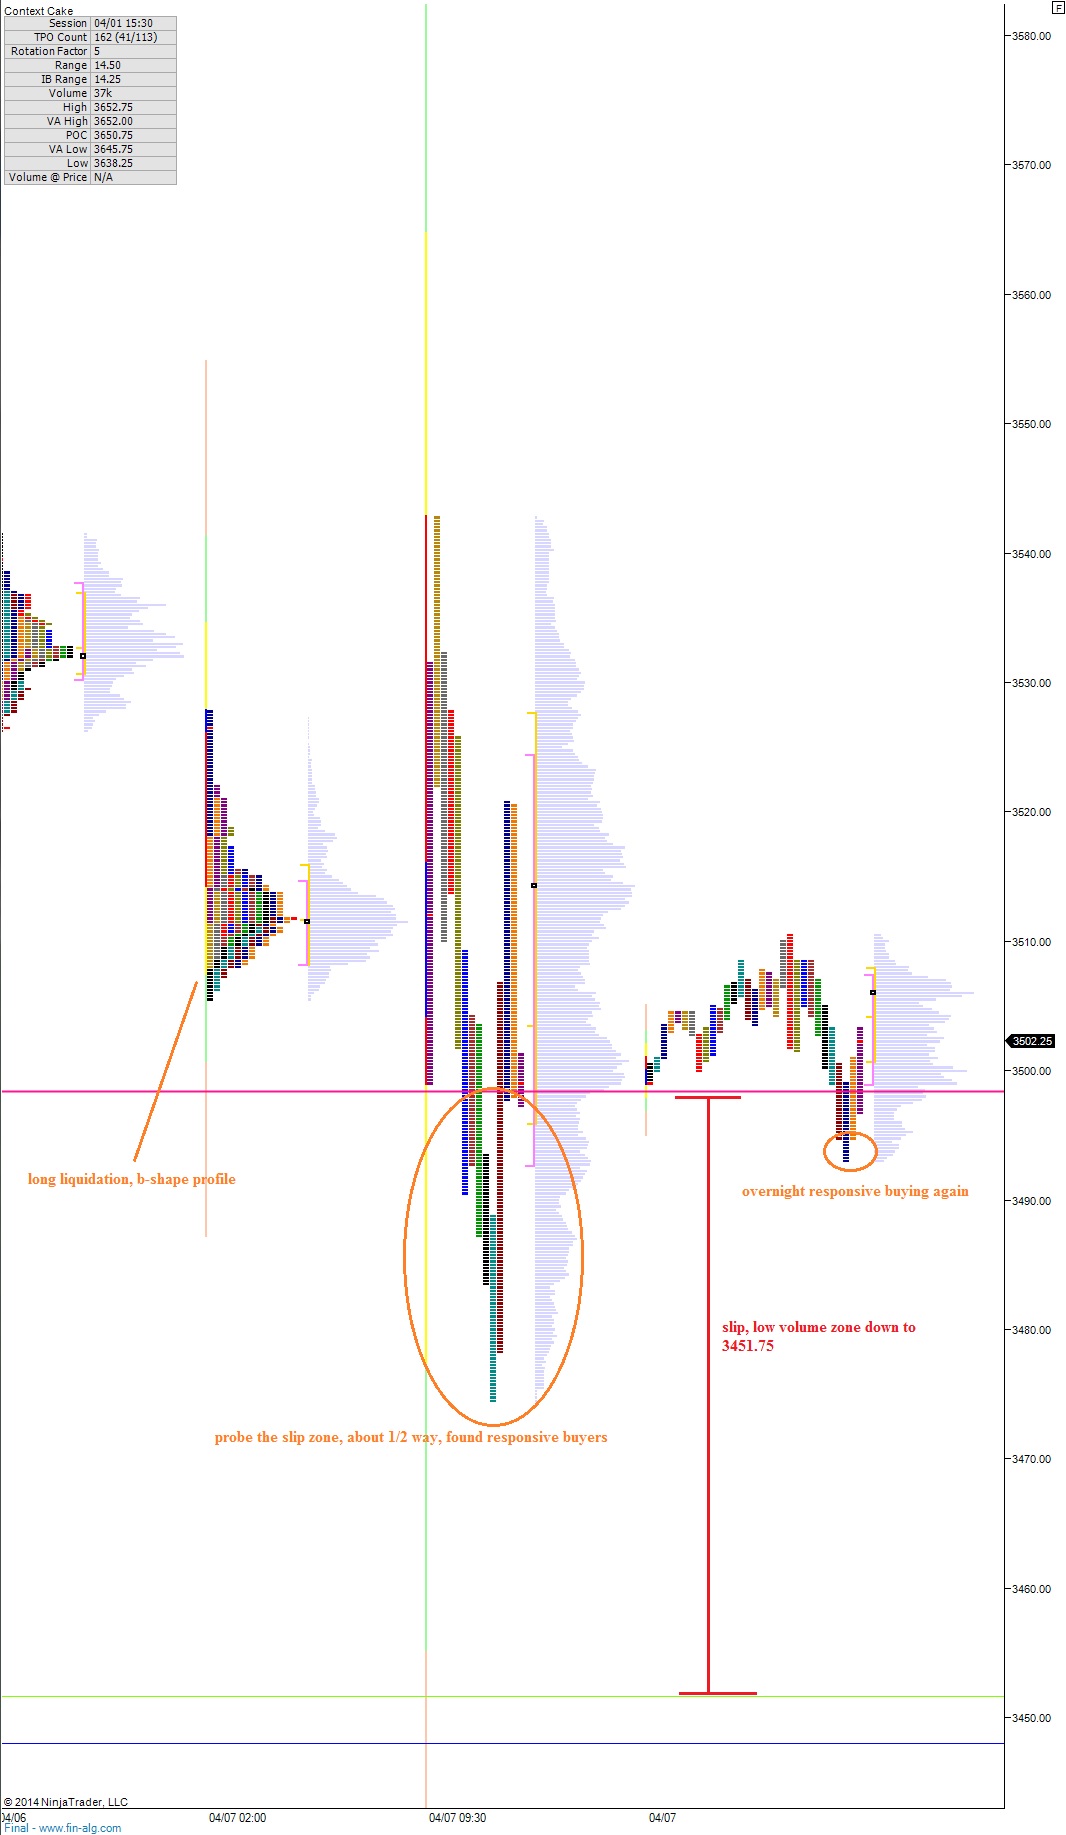
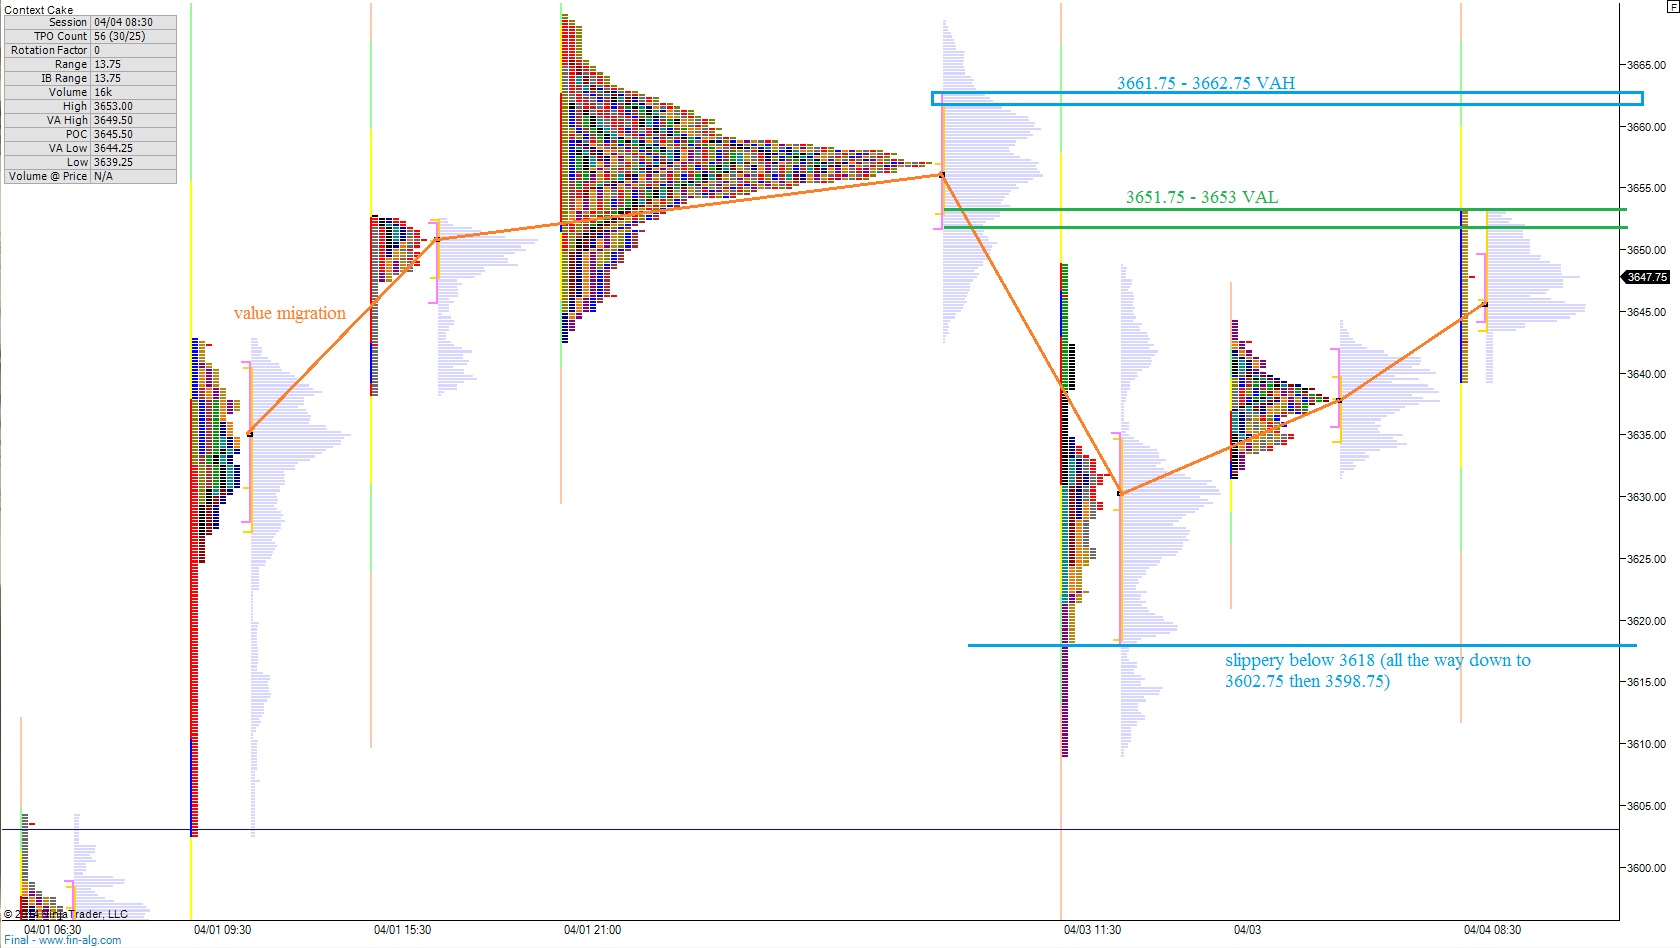
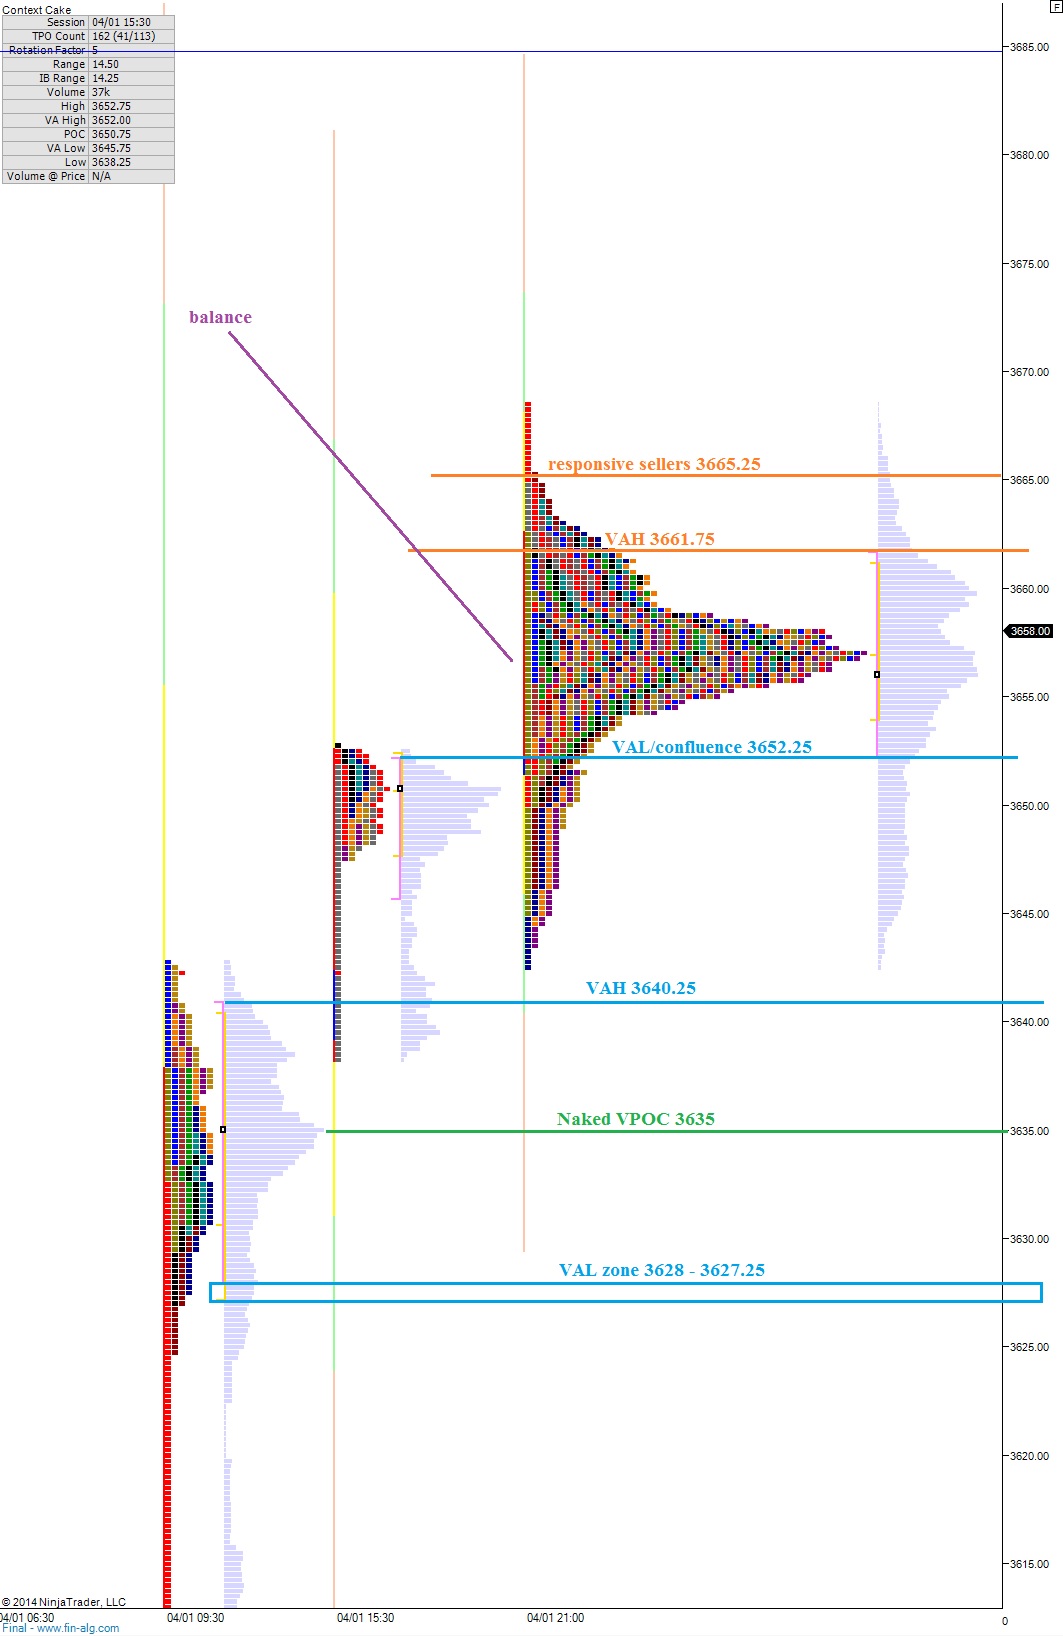
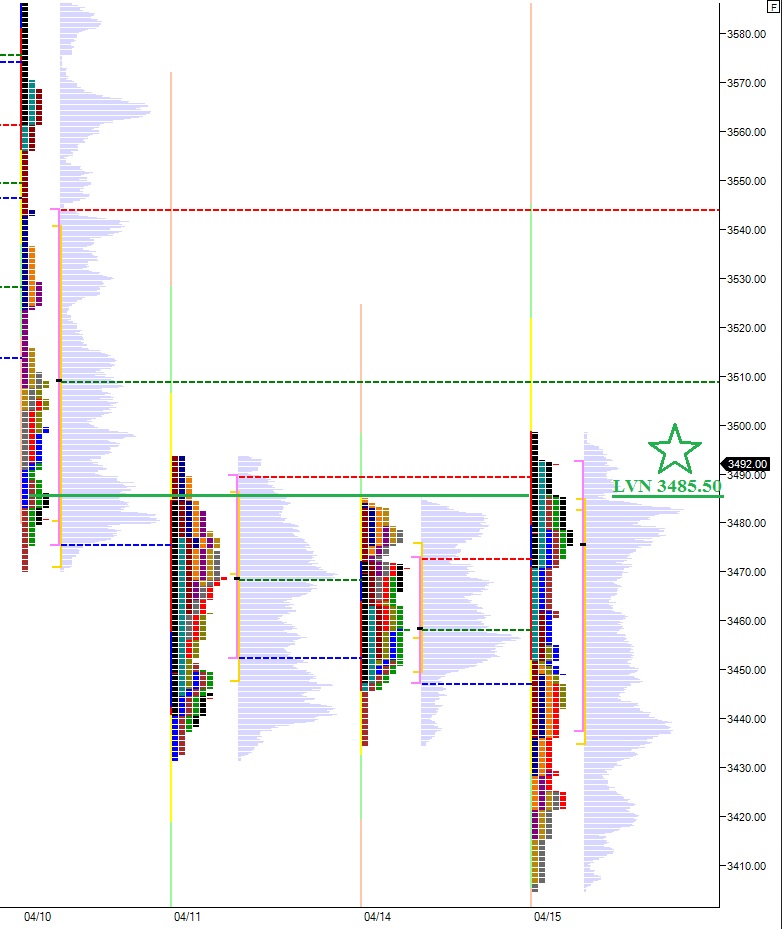
The short term auction shows buyers with a strong response.  They need to build on it and yesterday they accomplished a response with the potential to be build upon with some initiating buying.  However, should they be overwhelmed with supply price could reject back down into three days of overlapping value.  Standing between sellers goals is a very interesting low volume node at 3485.50 which is also in confluence with several value area highs.  This level is my key pivot intraday between long and short bias, until a level more influential materializes.  Buyers show us gaining acceptance into the upper profile which has prices up to around 3545:

NQ__MarketProfile_04162014


We have jobless claims at 8:30am which could have a material effect on the picture we see coming into the open.  We also have Philadelphia Fed announcement around 10am to be aware of.

Comments »

Hunting a Trading Range

It has been a busy morning in the futures market as premarket participants digest CPI data as Janet Yellen prepares to speak.  The reaction thus far to a slight uptick in CPI was a pop and fade.

The intermediate term auction continues to appear seller controlled with swing trades showing a series of lower highs and lows.  The question now is whether market supply will continue driving prices down on the intermediate term, or if instead price will stabilize and revert to the mean.   There is data supporting the latter outcome and that my expectation.  However, I respect the trend playing out on the intermediate term and must be willing to shift my stance should my expectation not occur.  I would not change this vision of a bracketed trading range developing if we took out our recent swing lows, but it would be a progressive step.

On the day timeframe auction, little changed between Friday and Monday.  We printed an inside day where our daily range was within the range of Friday and we also printed a neutral day with range extension to both sides of the initial balance.  Both of these characteristics suggest indecision on the part of buyers and sellers.  We printed an excess low yesterday which suggests we may see some follow through by swing buyers today.  I have highlighted this excess low as well as a few other observations on the following regular trading hours NASDAQ market profile:

NQ__MarketProfile_04152014

Comments »

The Edge of Balance: The Reward Zone

We have some early strength in the NASDAQ index futures.  The question on everyone’s mind this morning is whether we will see the early weakness get faded by strong sell flow or whether the higher advertised prices encourage buyers to enter the marketplace.  The former has been more prevalent for the last two to three weeks.

For today’s presentation of the intermediate timeframe, I chose to build out the volume profile based upon the 72 trading sessions completed thus far this year.  From the volume profile emerges some unique clues into whether the intermediate term is balanced or readying to explore lower for value.  The pattern of lower highs and lows gives sellers a clear momentum edge on the intermediate timeframe, but what is volume suggesting about value?  We do show some consensus of value around 3550 which you will notice is below the midpoint of our annual profile.  This suggests value has built lower and adds support to the idea of a continued migration lower.  However we do show a semblance of the bell curve too which makes the mean revision trade still a viable thought, although one which needs to engage sooner than later.  Also, any bounce which materializes much be carefully observed verses the very low volume node at 3580.  If price cannot gain acceptance above this level we would further expect price to continue lower.  I have highlighted these observations and a few others on the following annual volume profile distribution:

NQ_VolumeProfile_intermediateTerm_04142014

The short term auction suggests buyers have an edge this morning.  We had a rather thorough auction during our globex session which built an excess low which can be seen as a thin tail below the profile.  This suggests responsive buying and sellers drying up.  As the USA comes online we are seeing the large value area from Friday gain acceptance via volume building higher on our current profile.  This creates the expectation for trade through Friday’s value.  I have highlighted Friday’s value area and the key levels inside of it on the following market profile chart:

NQ__MarketProfile_04142014_afternoon

Taking our attention out to the long term we can see the buyers no longer clearly in control of the long term auction according to the daily chart.  We are trading below our moving averages which are flat at best and some moving lower.  We are still above February lows and we may see a balanced, bracketed trading range form.  Overall the long term auction is in balance until we take out the February lows.

Comments »

Where The Rubber Meets The Road

Equity futures gapped lower overnight displaying strong follow through on yesterday’s trend day.  As the USA comes online the S&P is down nearly 10 points and the NASDAQ about 20.  We have an hour until the cash session begins to recapture some of this downward progress but this is otherwise known as a pro gap.  Essentially that means the risk is elevated beyond a level most retail traders can handle in the event they attempt to fade the move and close the overnight gap.

I am of the opinion that with the right tools we can formulate a sound method of participating in this gap, and the most important tool today is market profile.  On Wednesday morning, I highlighted two key price zones which tell the story on the NASDAQ.  One was a low volume price zone above.  We traded ALMOST the entire range of that upper zone before stalling and being rejected out.  Auction logic would suggest a move to the lower end of this bracket to see if buyers possess the same conviction they had down here.  This takes us to February 4th, a rather interesting day.  Have a look:

NQ__MarketProfile_04112014

I won’t get too deep into observation of the above except to say this type of well defined profile structure is VERY useful for leaning on.  I will look to buy as close to the value area low at 3431.50 as possible.  Here’s the current market profile picture:

NQ__MarketProfile_04112014_current

The intermediate timeframe auction is in clear seller control.  They have this timeframe locked into a pattern of lower highs and lower lows.  I have highlighted a few very interesting low volume nodes we are coming into this morning on my volume composite:

NQ_VolumeProfile_intermediateTerm_04112014

Finally, the long term auction.  On the daily I show balance with sellers still pressing.  But on the weekly, there is something keeping me on the buy side, a squiggly line.  We may overshoot this reference point, given the markets current velocity, but I am leaning on this level nonetheless until we make a clean break:

NASDAQ_WEEKLY_04112014


Comments »

Active Overnight Session and How It Fits inside The Big Picture

Futures traders had some action early this morning when equity futures abruptly fell out of balance and knifed lower.  The wave of selling rolled in around 5am and it was soon met with responsive buying.  The overnight profile shows no clean consensus on value and we are currently trading near unchanged in the NASDAQ.

I will always buy the first test of my EMA if I feel the chart is still trending and the EMA resides at a higher low then our previous swing high (or lower high then our previous swing low).  However, the buying is typically the easy part of this trade.  Knowing whether the trend will resume or whether price will roll tide back is the management key.  The very long term auction as seen on the weekly composite chart is still buyer controlled.  We were buyers ahead of the 33 EMA which has now edged higher to touch the low print.  Did you know moving averages move?  See below:

NASDAQ_WEEKLY_04102014

The daily chart which I most commonly refer to as the long term auction is no longer a clear picture of buyer control.  Our EMAs are not in full alignment and our longest term EMA, the 99, is flat.  We have also seen a pattern of lower highs and lows recently and it appears the long term timeframe is in balance.  Now buyers and sellers must slug it out before one or the other becomes the clear controller of the long term auction.  However, buyers have a slight control edge remaining (see blue circles on major swing levels).  See below:

NASDAQ_DAILY_04102014

The intermediate timeframe is seller controlled.  Their control can be seen as a series of lower highs and lows.  Yesterday’s action was dynamic and powerful to the upside, but until we see a higher low printed, the sellers have the ability to assert control on this timeframe.  I have removed all the lines I normally keep on this chart so we can more clearly view the seller control.  There are some very interesting low volume nodes if you click and enlarge the chart, and these make great entry points because they often see “hot plate” type reactions:

NQ_VolumeProfile_intermediateTerm_04102014

The short term auction is buyer controlled.  This can be seen as a migration of value higher as well as strong responsive buying tails on the recent profiles.  We are trading inside the price zone I highlighted yesterday as a low volume slip zone.  This zone is so important.  If buyers can finish trading up through it, and then gain acceptance via value up above 3602.25, this would translate well into gaining control of the intermediate term at best, putting the intermediate term auction into balance at the least.  I have highlighted this interesting zone on the following market profile chart as well as a few other observations:

NQ__MarketProfile_04102014

Comments »

Cut Through The FOMC Noise With Two NASDAQ Price Zones

If you do not have time to read the entire context report, skip to the last paragraph/chart for the Two NASDAQ price zones you need to navigate the FOMC reaction-to-the-reaction-to-the-reaction.

Buyers showed up overnight and as the USA warms up we have a slightly green NASDAQ market.  One of the features of this multi-week selling has been mornings which start strong only to be faded and eventually wind up with price closing near the low of the session.  However, just when you think you have the markets number it will throw you a slider.

Let’s have a closer look at the long term auction and why I suspect a bounce is near.  Also, let’s look at what will begin to worry me and cause me to really tighten my book up.  See below:

Weekly Chart (long term auction):

NASDAQ_WEEKLY_04092014


DAILY CHART (long term auction):

 NASDAQ_DAILY_04092014

Intermediate term we are still seller controlled but stretched.  This increases the likelihood of a big move in either direction, either a continuing to stretch the boundaries of the market to the downside or a snapback move.  With FOMC minutes out this afternoon, the likelihood is even greater.  You can see price has reverted back to my 33ema and paused.  The market is very likely waiting for FOMC minutes before deciding the next move.  More importantly to us is how the market reacts to the price reaction we see this afternoon.  This is not to say the first move is wrong or fake, but instead that long term participants are likely to be moved by the action and if they are we need to observe their order flow.  I have highlighted some key intermediate term levels on the following volume profile composite:

NQ_VolumeProfile_intermediateTerm_04092014

Finally the most delicious and powerful timeframe of all, THE SHORT TERM auction.  These profiles are set up more exciting then I have seen in a great while.  We have very low volume slippery zones on both sides of price right here, right now.  The short term is in balance with buyers trying to take the early initiative to break the balance.  On my market profile chart you will see a thick pink and a lovely chartreuse green line.  These two levels are the edges of where very low volume starts.  A breech of either (or both) is very likely to see an acceleration of price in that direction.  Which side of this environment we end up on will ultimately dictate the control on both the short and intermediate term.  In the meantime, it produces a massive trading opportunity to “go with” a move that penetrates either zone, intraday.  See below:

NQ__MarketProfile_04092014

Comments »

Big Picture Shift

Index futures are flat to slightly down overnight as the market begins finding buyers and forming a balance.  As the USA warms up we are set to open inside of yesterday’s value.  This is a lower risk/reward opening position, however we are still in an overall riskier environment.

I continue to focus on my market profile which is a footprint of the short term auction.  The NASDAQ is coming into balance on a ledge.  If go back to the auction that occurred in early February last time we traded at these levels, then you can see a series of single print TPOs.  These signal two things: first there was very strong demand at these prices last time they traded.  Second, the thin volume is slippery and price can slide right down it.  Often times a legitimate volume pocket holds as support on the first test.  It is each subsequent test that weakens its defenses until finally a swift move zips right down it.  I have highlighted this level on my market profile chart.  It looks to be holding this time around:

NQ__MarketProfile_04082014
A short covering rally starts to make sense with FOMC minutes out on Wednesday.  A short seller who has made a profit from this recent move down may seek to lock in some of that profit ahead of a Fed meeting because as traders we have been conditioned to expect market movement during these times.  The intermediate term is very stretched too, which means the snapback becomes more likely as time progresses.  Have a look at the zoomed out intermediate term.  Note we also cleared an open gap dating back to February 6th.  Remember, gaps always fill, but timing is key.  Can you imagine waiting through all of February and March for this gap fill?  You would be insolvent.

NQ_VolumeProfile_intermediateTerm_04082014

The long term auction is starting to look balanced.  It has been buyer controlled for a very long time and today is the first day I am changing my perception of the long term auction.  It is in balance.  My expectation now is for the long term auction to go range bound.  That means it is time to start trading futures again.

In summary, balance on the short term, seller controlled and stretched on the intermediate term, and the long term auction is coming into balance.  I am cautiously looking to build longs here for a snap-back higher as the long term auction settles into bracketed, balanced, range trade.

Comments »

Finding The Origin of Demand

Index futures are down overnight as the selling which quickly began mid-last week spilled into the globex session.  The entire move was quite exhausting as the USA comes online we are seeing some early buying interest.

My main focus today is on the short term auction.  Price has come down to a very interesting level on my market profile.  We are reaching a level where demand was once very high for equities.  I can tell this by the dynamic footprint which was left behind as a long and thin single print of TPOs.  As we come into it from above, the risk is slipping down the4 viscous slope where demand once existed.  The contrary move would be for us to not breach the upper reference point just before the slip zone.  I have highlighted where this slip zone begins and ends on the following market profile chart.  Should we not breach this level, I may be a buyer early on:

NQ__MarketProfile_04072014

The intermediate term is seller controlled after briefly coming into balance.  The market was able to make a higher low, higher high briefly before the big liquidation snap Thursday and Friday.  For a moment we came into balance but when price travelled into overhead supply the market became overwhelmed with sell flow which was abundant compared to demand which was nearly non-existent for the two days.  Since then we have made a lower low putting sellers in control.  I suspect a revision trade will take hold at some point this week and return price to my EMAs.  I have highlighted a few key price levels on the following volume profile composite.  We are set to open nearest to 3511.25:

NQ_VolumeProfile_intermediateTerm_04072014

The long term auction is certainly in question.  One could perhaps make the case for buyer control based on the February low being below here.  I am not quite as clear on the long term.  I will call it buyer controlled with a 50% chance of balance taking hold.

Comments »

The Reaction to The Reaction

The NASDAQ futures drifted higher over night on low volume ahead of the jobs report at 8:30am.  The initial reaction to the jobs report was a move higher.  The report itself was mediocre-to-decent news thus an initial positive reaction is good, but not of the strongest conviction.  The strongest conviction would be a positive reaction to a bad employment report.  The strength was quickly faded by a strong bit of sell flow.  It looks like the opening may be interesting today.

The long term time auction is buyer controlled.  This can be seen as a series of higher highs and lows on the a daily chart of the NASDAQ composite.  If sellers can succeed over the next few days at printing a lower high verses March, we will likely see the long term auction transition into a balanced state.

The intermediate term auction is in balance.  Overhead supply came into effect yesterday morning and the resulting trading day was a press lower.  The action probed prices back to the midpoint of this intermediate term balance where my expectation was to find buying.  I will be watching the price action around 3632.75 for an early directional bias on the day.  I have highlighted this level and a few other observations on the following volume profile chart:

NQ_VolumeProfile_intermediateTerm_04042014

The short term auction is very indecisive but I would call it a semblance of balance.  Value is roaming somewhat aimlessly.  We have a strong developed profile overhead which price rejected away from yesterday and since then we have been inching back upward toward the reference zone.  I have highlighted this key upside profile as well as a few other observations on the following market profile chart:

NQ__MarketProfile_04042014

Comments »

Holding Pattern

Stock index futures were quiet overnight and traded inside of a narrow range without much volume.  As a result the overnight profile shows no definitive value or balance.  As the USA comes online, it appears some selling is working into the marketplace.

The short term auction is balanced.  The balance spans back to Tuesday afternoon when a strong upward move came into overhead supply and two-way auction ensued.  This was very interesting because my expectation was for overhead supply to be of a greater force and cause a more sudden rejection, especially with sellers at the time controlling the intermediate term.  Perhaps the market place is waiting to hear the jobs report on Friday.  Regardless, it appear the market is pausing until more information is presented.  I have highlighted the short term balance on the following market profile chart:

NQ__MarketProfile_04032014

The intermediate term auction is balanced.  Price is pressed up into a glut of supply dating back to mid-February and it is slowing upward price movement.  The EMAs I keep on the intermediate term timeframe crossed back upward and now my expectation is to get back into the prices in and around these EMAs and see how the market behaves.  I have highlighted some key price levels on the following intermediate term volume composite:

NQ_VolumeProfile_intermediateTerm_04032014

The long term auction remains buyer controlled.  Buyers are currently tasked with setting a new swing high.  On the contrary, sellers want to roll this market over and put a lower high in place.  A turn lower could be the catalyst to displace the long standing buyer control on the long term.

Comments »