iBankCoin
Home / Tag Archives: $ESF

Tag Archives: $ESF

Focusing on The Auctions Only

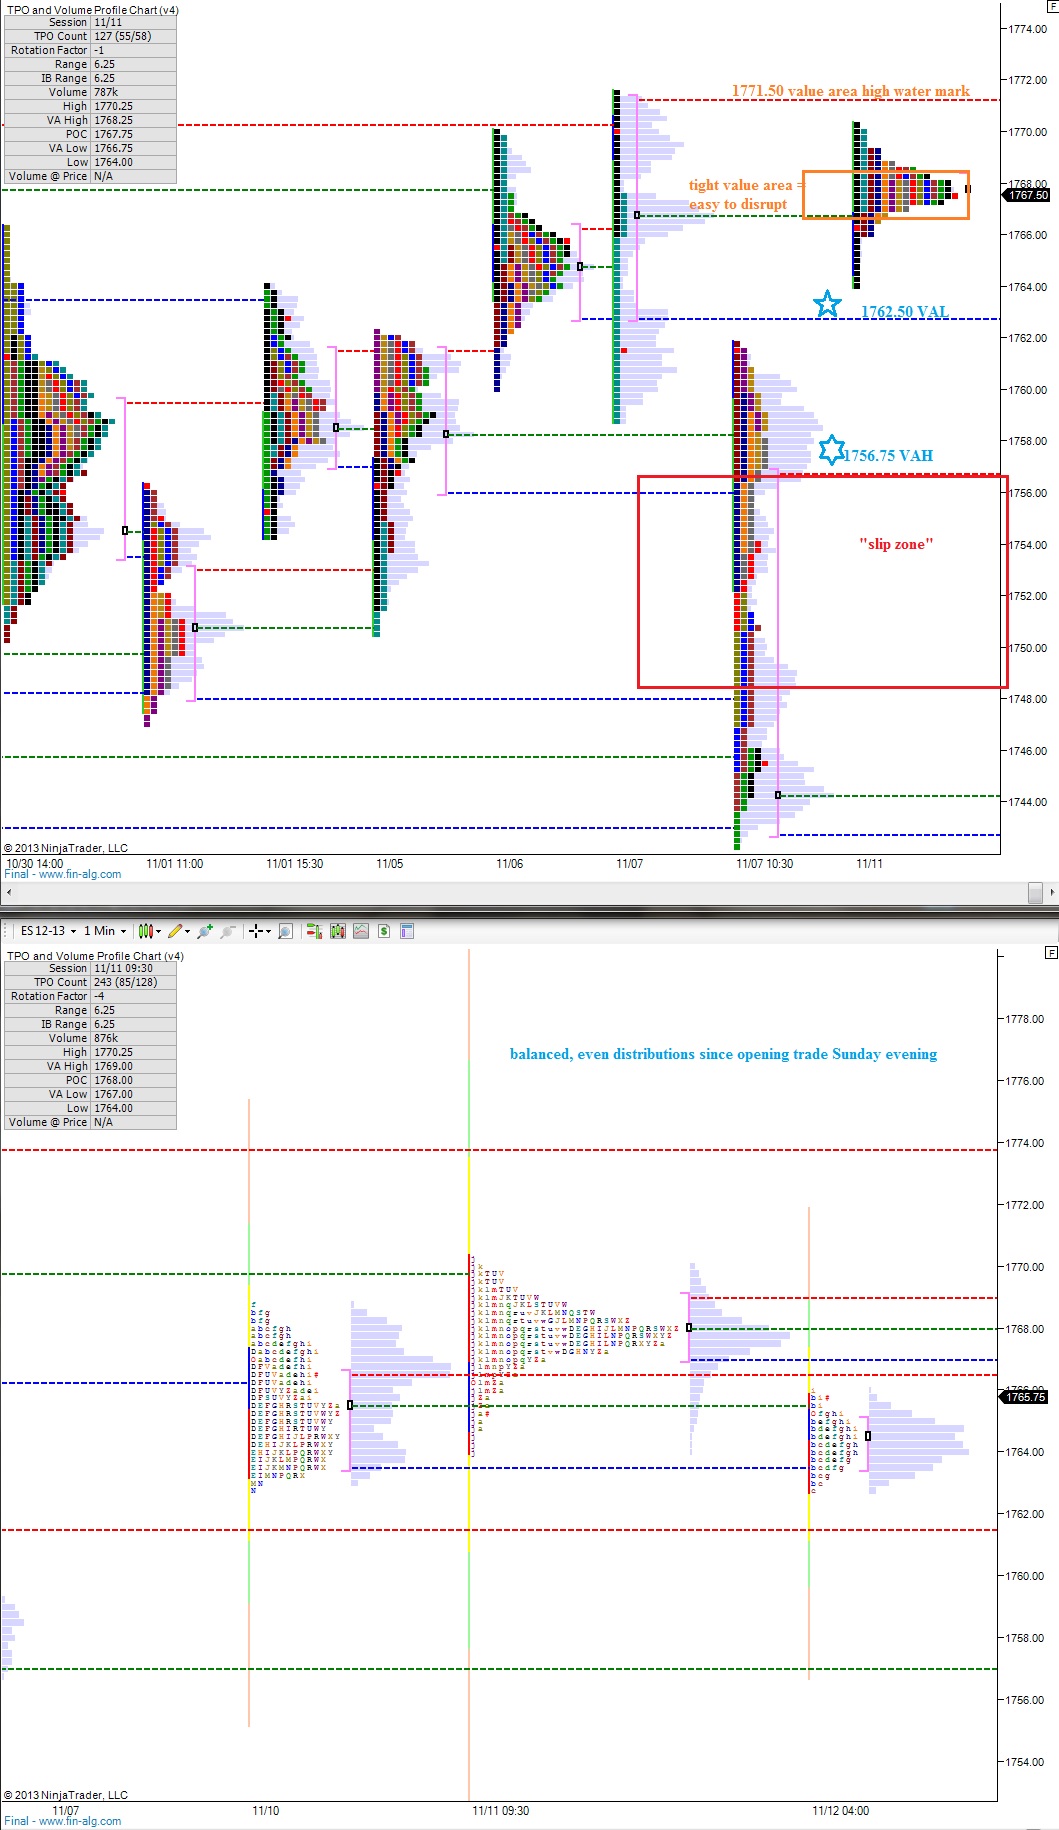
The markets auctioned very methodical all week ahead of what is likely to be an interesting Friday.  We tracked the control of sellers which began on Monday and came into question Wednesday with a violent neutral session.  Thursday the market told us it accepted the current prices by balancing out inside of the large neutral day and is waiting for new information before exploring elsewhere.

Overnight the NASDAQ divided itself into three micro sessions by auctioning then breaking a bit higher, auctioning then breaking higher, and finally auctioning as the USA come online.  The action overnight suggests buyers have the early edge.  However they have also pressed us into very short term overbought conditions.

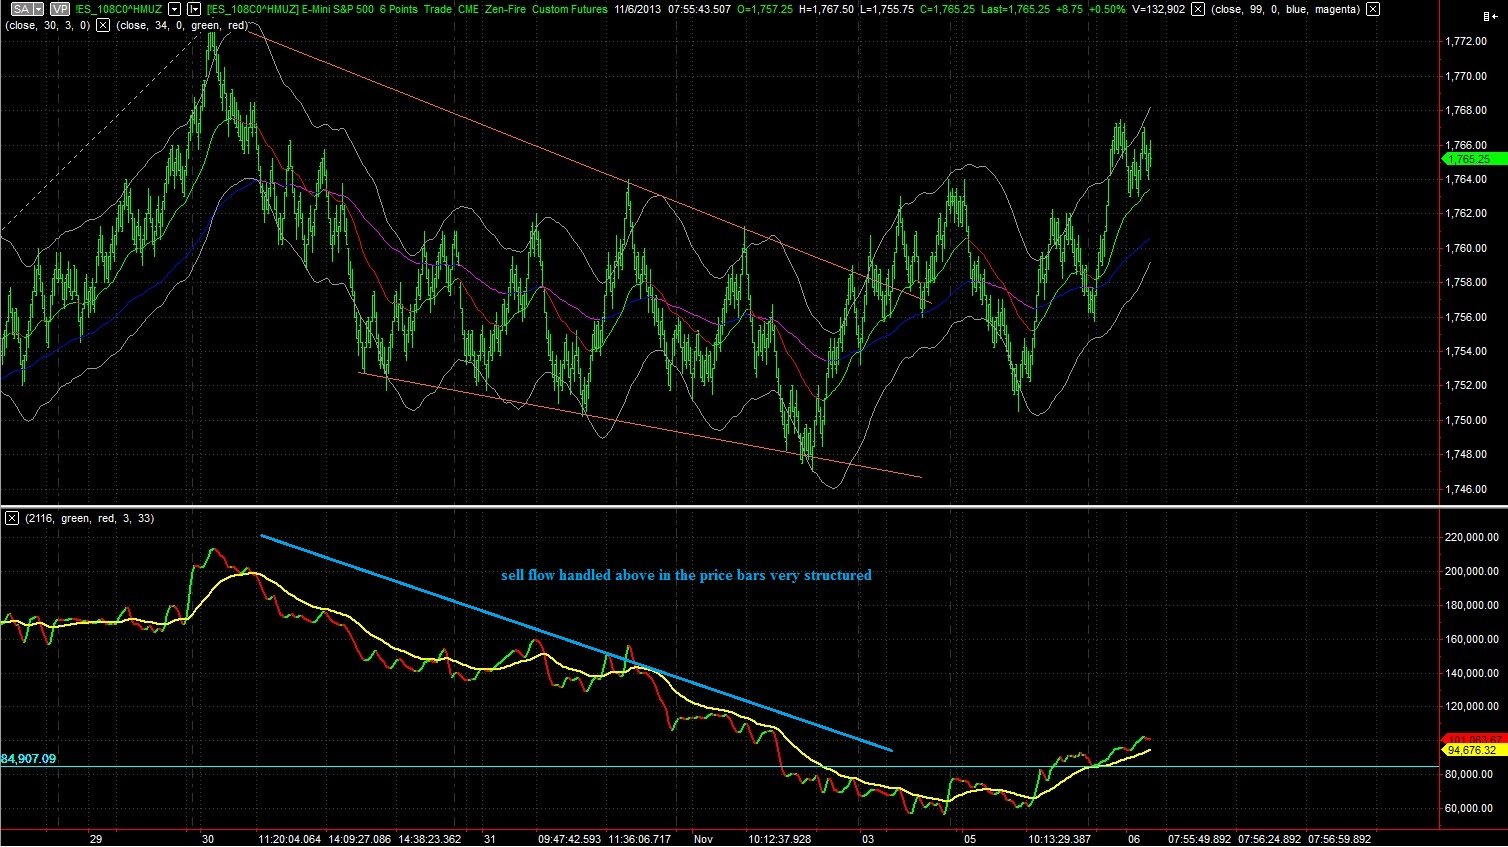
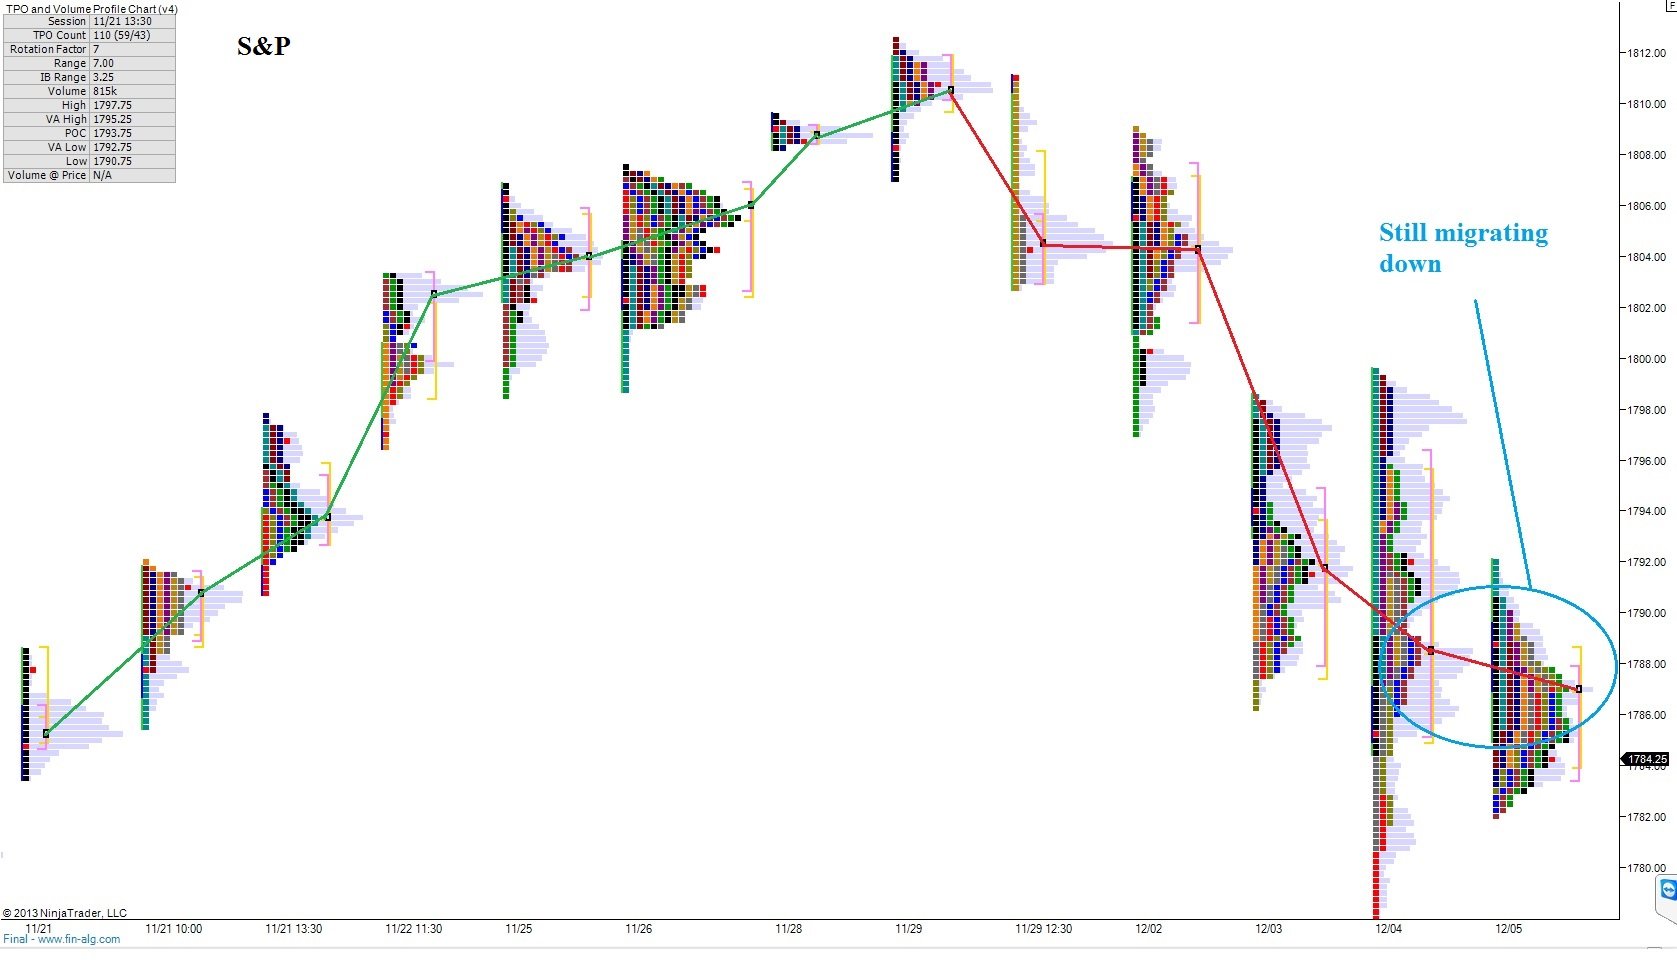
Taking a look at the longer term via value migration, you can see the relative strength of the NASDAQ verses the S&P:

ES_1205_migration NQ_1205_migration


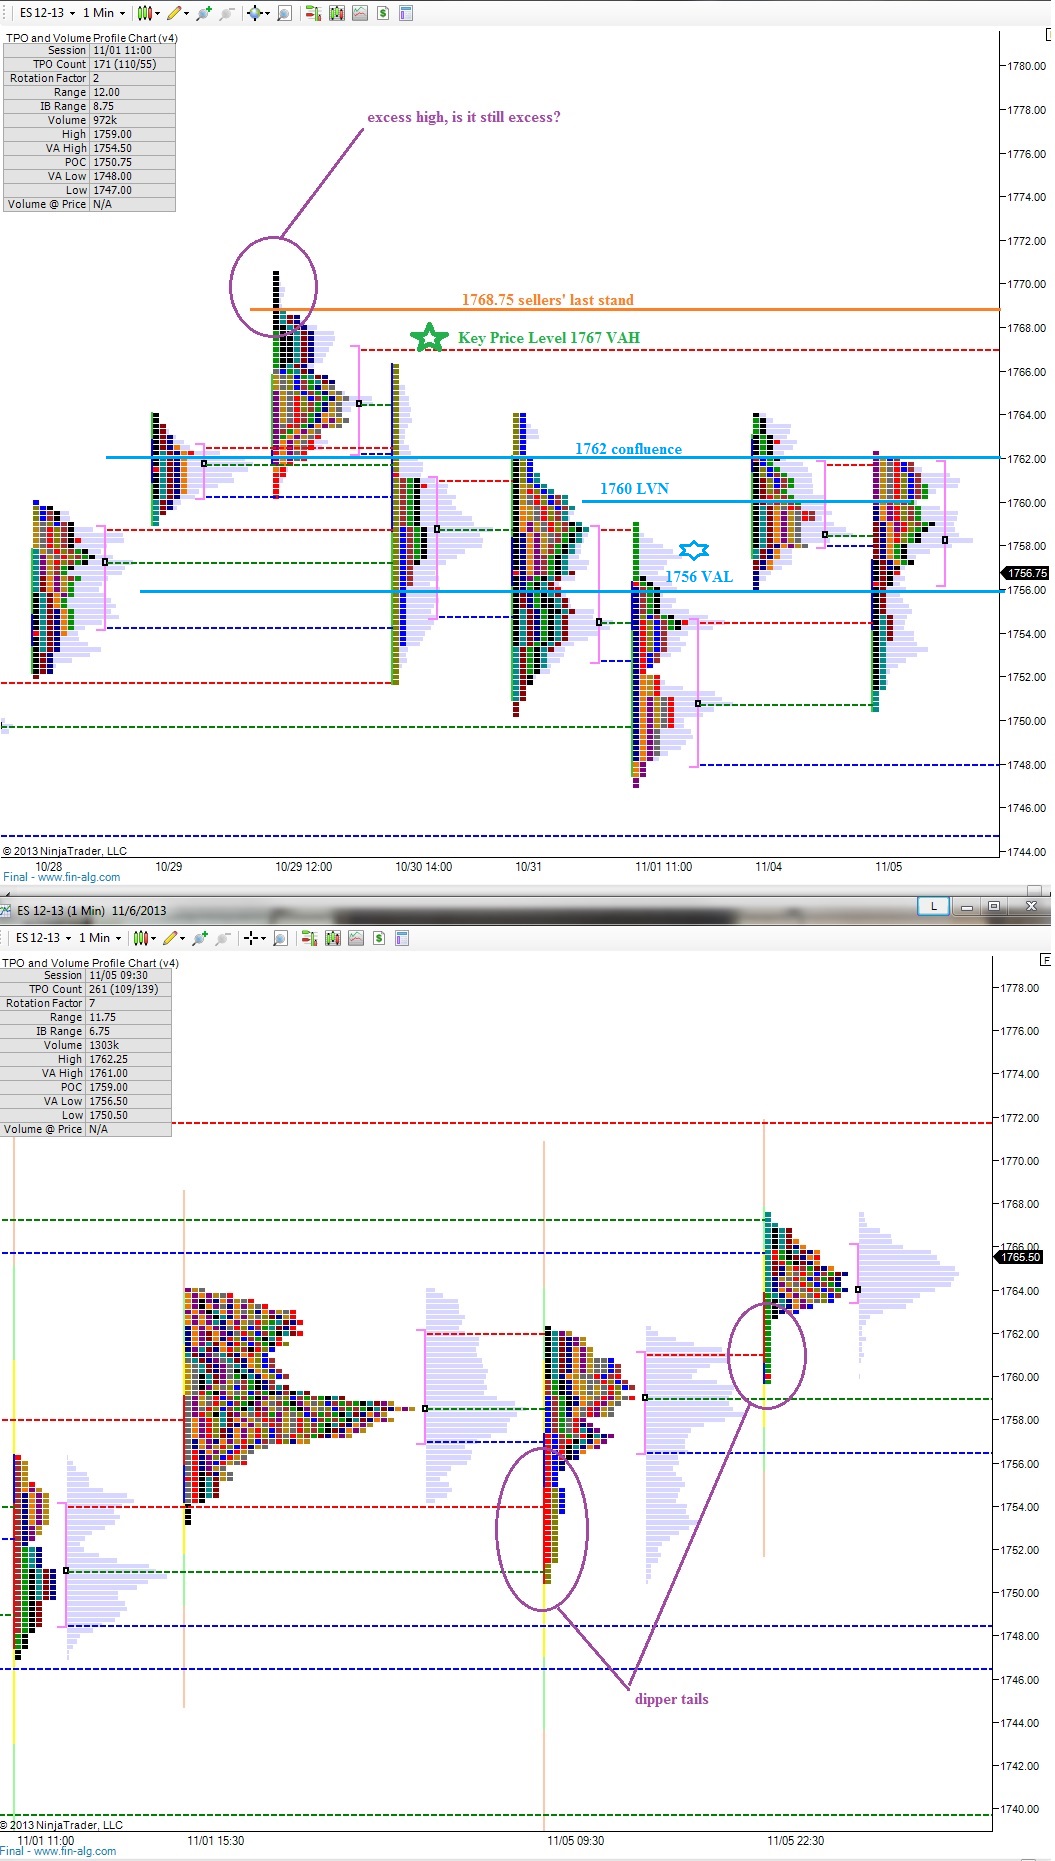
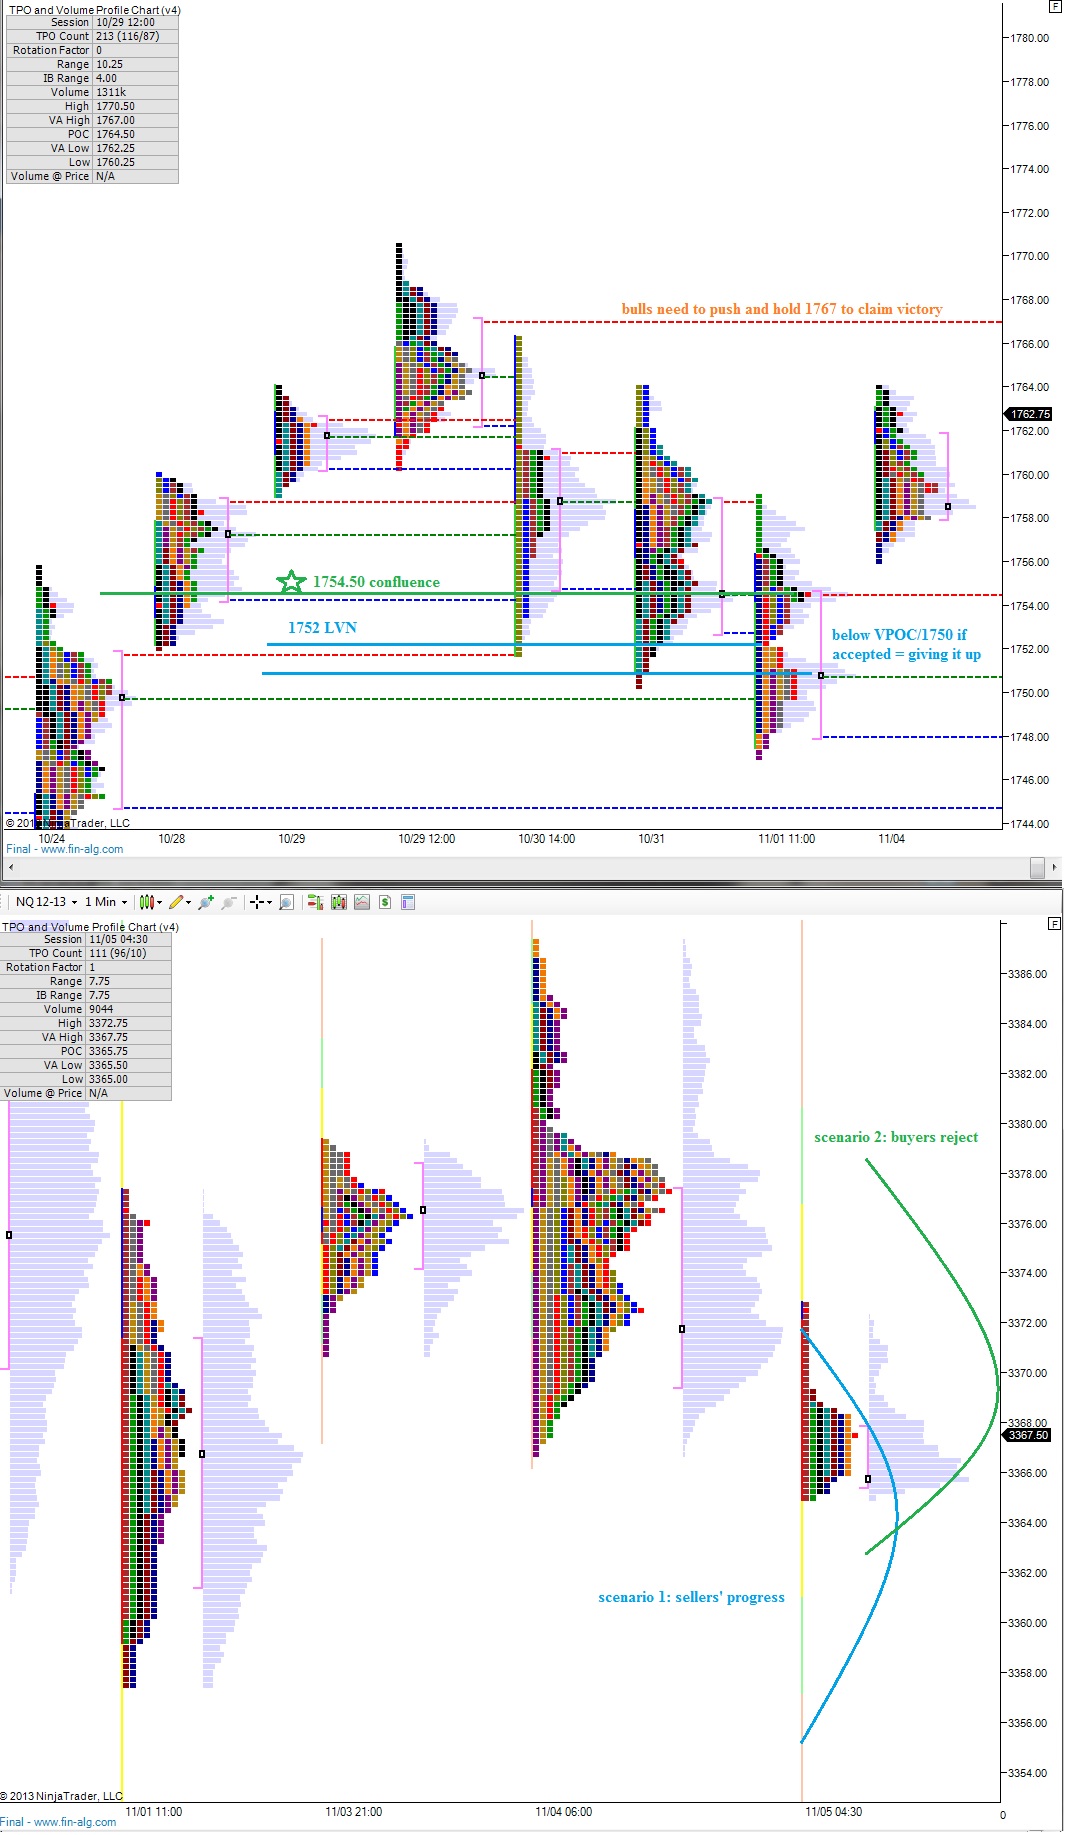
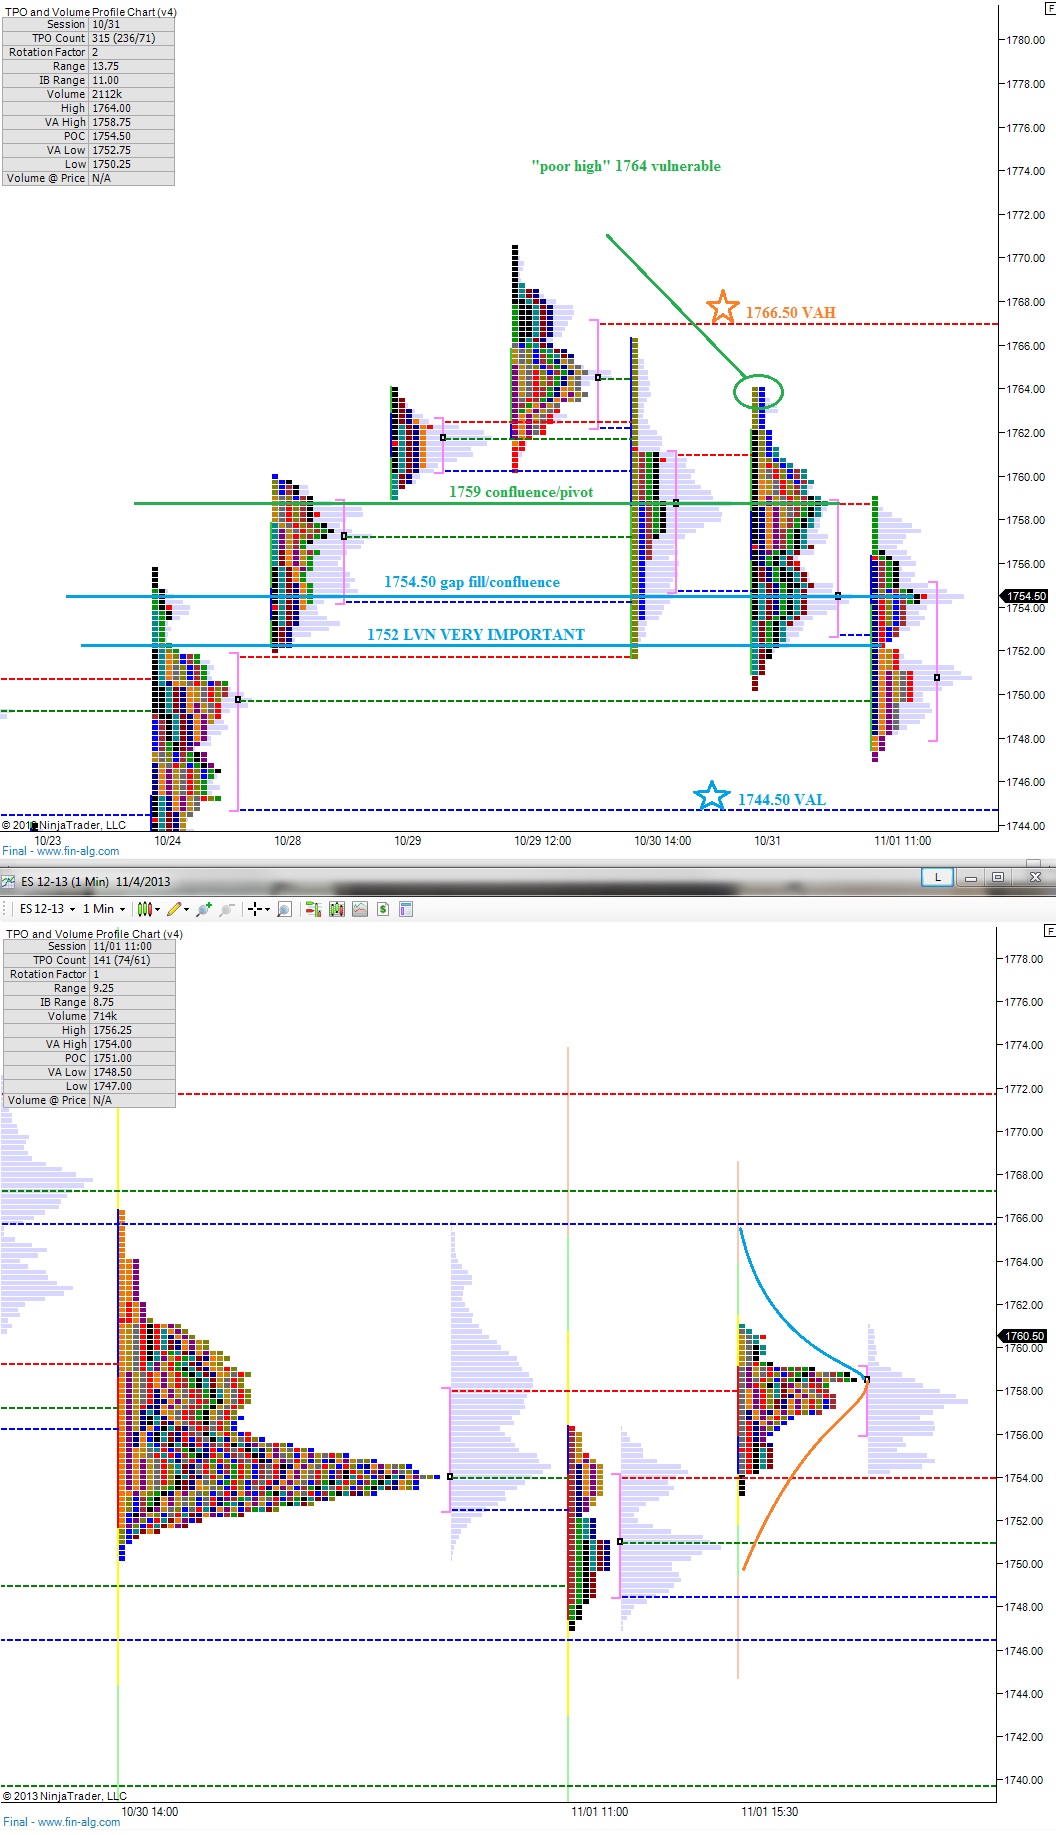
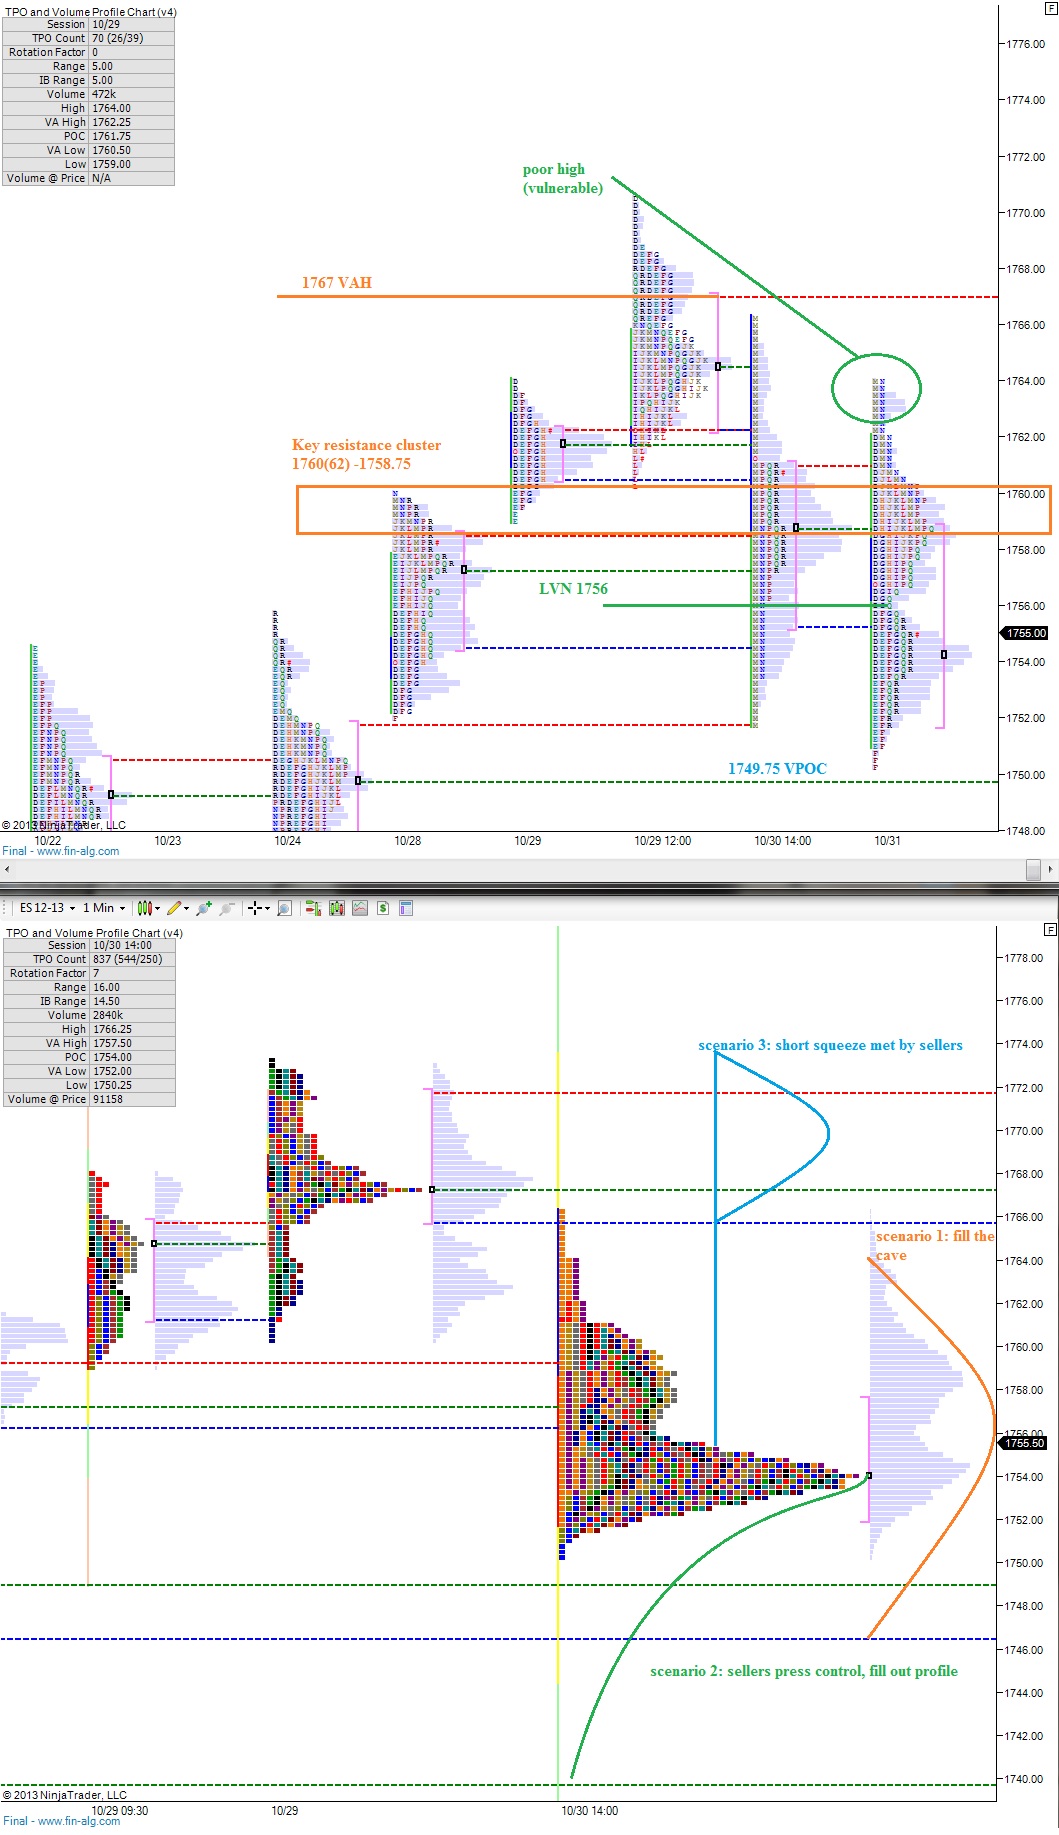
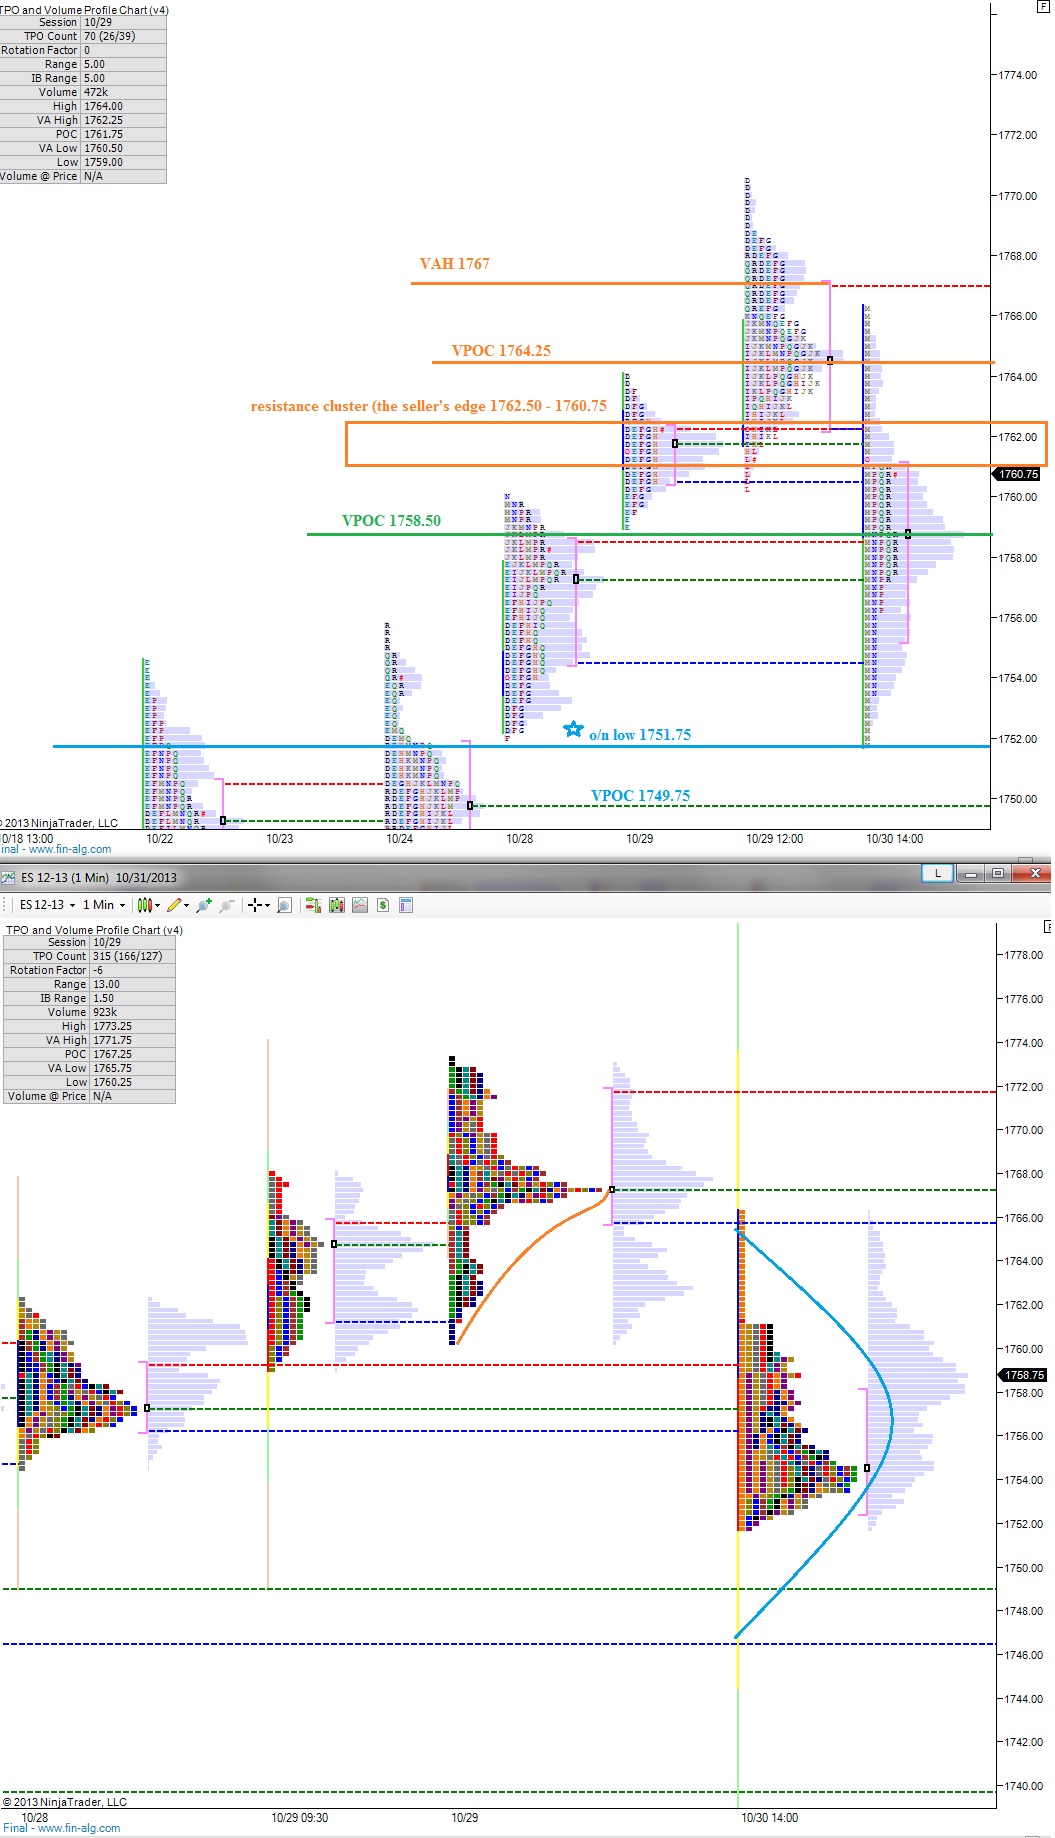
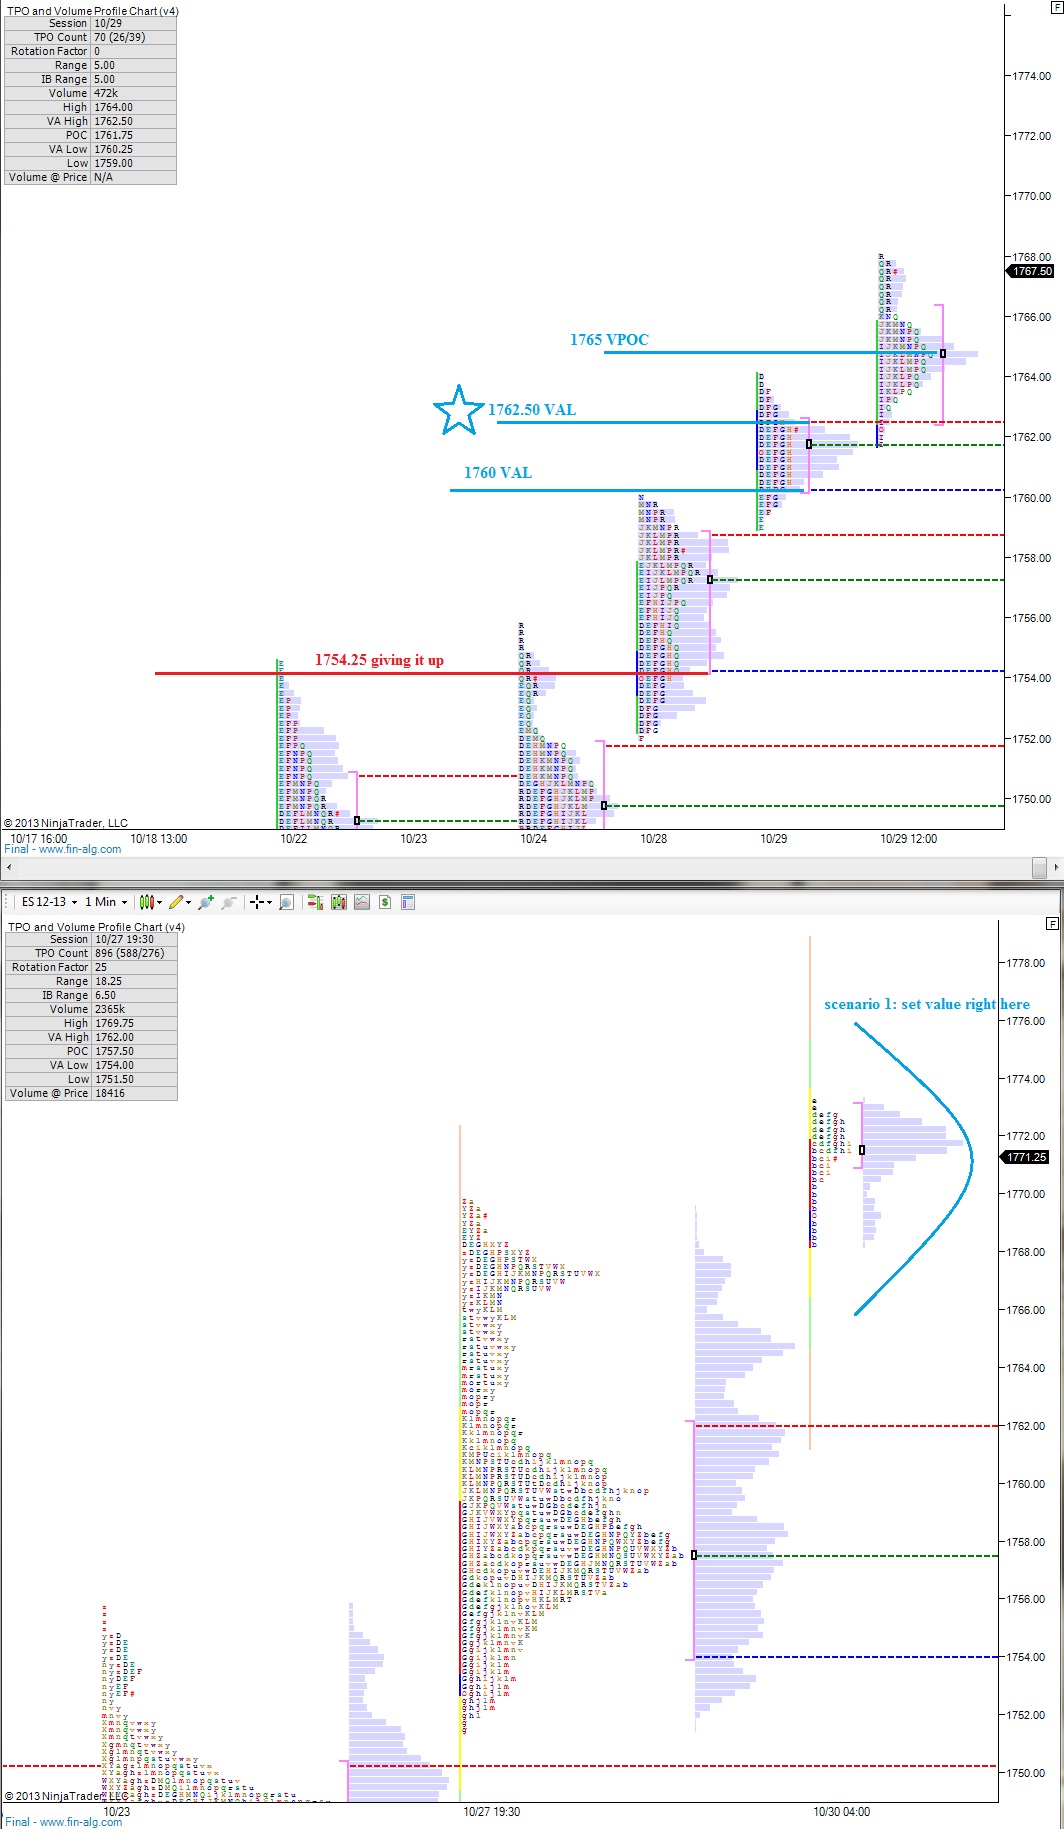
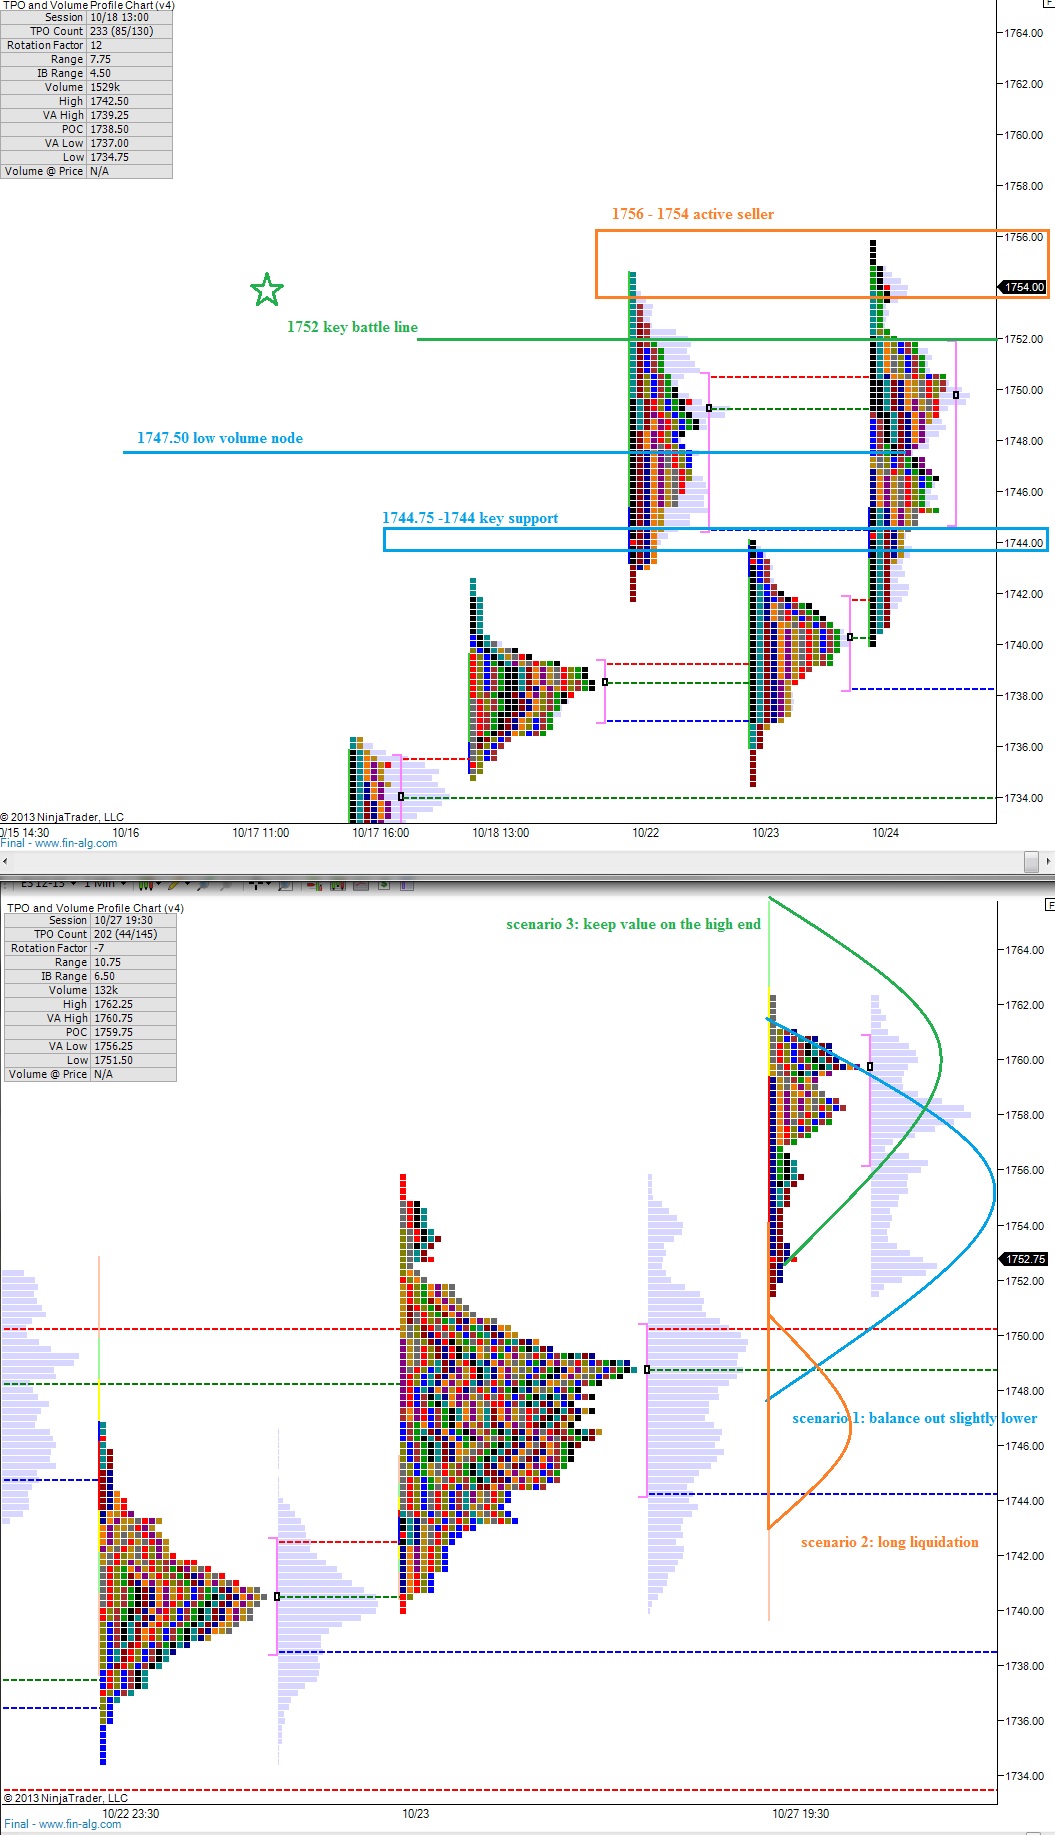
Early on we have employment data which may better set the tone for our session, but the following reference points will still be relevant in determining whether the market is breaking out of balance to the upside or the downside:
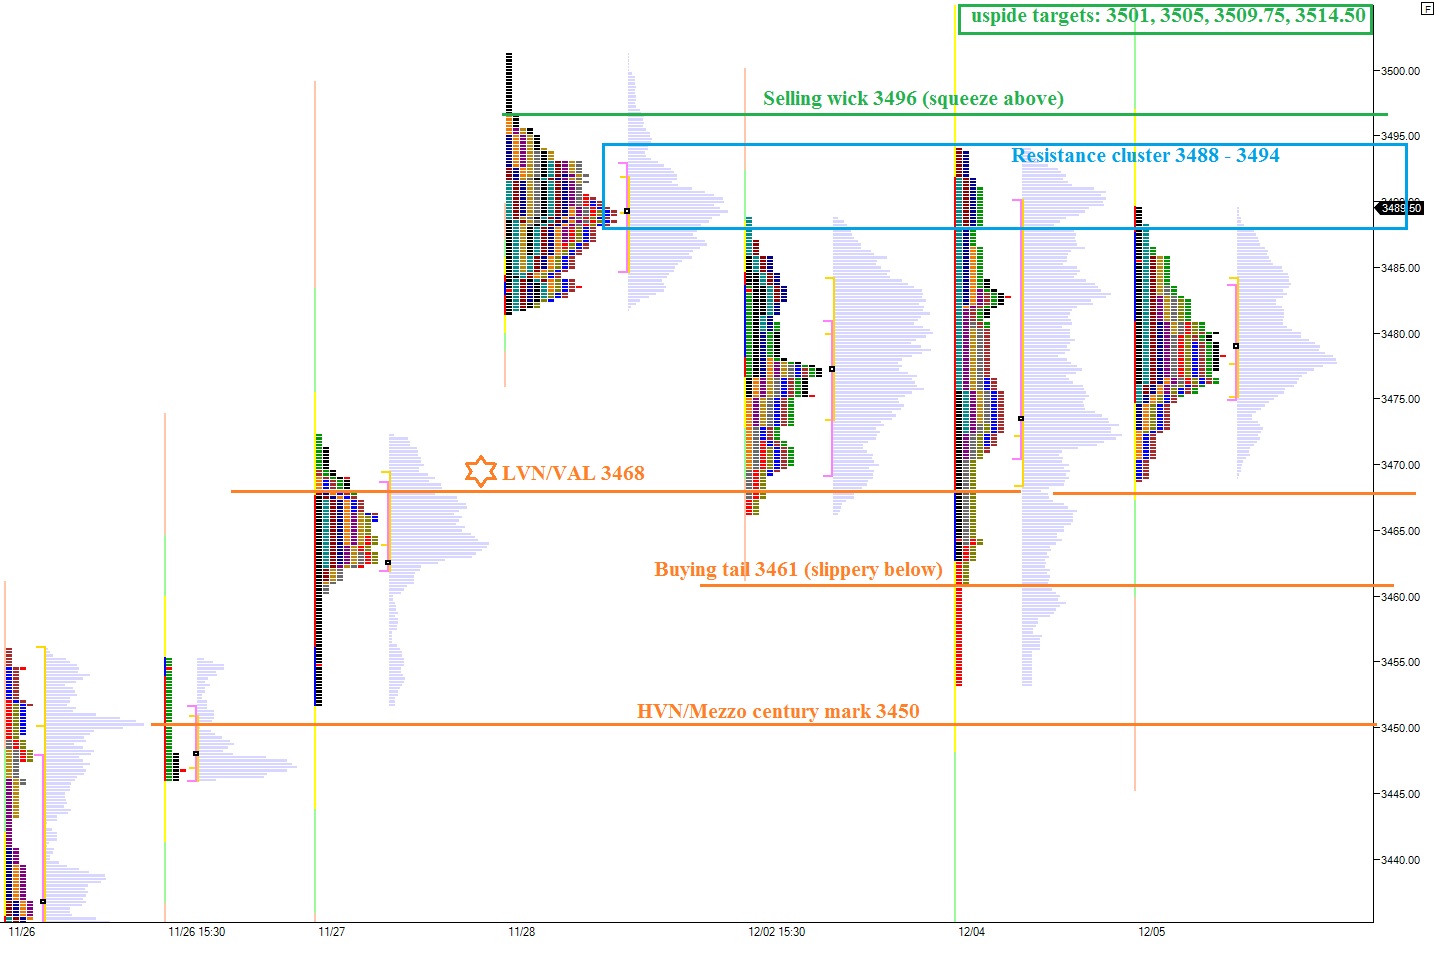
NQ_MarketProfile_12062013


Comments »

Open Outside of Value

The indices experienced some selling early the morning and quickly reached oversold levels which are now in the process of working off as the United States wakes up.

Since our Sunday globex open, the S&P futures have been trading mostly flat in a very balanced and evenly distributed manner.  This makes it difficult to envision any specific scenarios for today because all of the distributions are complete.  Therefore we must focus our attention on the bracket extremes to gauge whether the market is coming out of balance and by which parties hand.

We are currently prices to open outside of yesterday’s value, but still within yesterday’s range.  If the sellers can reject our value area from yesterday, we may see acceptance lower which would suggest a change in conditions from this current bull brigade, a subtle shift we should be aware of should it occur.

I have highlighted key price levels on the following market profile charts as well as displayed the very balanced trade occurring on a 24 hour profile view:

ES_MarketProfile_11122013

Comments »

Catch A Dipper By Their Tail

Early last week we were hot on the trail of a suspected whale on the tape: a large seller who perhaps was much more privy to future knowledge then us, directing massive AUM, and quietly entering the market.  It was a contextual concept that framed our decision making process.

Every morning I would delve a bit deeper into this idea by drilling into the market profiles and determining where this potential bear-whale could show her claws.  She never really succeeded.

As more information becomes available, it now appears what we were observing was not a large individual, but instead a collective profit taking by global money managers.  And coming into today’s gap higher, it appears the market absorbed the profit taking exceptionally.  One of the components of this distribution, or rotation, which kept me constructive on my swing long positions was the structure of the market as we encountered heavy selling.  Have a look:

ES_BARCHART_1106013

The key to determining a successful entry into the year-end performance change in my view is establishing value above 1767.  We would then be told that value is migrating to all-time highs and being accepted.

Down below, the bulls don’t want to lose yesterday’s value area low at 1756 in short order because that would represent a swift rejection by the sellers.

I have highlighted the above levels and a few interesting foot (tail) prints on the following market profile charts:

ES_MarketProfile_11062013

Comments »

What The Overnight Sellers Need To Accomplish

Buyers could not hold on to their afternoon progress overnight when sell flow came in and effectively erased the gains.  The market began to stabilize early this morning but looks vulnerable to another rotation lower.

We are in the process of establishing value on the indices as we work though earnings season and this week’s Twitter IPO.  They busy calendar has done little to the prices on the Nasdaq and S&P index thus far, but that is likely to change as the week presses on.

With that in mind, I like to define the edges of the field or price levels which would tell me we are transitioning out of value and into vertical discovery.  I have highlighted these levels below on the following S&P RTH Market Profile Chart.  I used the Nasdaq 24-hour chart to envision a few scenarios on the day because the S&P 24-hour chart is very fragmented:

ES_MarketProfile_11052013

Comments »

What The Overnight Buyers Need To Accomplish

The stock index futures were strong during the entire globex session which spans from Sunday evening 6pm to the opening bell at 9:30am.  The action thus far has pressed the /ES futures (the contract tracking the S&P 500) six handles above Friday’s closing price of 1754.50.

Long-term, we are still in an environment where the buyers are in control of the auction.  This can be seen on daily bar charts as a series of higher highs and higher lows.  We can view this longer term control in Market Profile by observing the continued migration of value (or volume-at-price) higher.

Last week, we began seeing signs of an active seller who managed to gain a foothold in the action and press value lower four sequential times.  However, late into Friday’s session we saw dip buyers on the scene who regained control late in the day.

The key upside level I will be watching today to gauge whether the bulls have regained control of the short-term auction is 1766.50.  If we can sustain price above or tightly below this reference point we can hypothesize the buyers have gained control of the short-term auction.

The current conditions can be summarized as follows:

Long-term control: buyers

Short-term control: sellers

Overnight-control: buyers

I have highlighted the key price levels I will be monitoring to gauge intraday progress by the auction on the following market profile charts as we as a few scenarios to envision as the day progresses:

ES_MarketProfile_11042013

Comments »

Control Into The Weekend

We are coming into the first of the month, a Friday, the day after Halloween, with the long-term picture of an auction controlled by the buyers.  The sellers have recently stepped up and have been absorbing aggressive buying more successful then we have seen in a while and they made an aggressive push into the bell yesterday.

The sellers have an opportunity to sustain their foothold today.  The overnight action stayed below the low volume node at 1756 signaling little has changed to the level of conviction the sellers possess.

Early on the 1756 level is in play and is my early tell of sentiment.

The overall picture of the S&P looks fragile both on the upside and lower therefore I am keeping an open mind.  I have presented a few scenarios to guide my vision on how today may print and also highlighted key price zones on the following market profile charts:

ES_MarketProfile_11012013

Comments »

Asserting Control

The sellers gained control of the day session yesterday when they successfully pressed lower in the afternoon.  However you can see the lack of conviction from the sellers at this juncture because again the lower prices attracted dip buyers who returned price back up near the mean of trade by the closing bell.

The sell flow returned during the evening yesterday before again being met by dip buyers who have returned price back to yesterday’s closing print.

This action is a product of the long-term characteristics favoring the buy side.  I have highlighted a resistance cluster from 1762.50 – 1760.75 that the sellers need to defend early on to sustain the foothold they established yesterday.

I have sketched out a few possible scenarios on the day also.  These are really just visions of how these incomplete profiles will fill out into nice, Gaussian distributions:

ES_MarketProfile_10312013

Comments »

Halloween Stop Hunt

The indices pressed to new highs overnight in a rather one directional manner starting around 8pm EST.  The action has pressed the /NQ into very short term overbought territory and my expectation is to see a rotation lower early on, perhaps even premarket.

The action has left behind a four handle gap on the /ES which may entice lower prices for the fill.  Yesterday’s gap higher did not completely fill and was one of the tells to stay long.  Often times you here tips like don’t fight the tape or go with the flow but never a clear indication of what exactly to look for.  Yesterday had two tape/flow visual cues.  The first was the failure to fill the gap lower.  The second was when sellers could not produce a range extension lower.

Range extension refers to price travelling above or below the high/low print of the first hour of trade.  You do not need market profile charts to note this occurrence.  All you need are 30 minute candles.  Most days only see range extension in one direction.  Therefore, when price never extended lower yesterday you would be fighting the tape by attempting to initiate shorts.

I have highlighted a scenario on the following market profile charts as well as key support levels:

ES_MarketProfile_10302013

Comments »

So Easy A Caveman Can Do It

Overnight the /ES held firm and appreciated a bit while the /NQ recaptured the losses incurred after the AAPL earnings.  Both indices are trading near their respective highs as we come into Tuesday’s trade.

The nature of our current trade is balanced and becoming quite mature.  The market is nearing a point where it needs to press the extremes of balance to determine if in fact value needs to migrate higher or lower.  Early on the buyers have a chance to press into an already committed seller (see prior posts) with their positioning early on today.

I have highlighted 1765 as the final stand for the profiled seller.  Should this level give way, I believe we are in store for another exploration higher.  I will be watching trade around this area closely and also how some of the well set up stocks behave if we trade into these levels.

There’s plenty of support down below, but the most significant level to my eye is the mezzo century mark at 1750.  Should the VPOC at 1750 fail to hold prices, we may see a swift rotation lower as the large seller becomes emboldened.

So today is simple:

– Mature balance

– Ready to test extremes

– 1765 and 1750 are your extremes

– TRADE ACCORDINGLY

I have highlighted a few scenarios and important price levels on the following market profile charts:

ES_MarketProfile_10292013

Comments »

Sticking With Last Week’s Idea

Picking up right where we left off, we observed what appeared to be a large seller at work Friday afternoon.  It seemed as if the seller backed off from the offer toward the end of the day which finally allowed the immense amount of pressure on the offer to push price higher.  The buy flow carried a bit of follow-through into Sunday evening’s globex session, but as America wakes up the index futures have pared back their gains and are trading back in the whale’s wheelhouse.

The resulting action has left a few thousand contracts worth of excess above our current trade price levels.  It will be interesting to see how the market behaves early on in relation to the range from 1756 – 1754.  If price trades these levels early on during RTH we can gauge the seller’s conviction early on this week.

The trend is still up, the indices do not often make swing highs during the afterhours, and there is plenty of support below.  Therefore it is prudent to respect the trend of the timeframe you are trading when observing these very short term market activities.

I have highlighted some key price levels and drawn out a few scenarios on the following market profile charts:

ES_MarketProfile_10282013

Comments »