iBankCoin
Home / Market Profile (page 140)

Market Profile

Planning an Intraday Short Sale

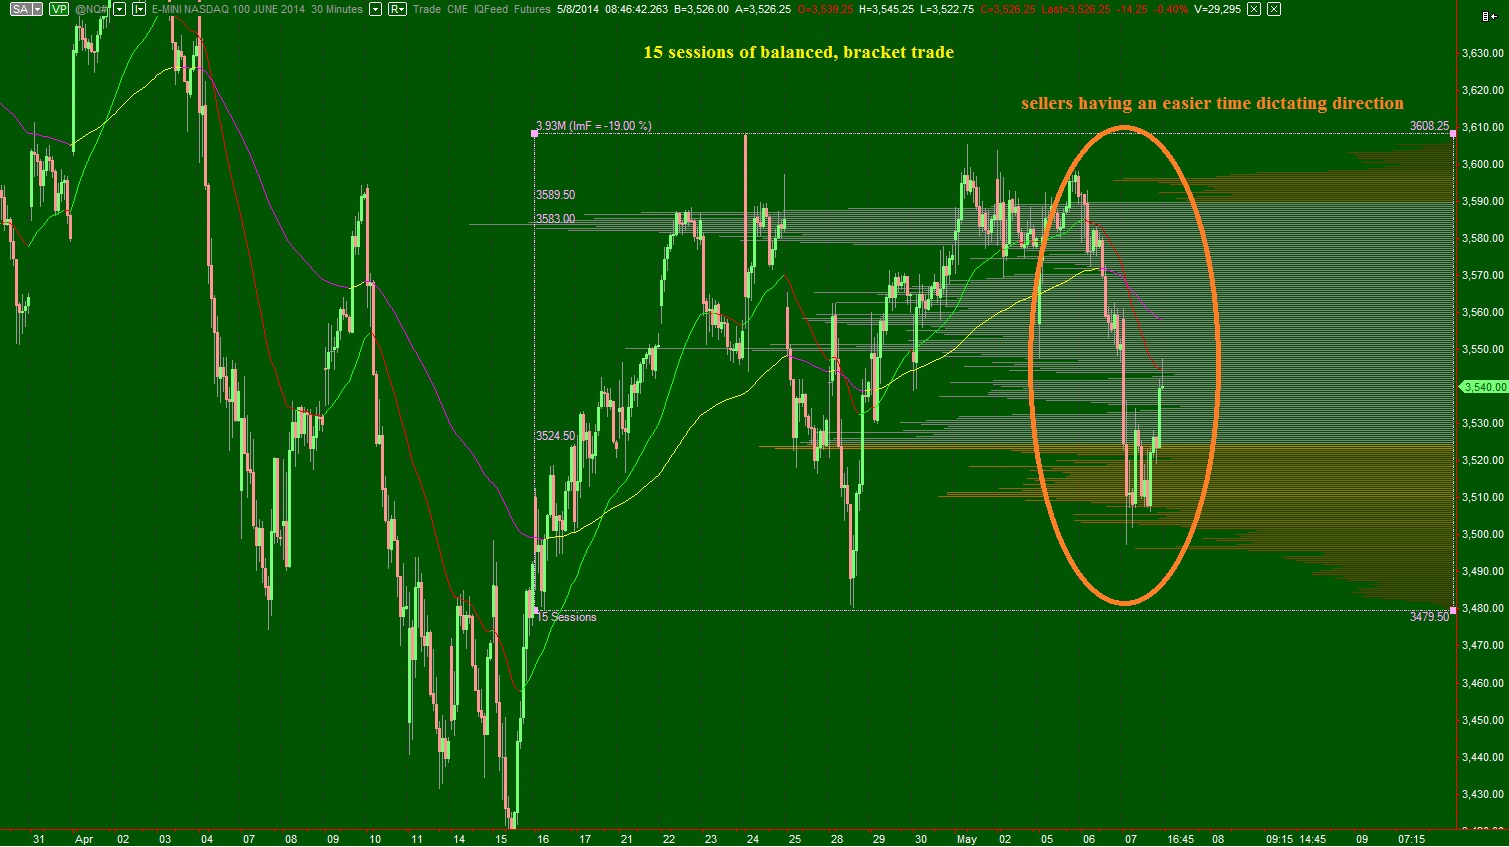
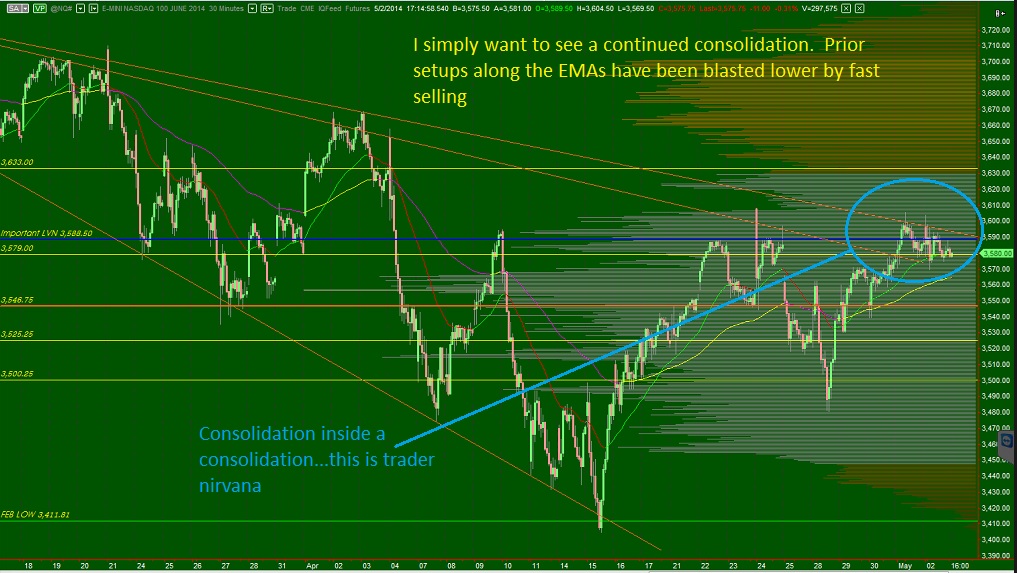
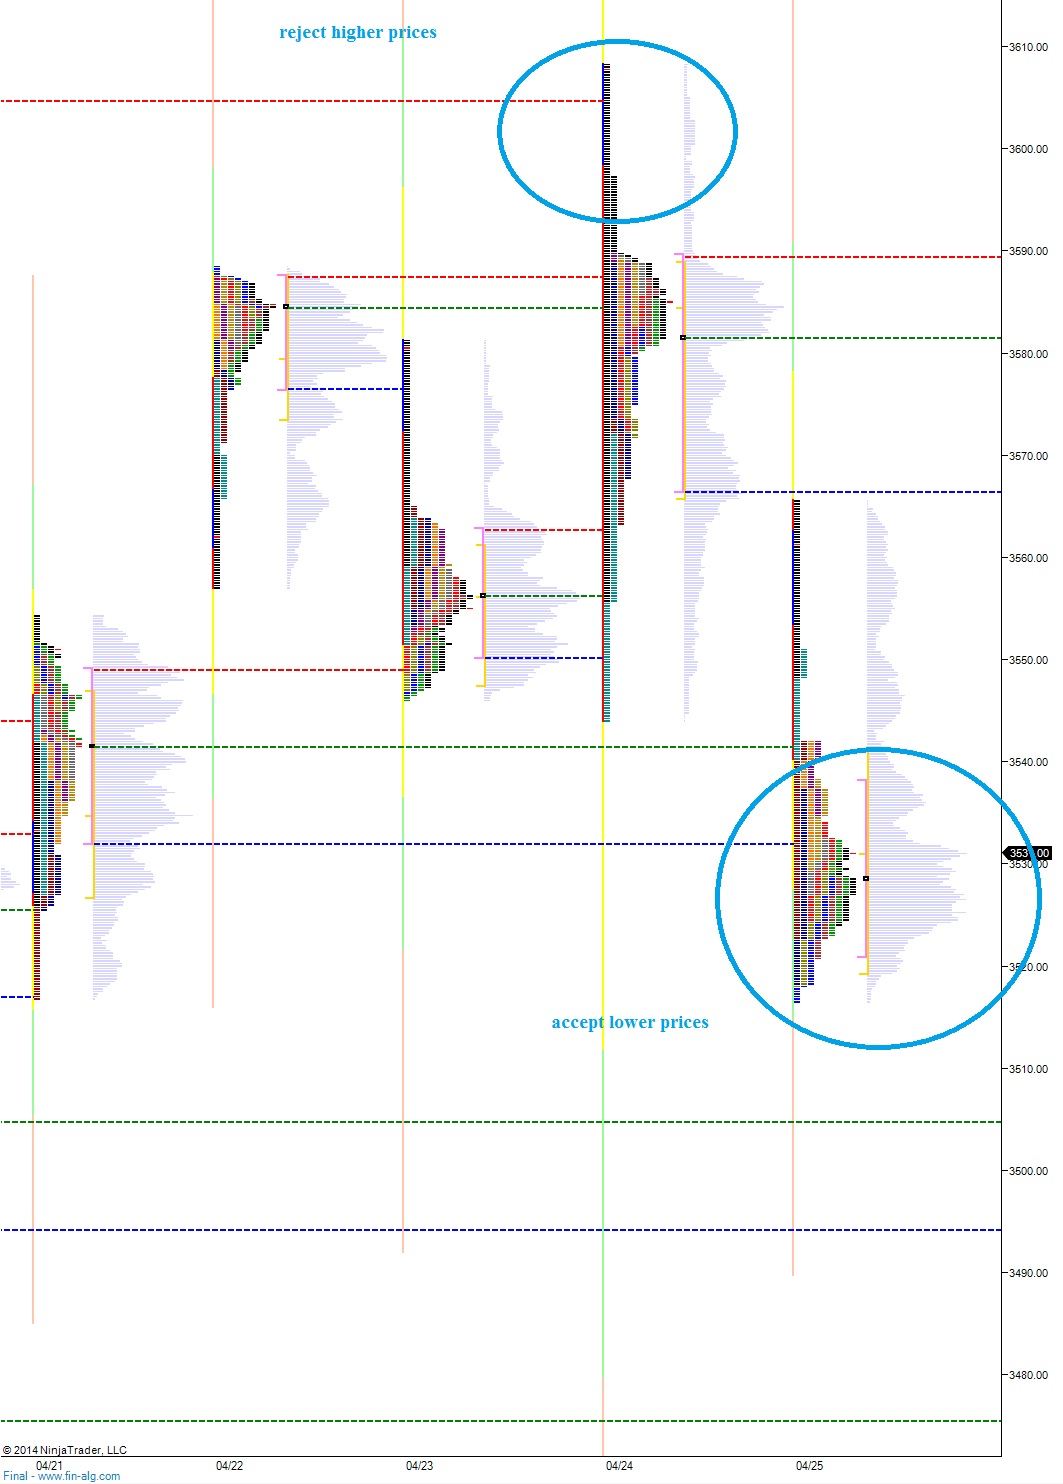
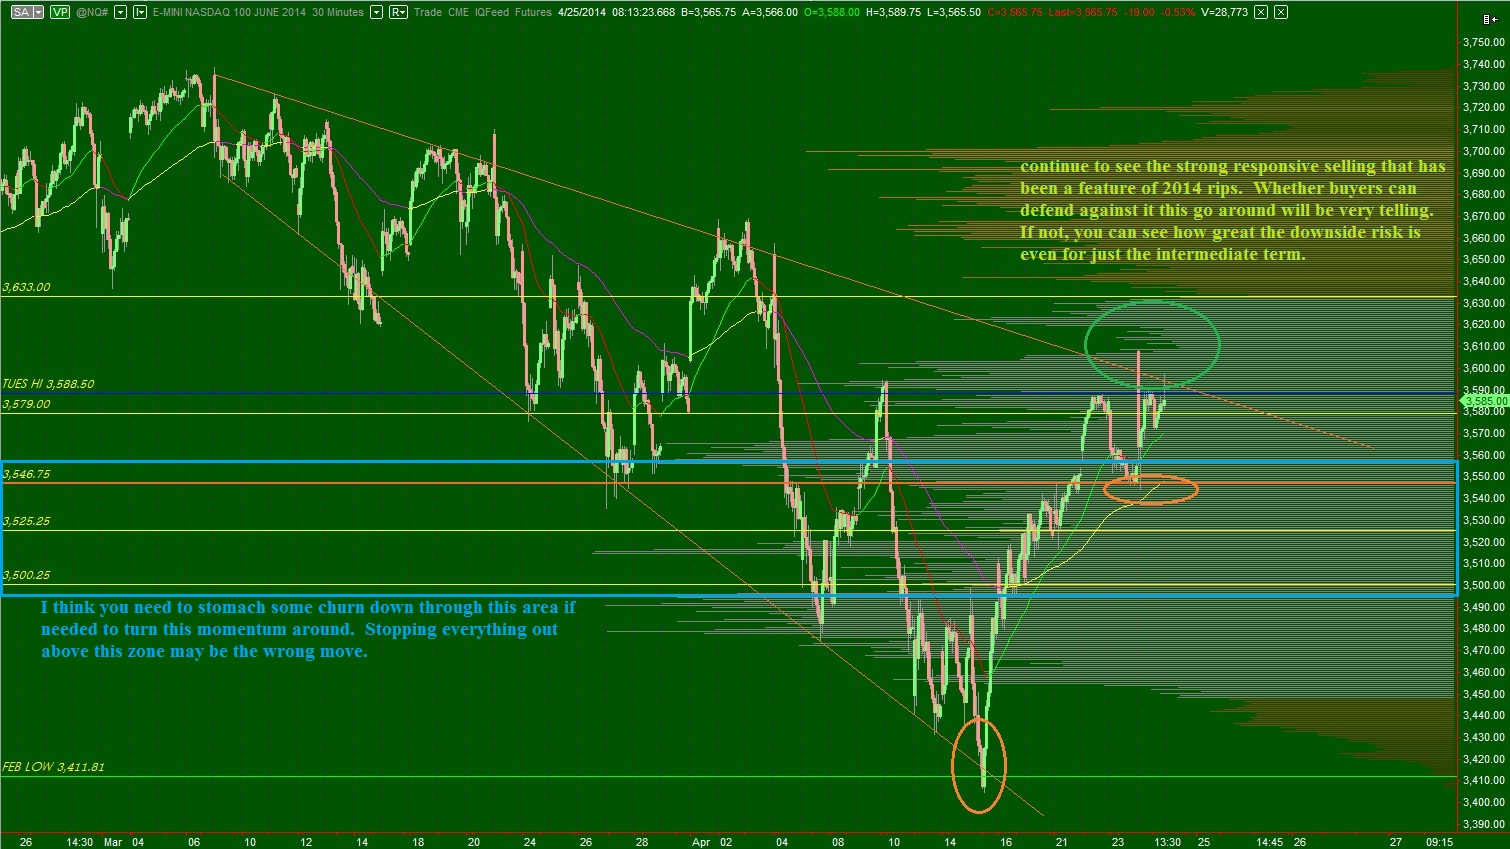
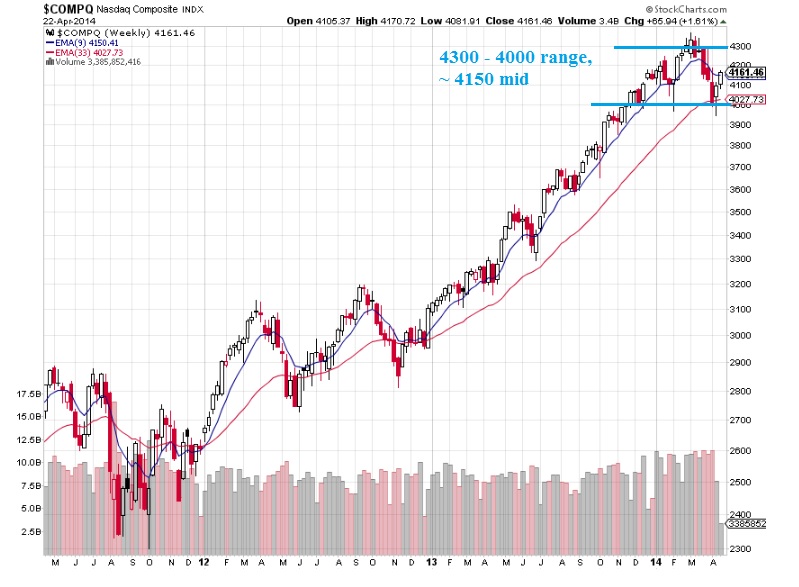
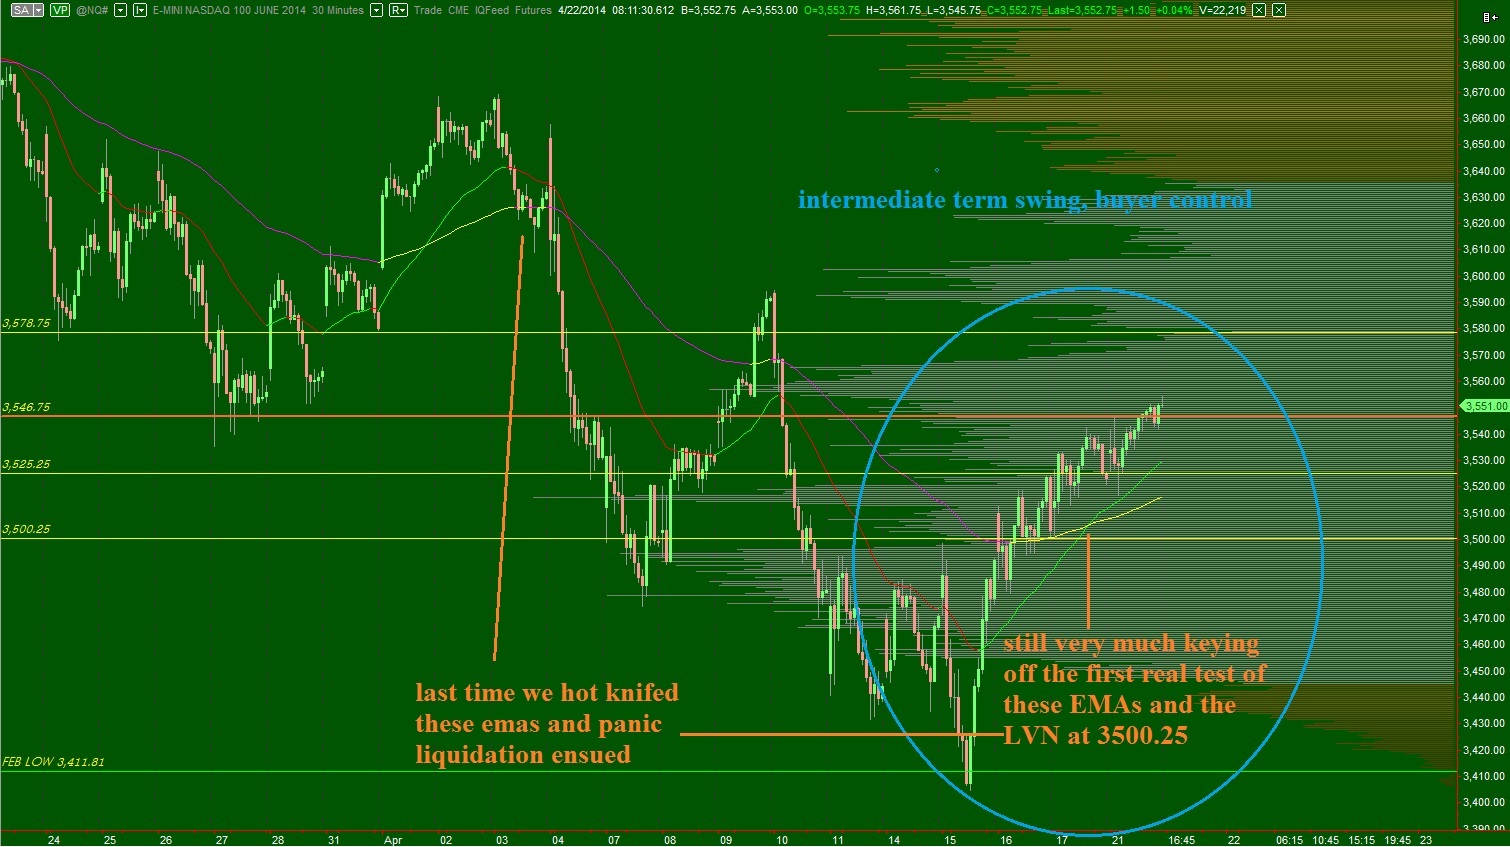
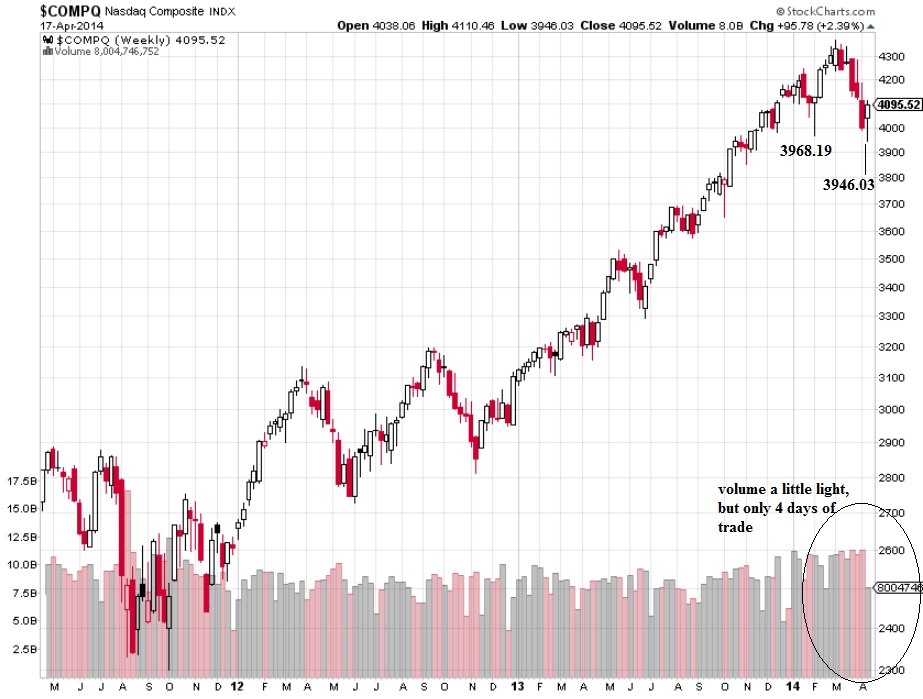
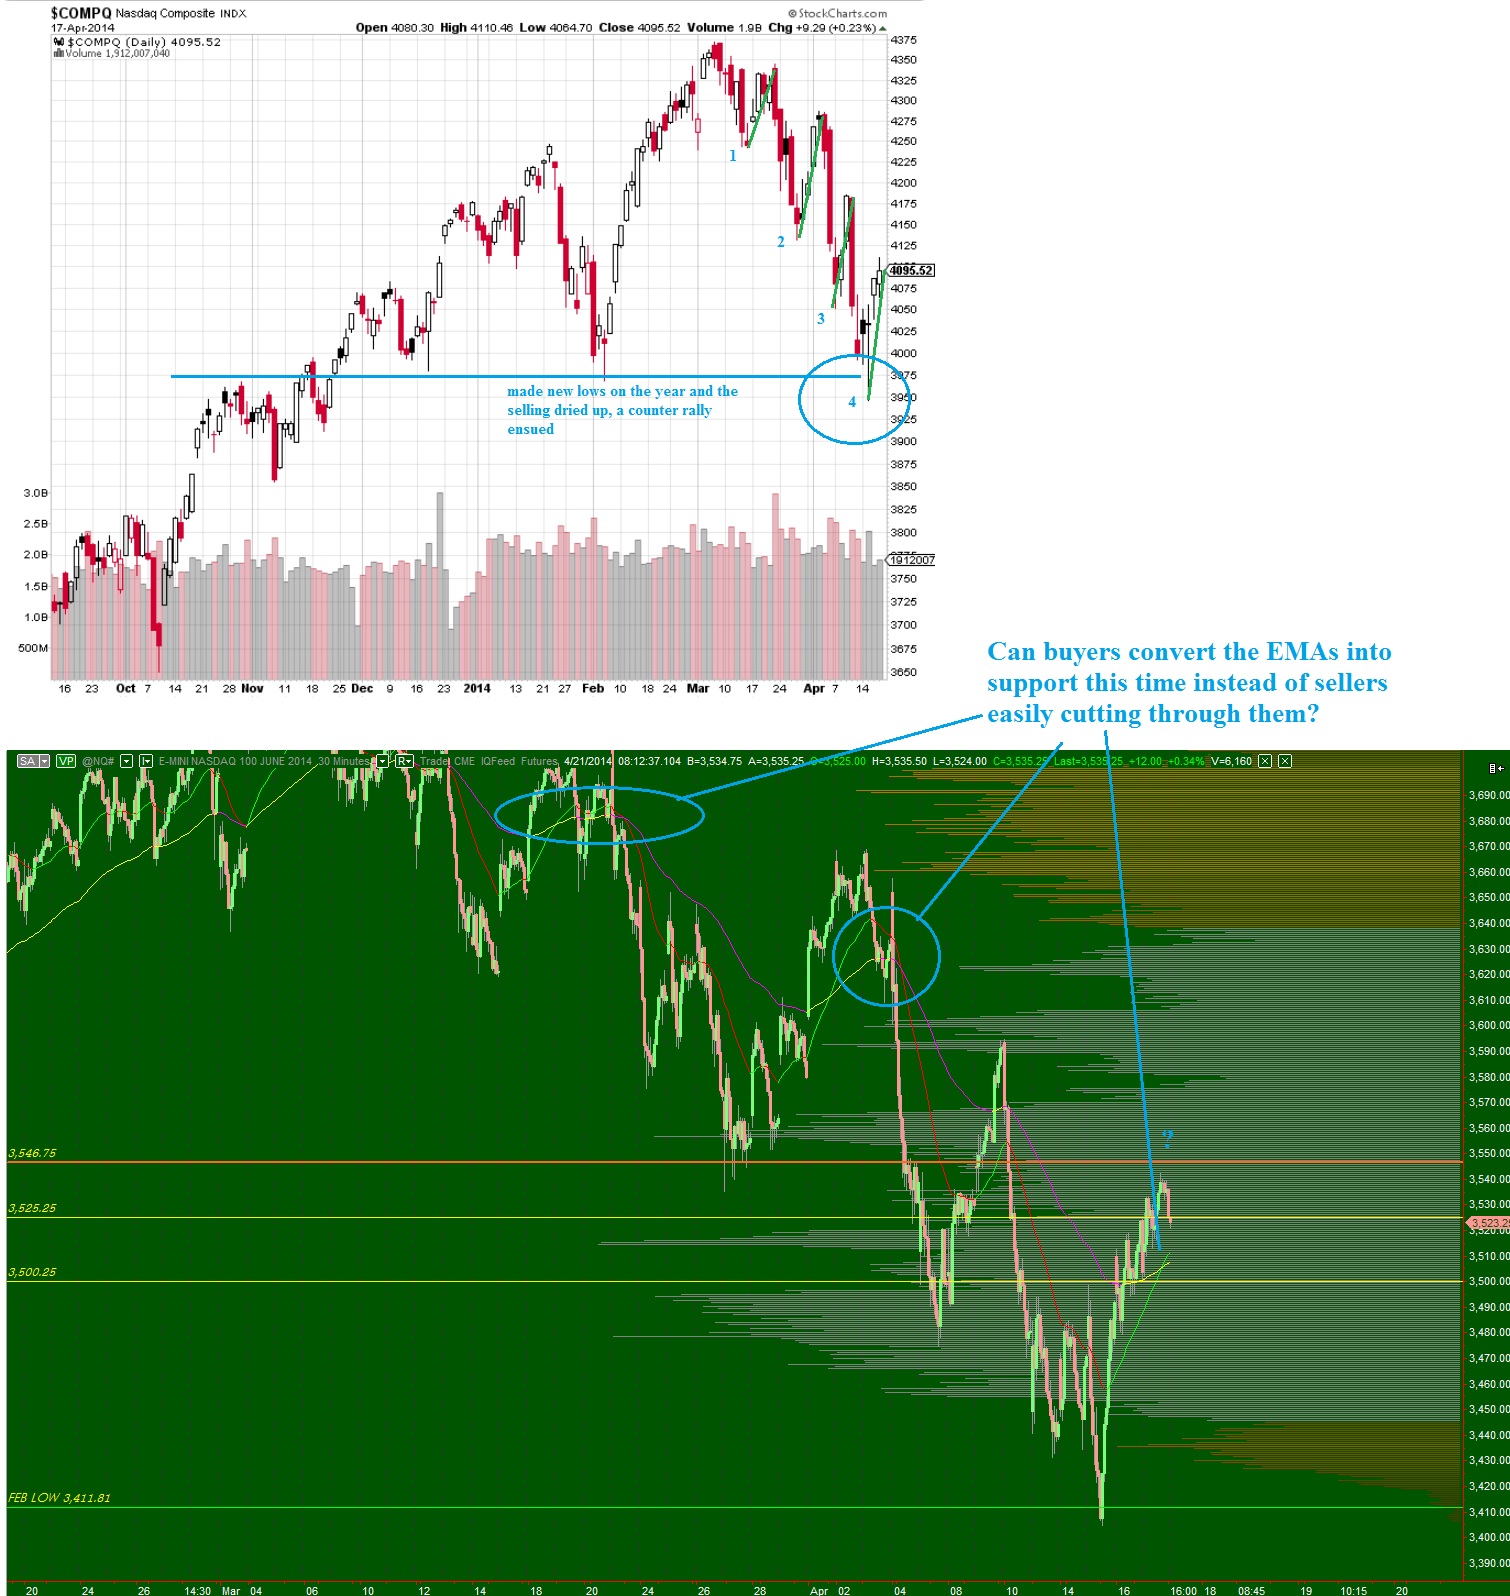
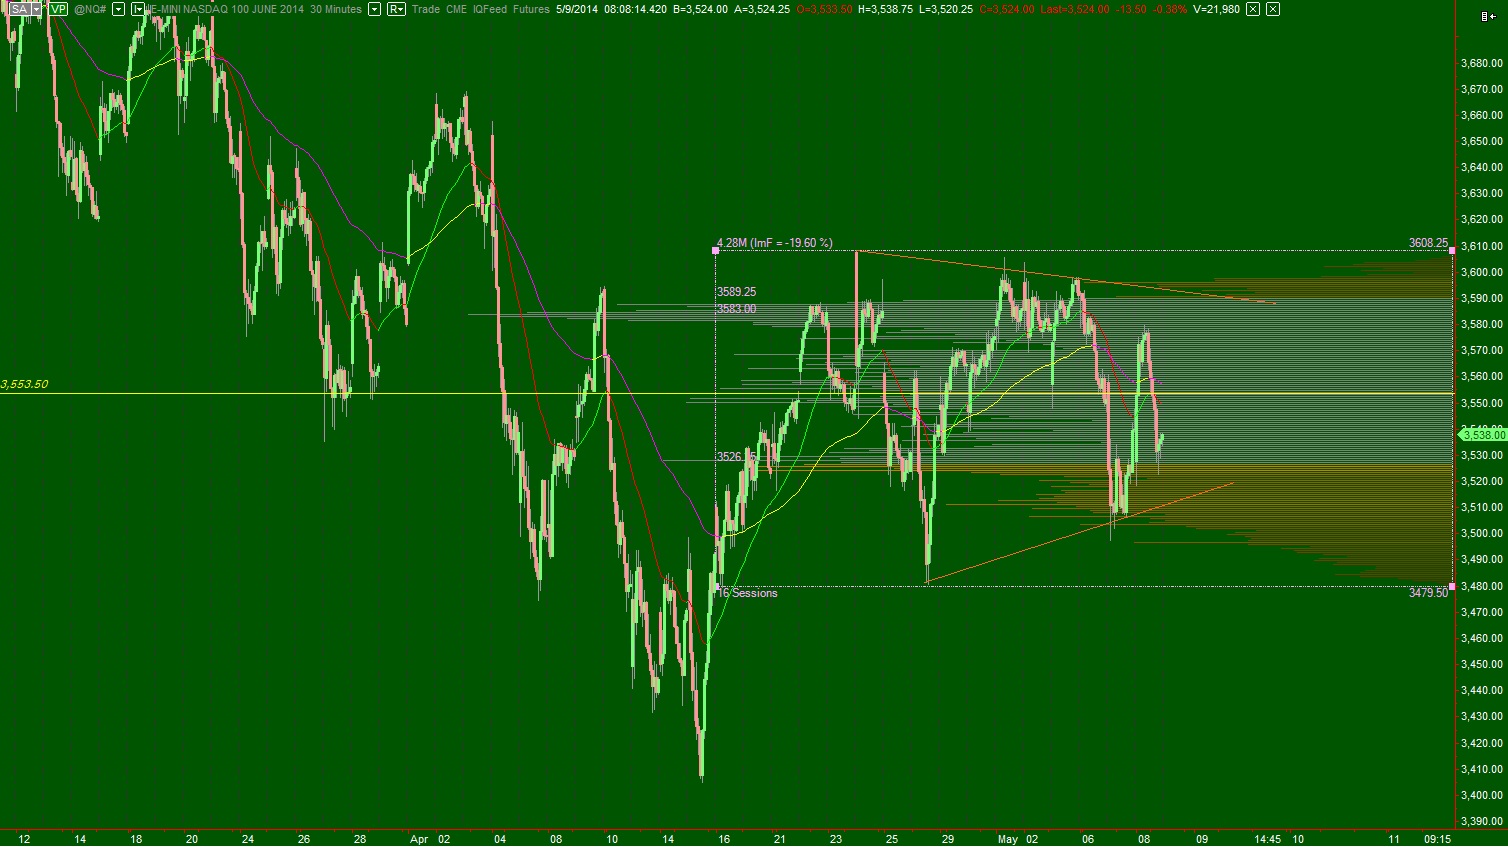
Although we spend most of our time seeking the early stages of trends in either direction, trends we can ride for profit, we must accept that more than half the time the markets simply balance inside of bracketed ranges.  Right now is one of these times in the Nasdaq, where price has come into balance on the long term timeframe.

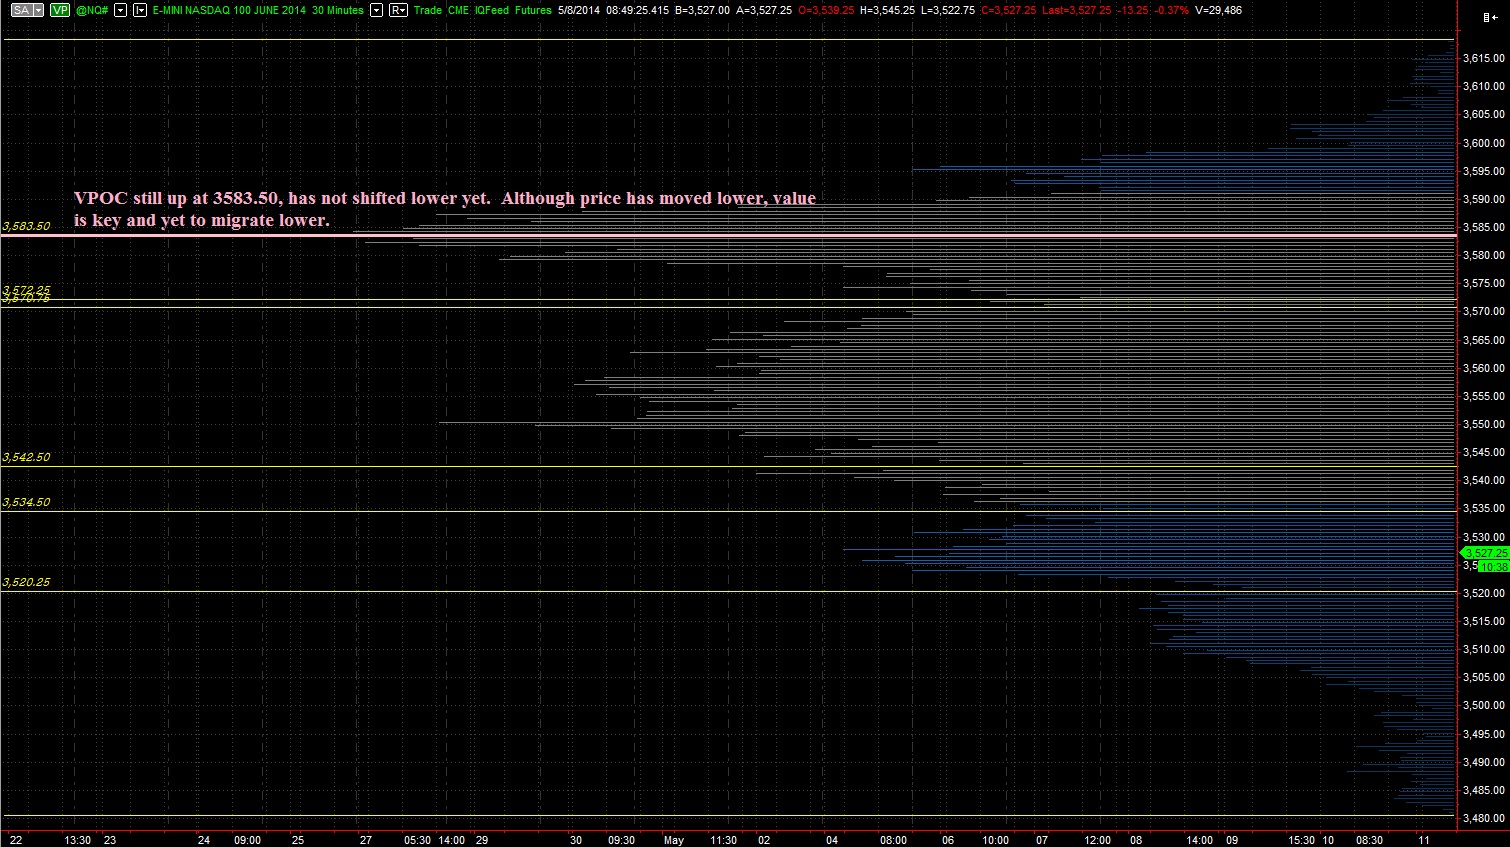
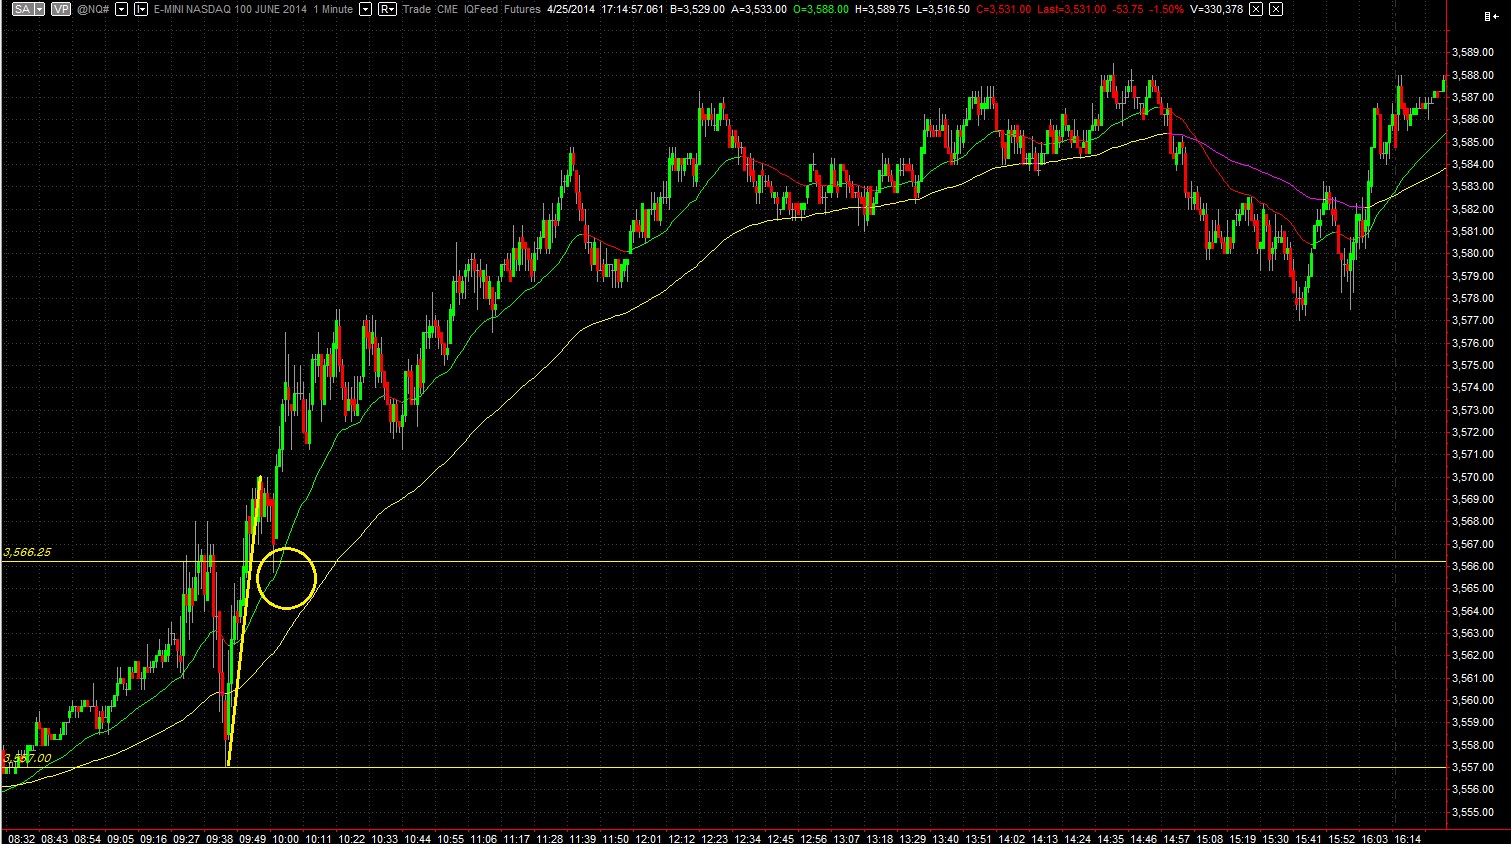
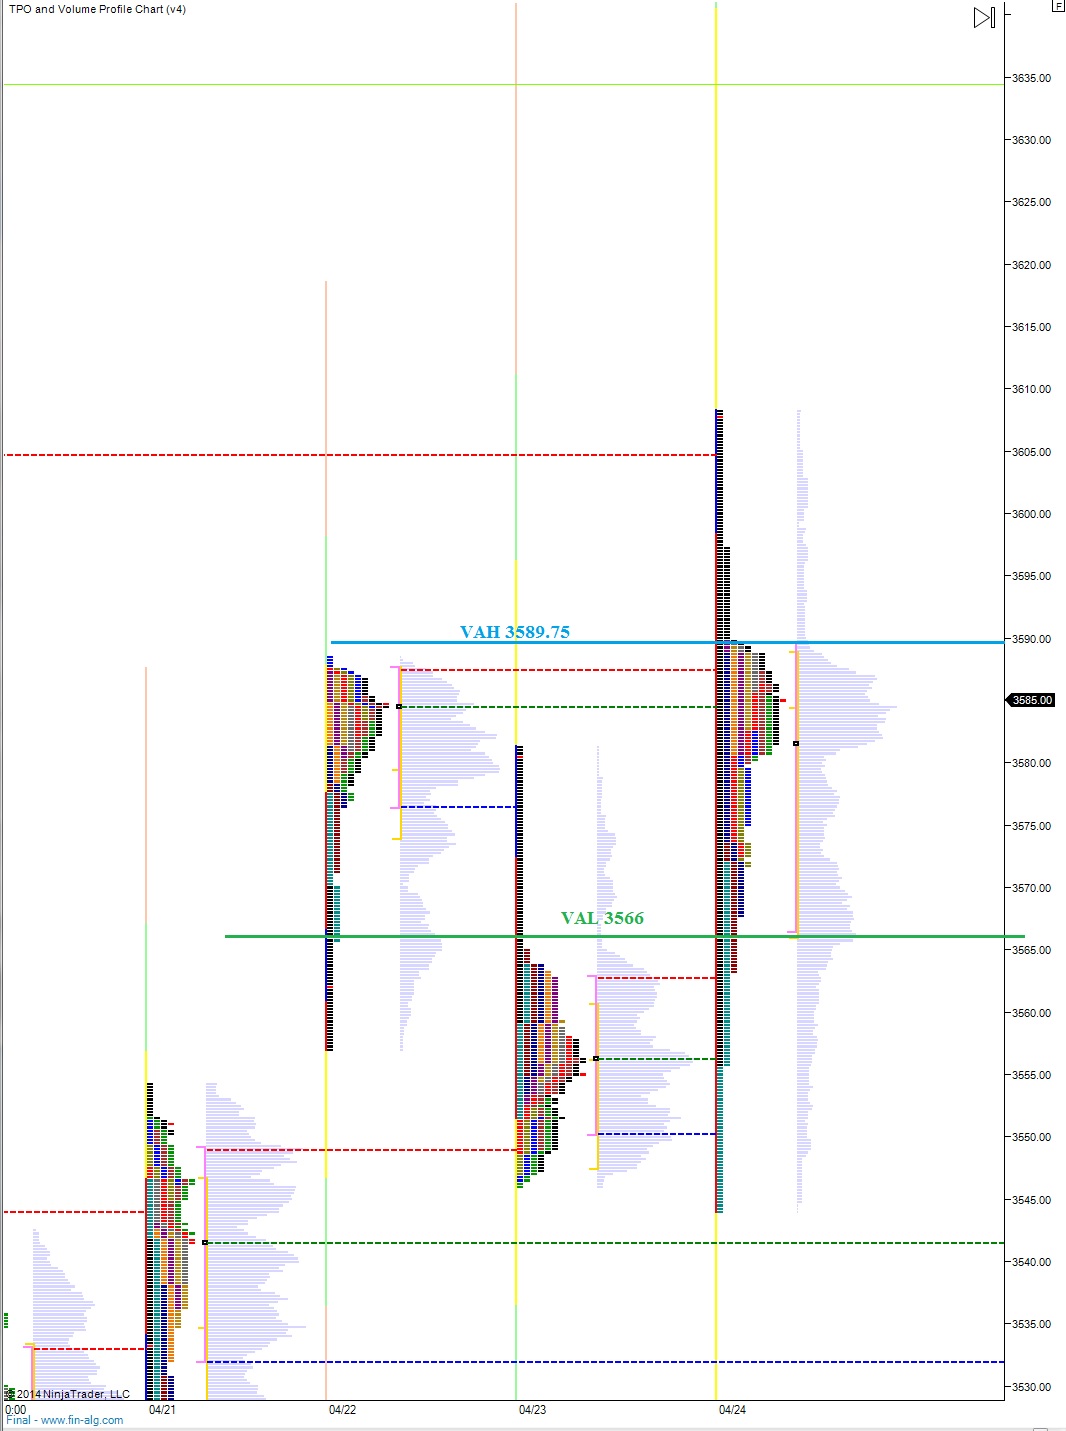
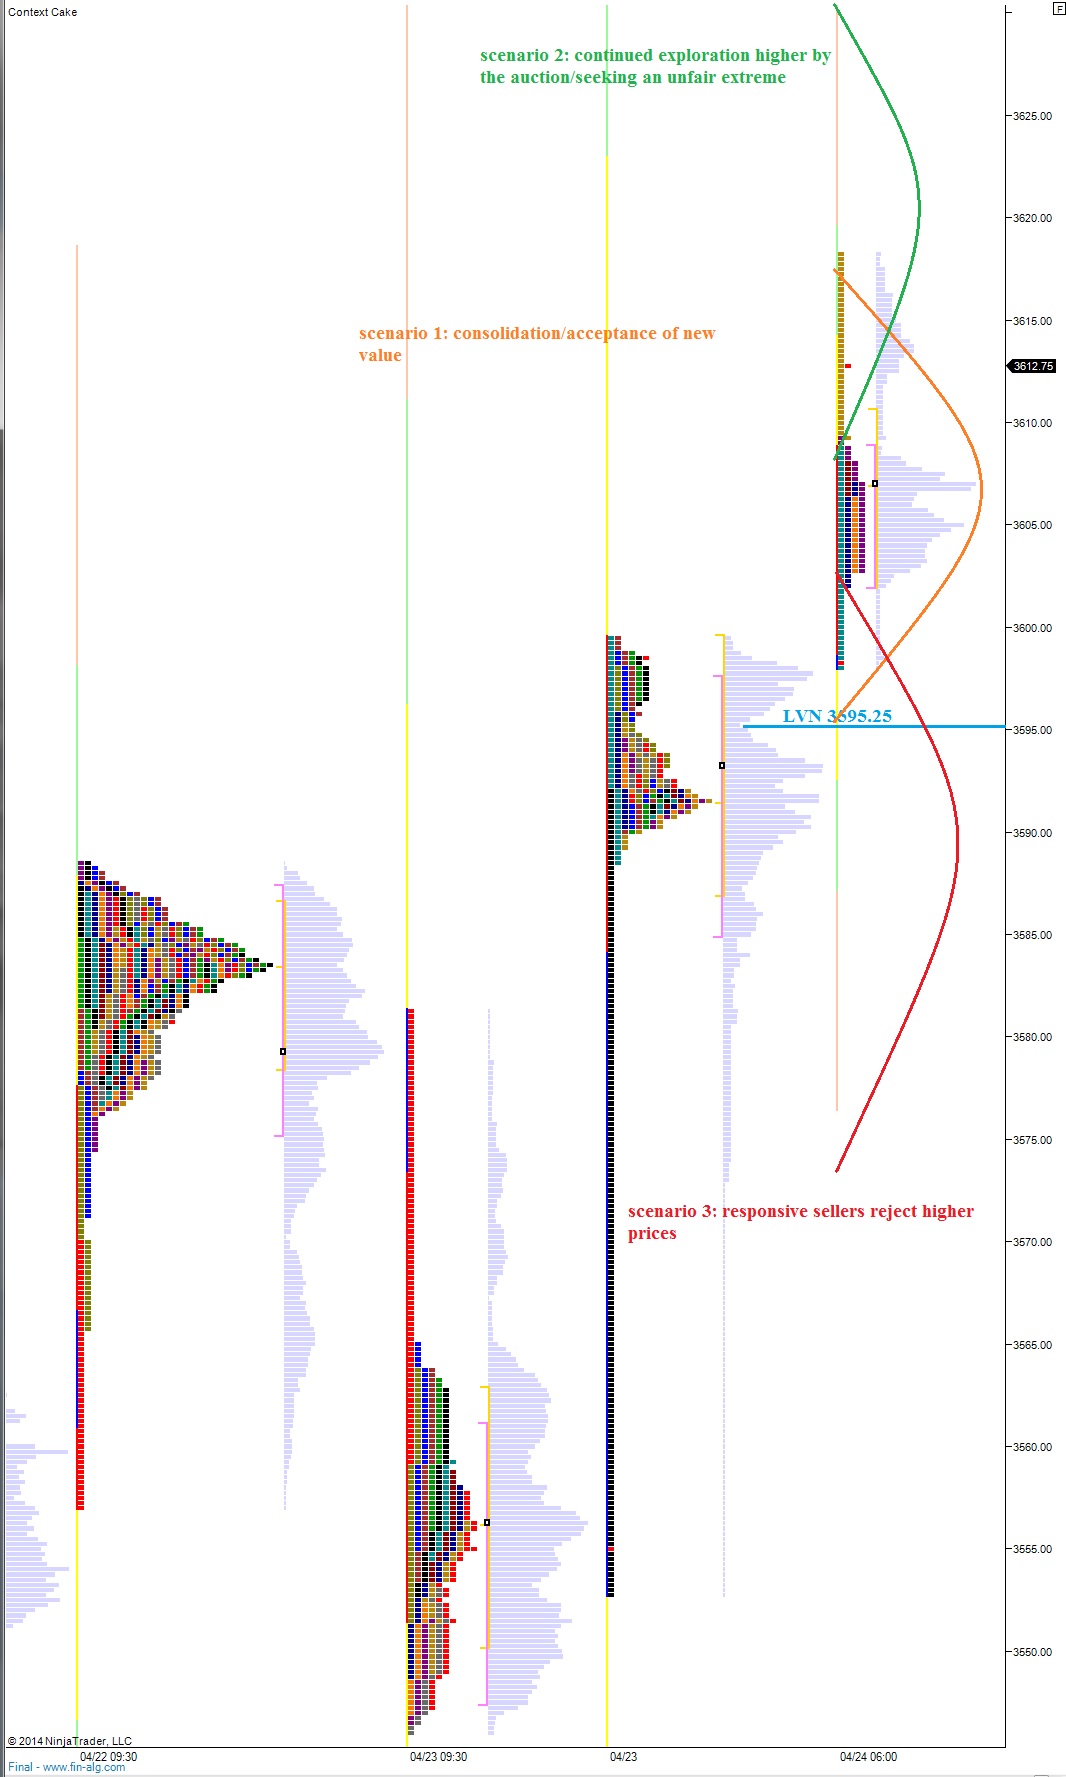
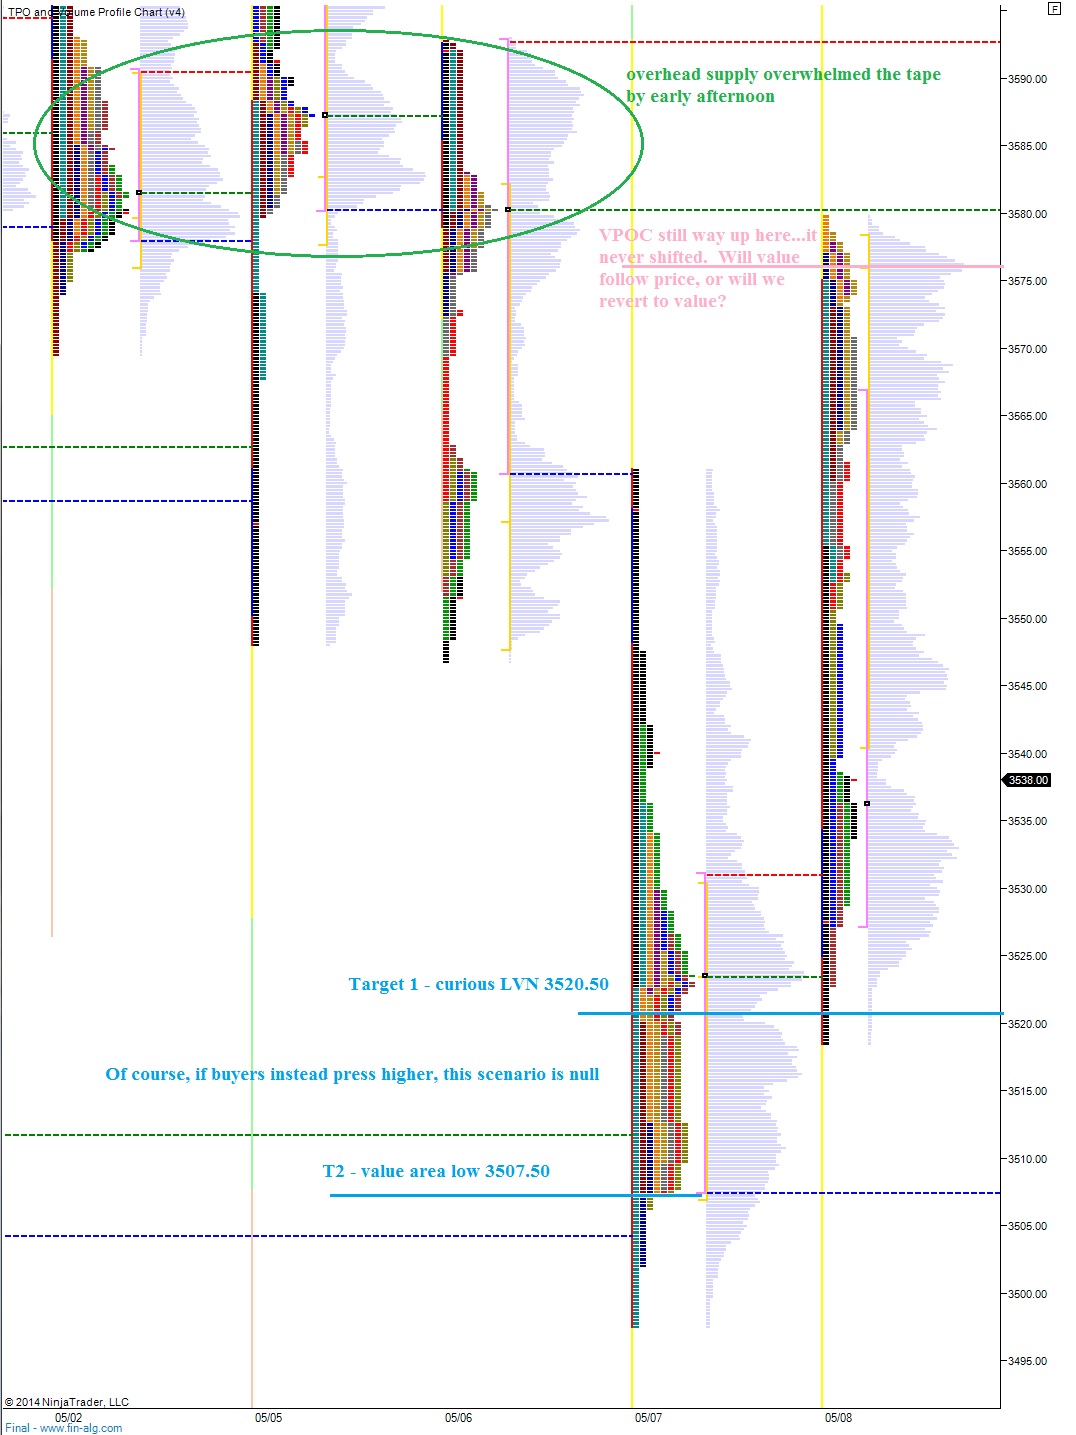
Making the picture even more interesting today is how our intermediate term is also in balance.  See below:

NQ_IntermediateTerm_05092014

The best strategy until this balance resolves is to ride out any current positions, and sit on your hands unless you have an enticing setup you simply cannot resist.  If you do enter a position, it is best to stick to one side of the trade (long or short) and use the bracket extremes to gauge the correctness of your trade.  Thus, risk skews in your favor if you can enter a long position below the midpoint of balance or above the mid for a short.

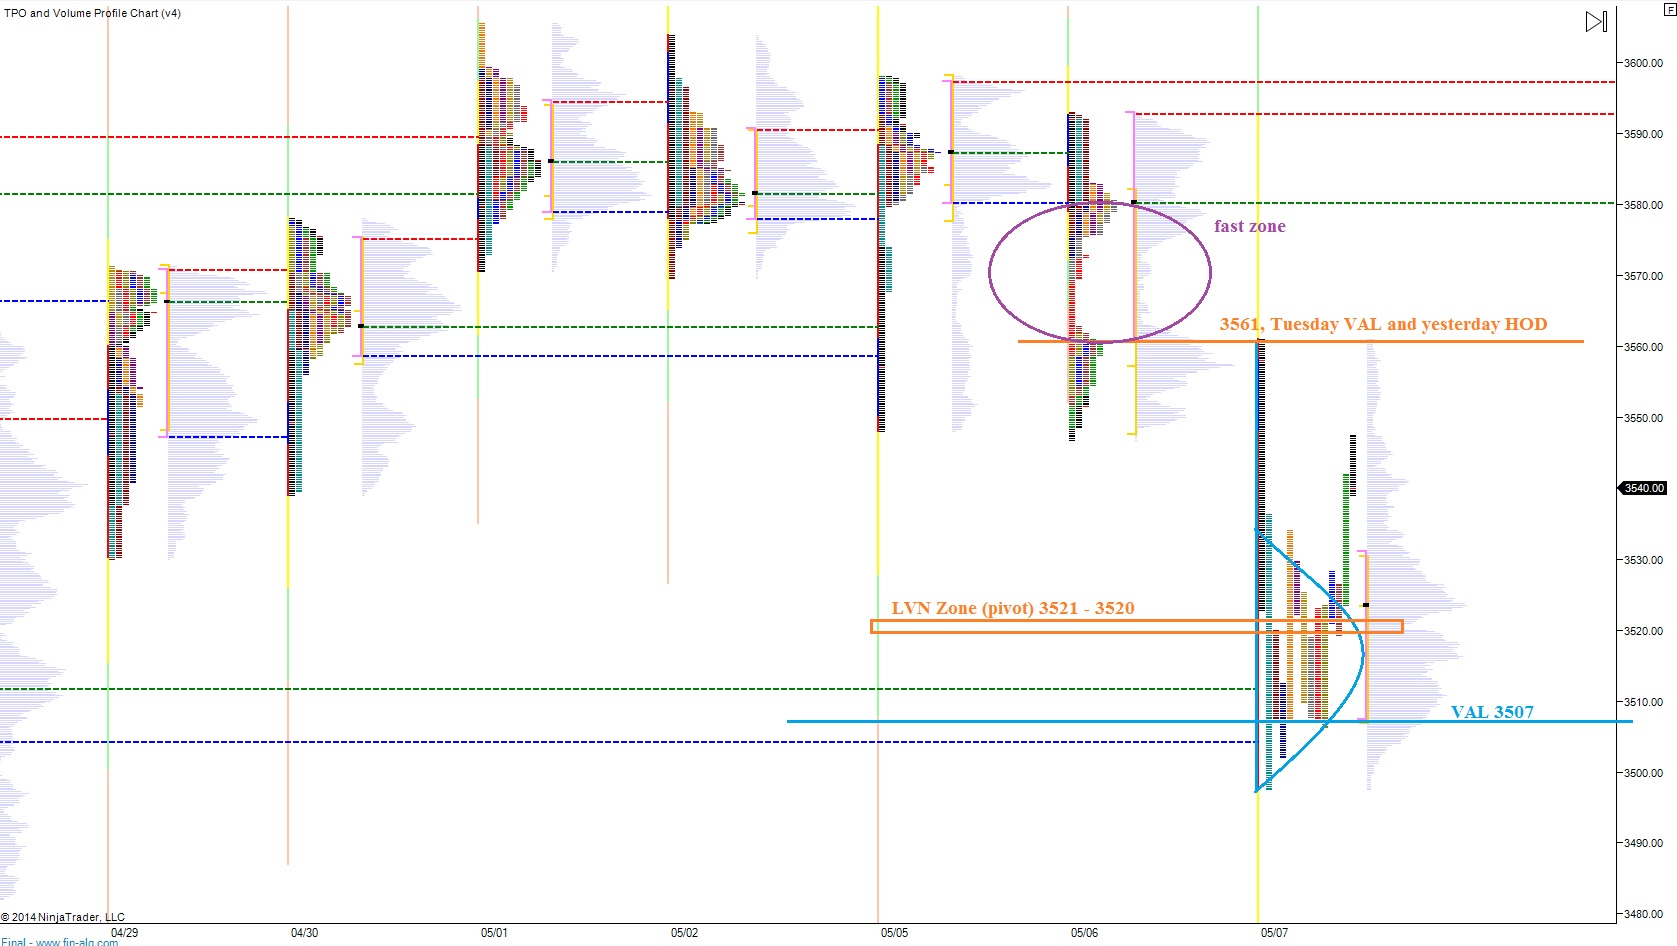
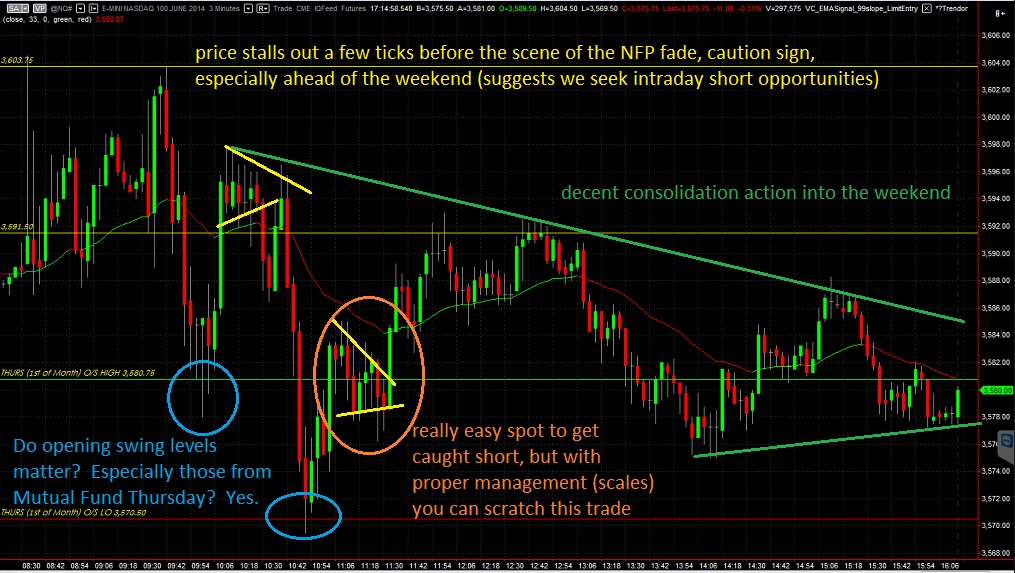
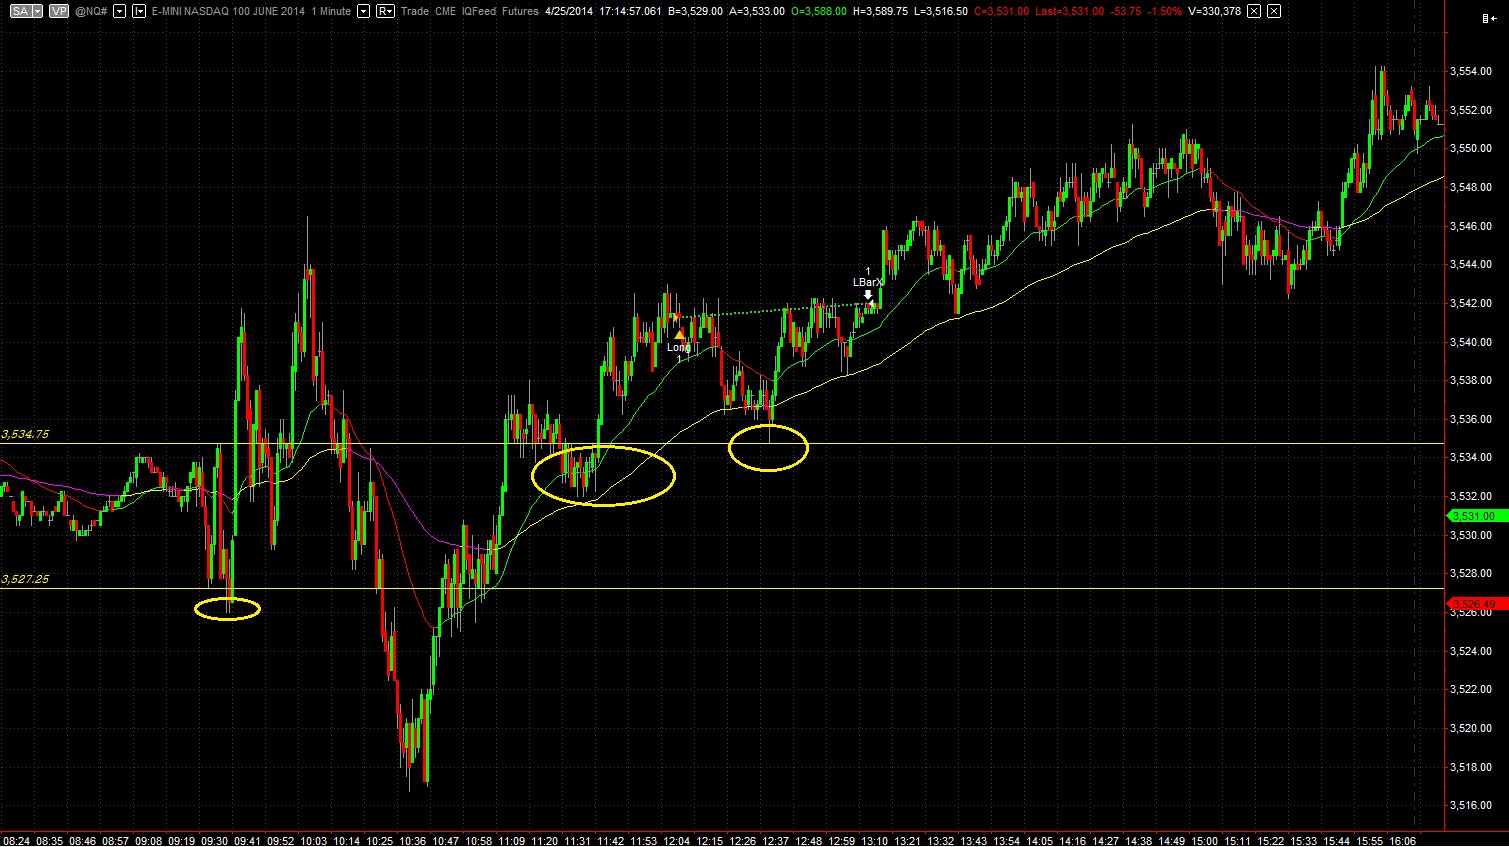
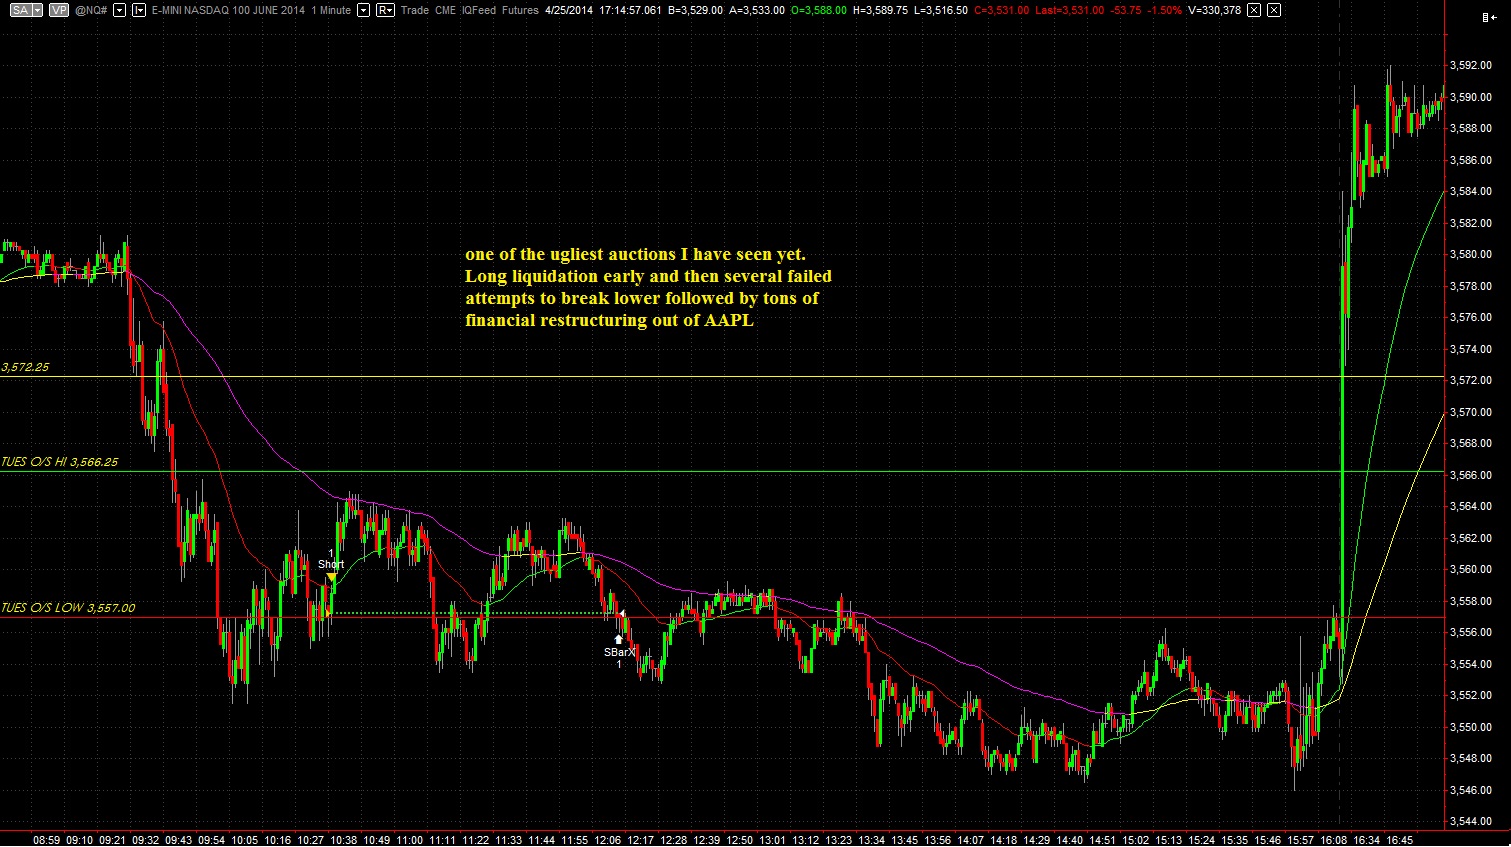
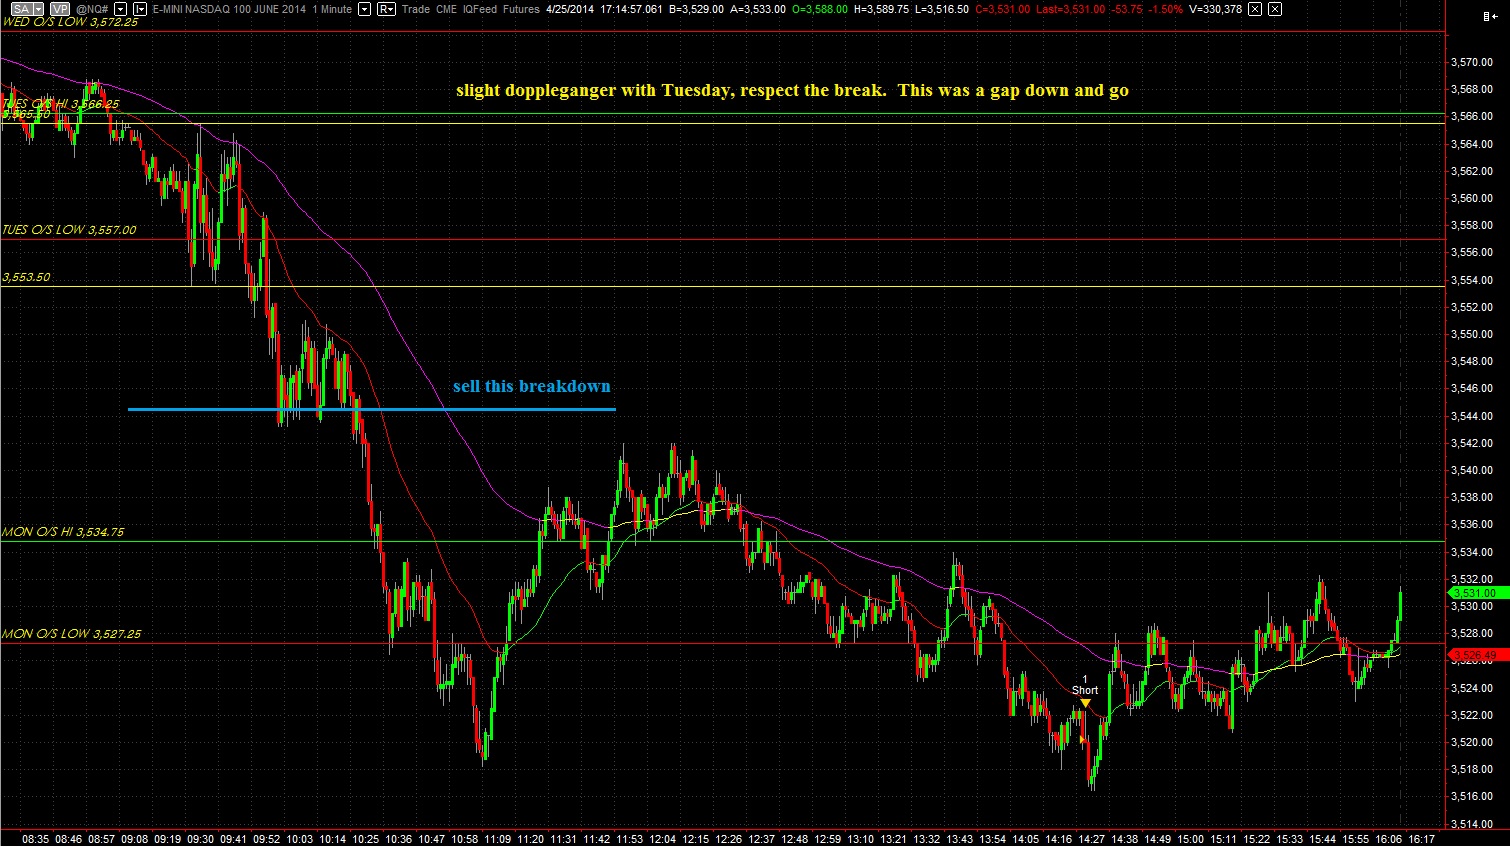
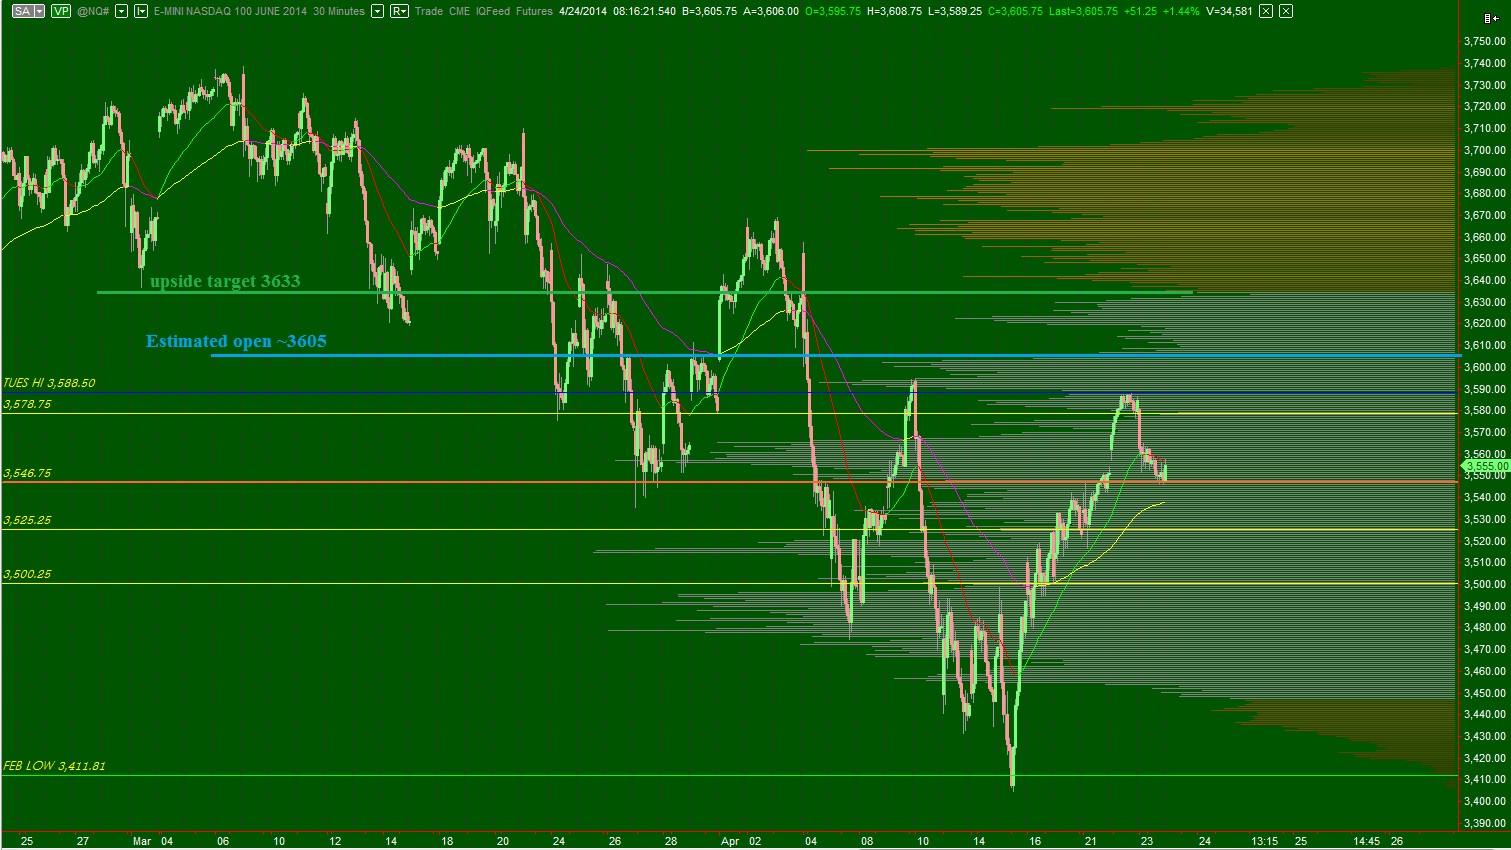
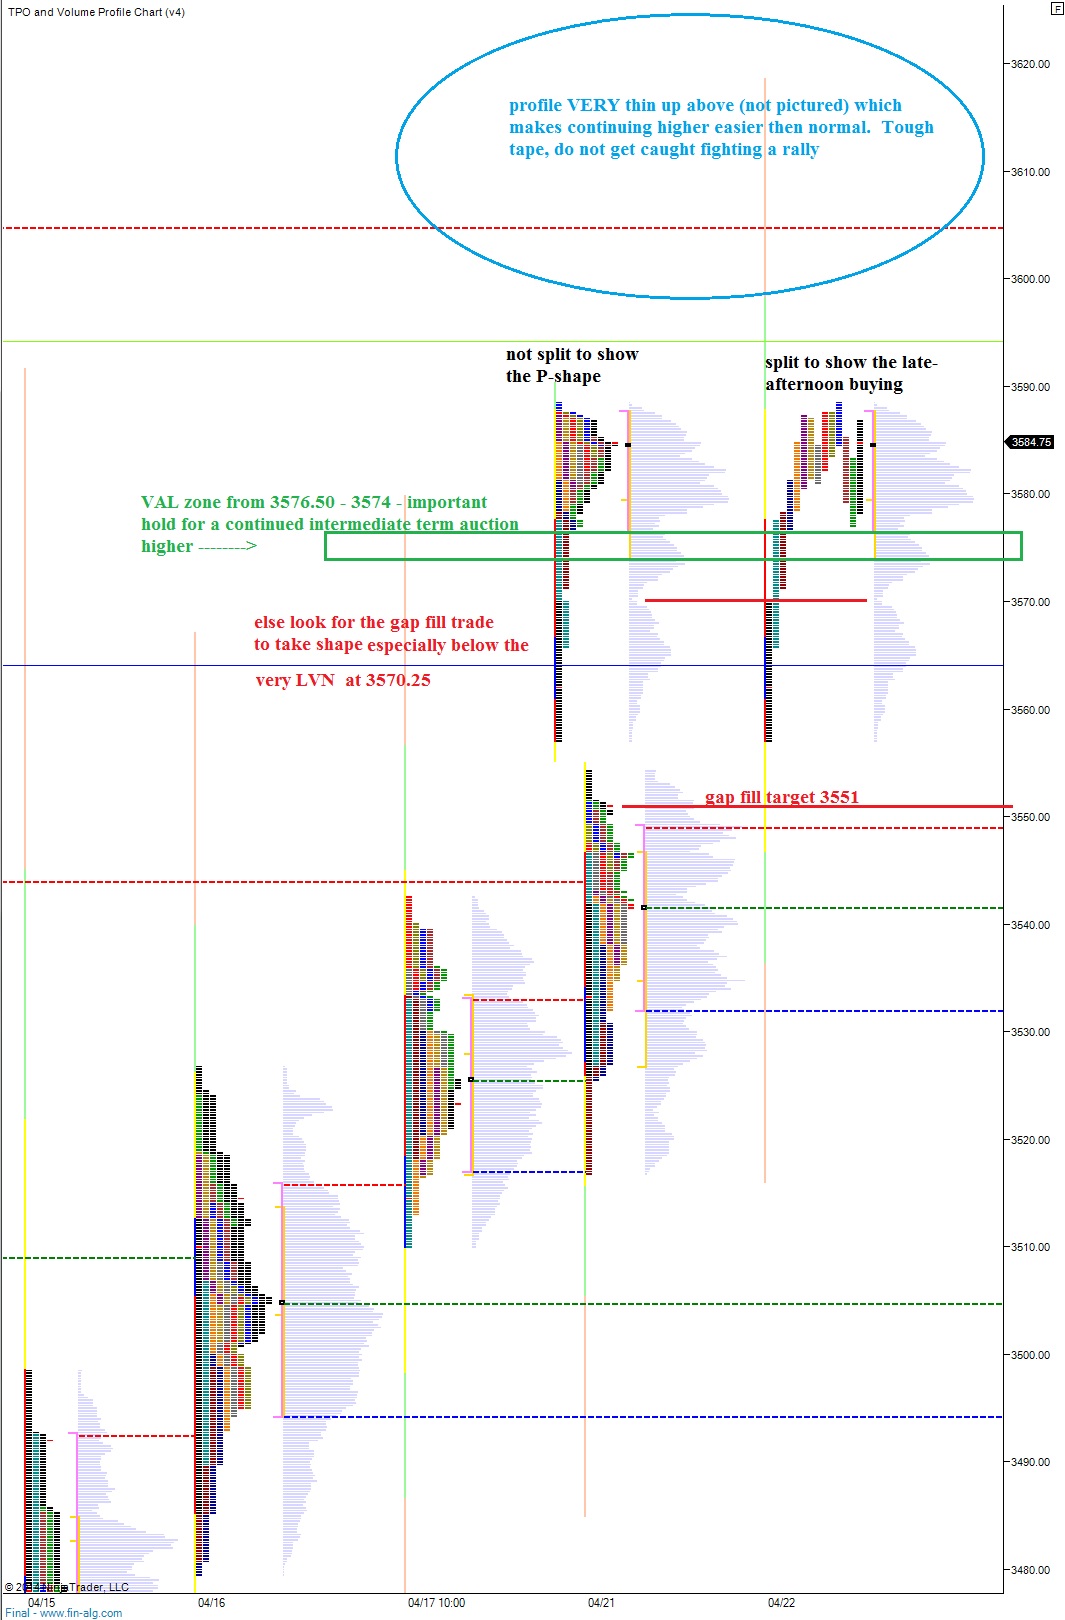
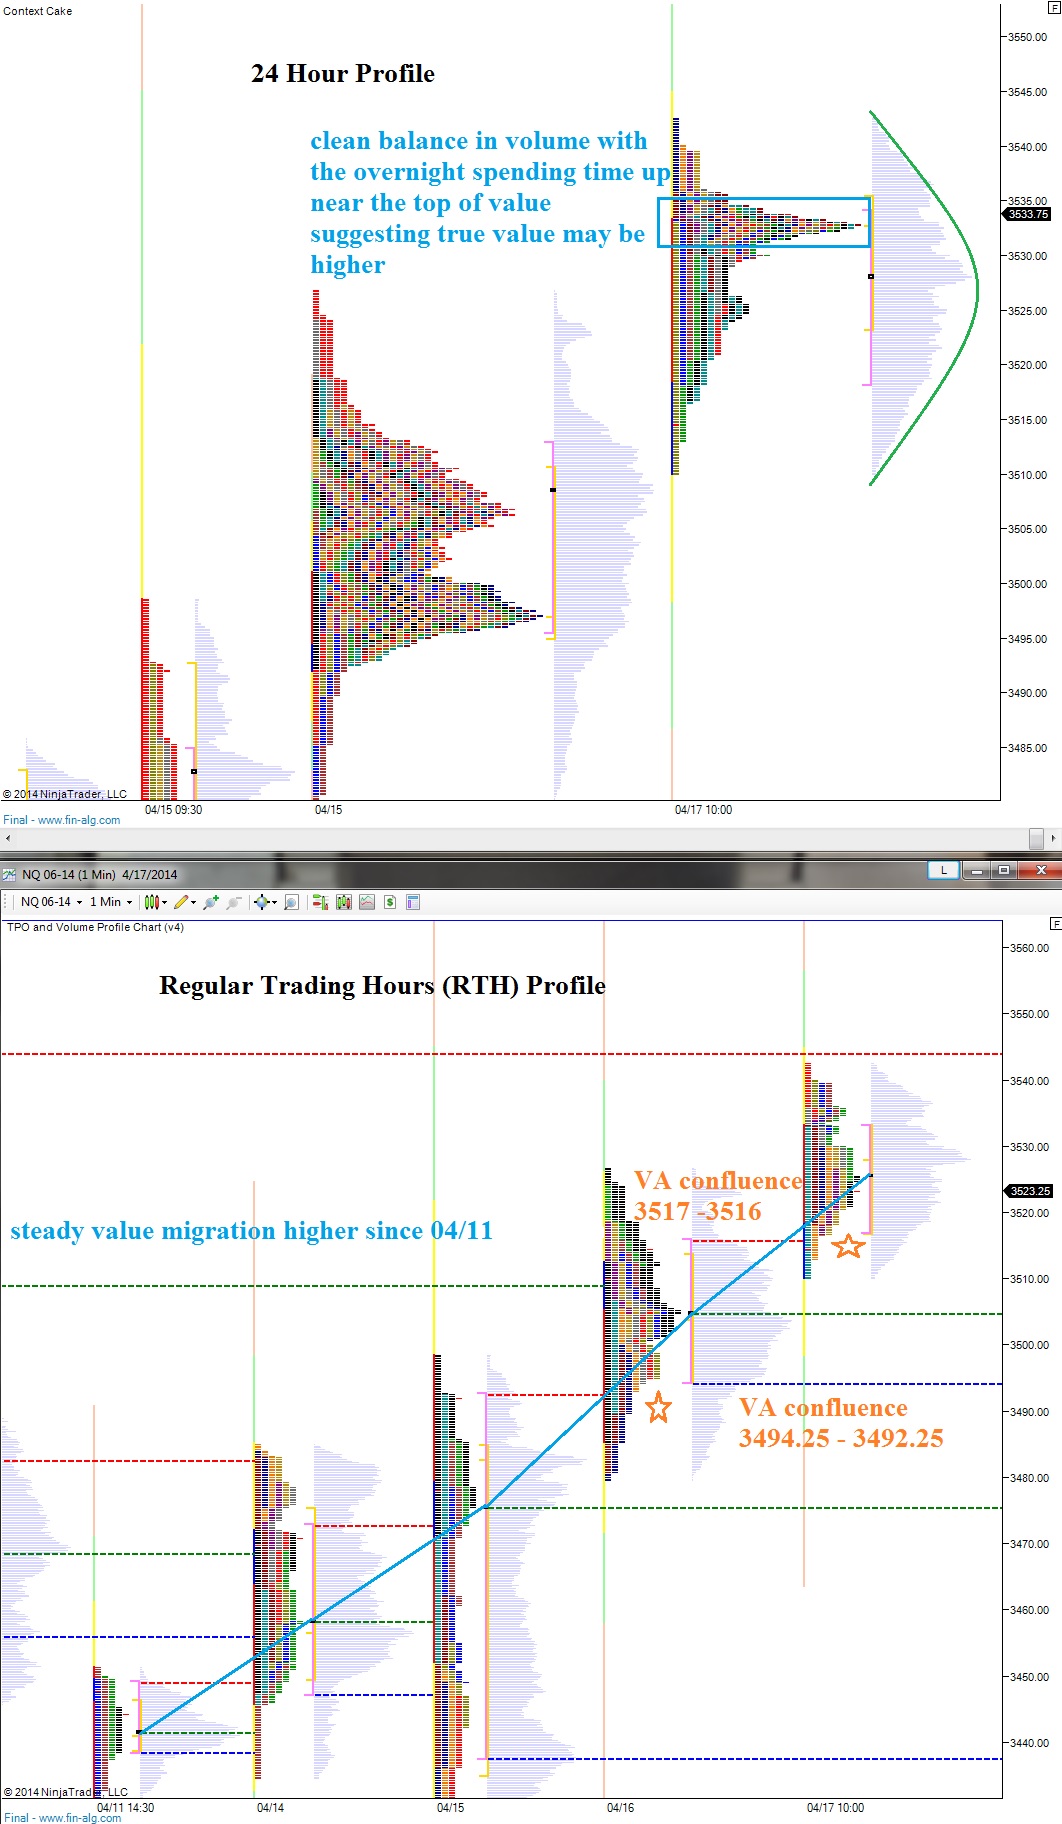
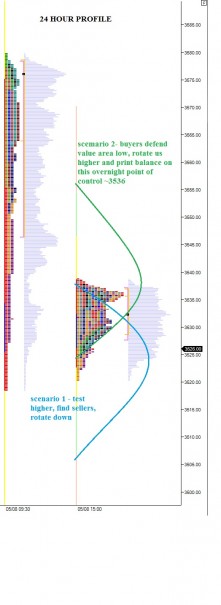
The short term timeframe is nuanced.  Buyers pressed value higher yesterday, but the afternoon fade had a sharp velocity and certainly punished almost any new long positions initiated intraday.  The buyers controlled yesterday on the net by range extending higher, printing a buying tail, and pressing value higher.  However much like a movie, we tend to remember the ending the most, which in the markets case was weak.

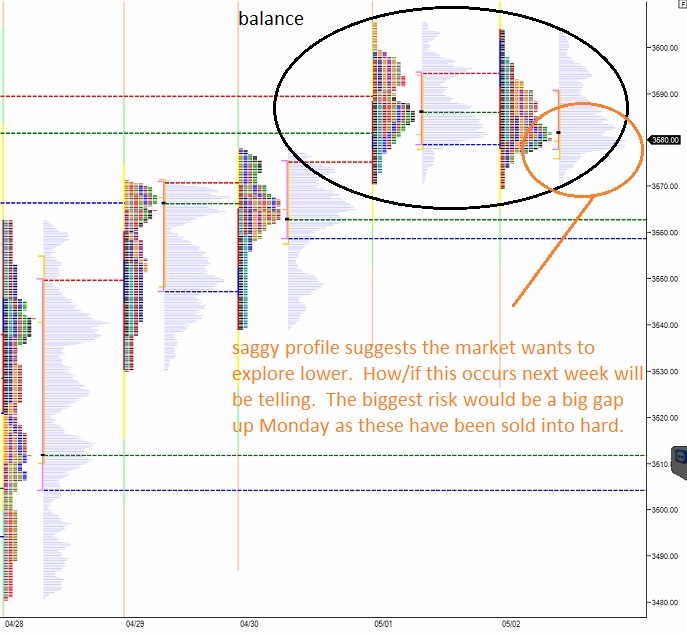
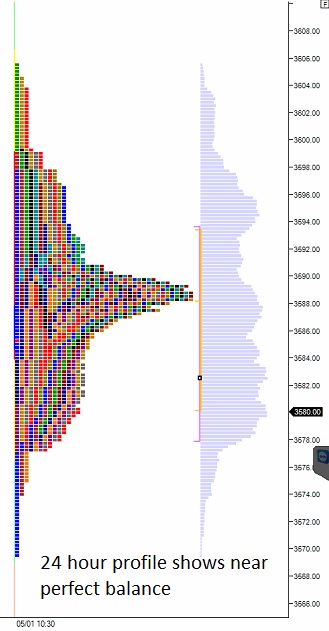
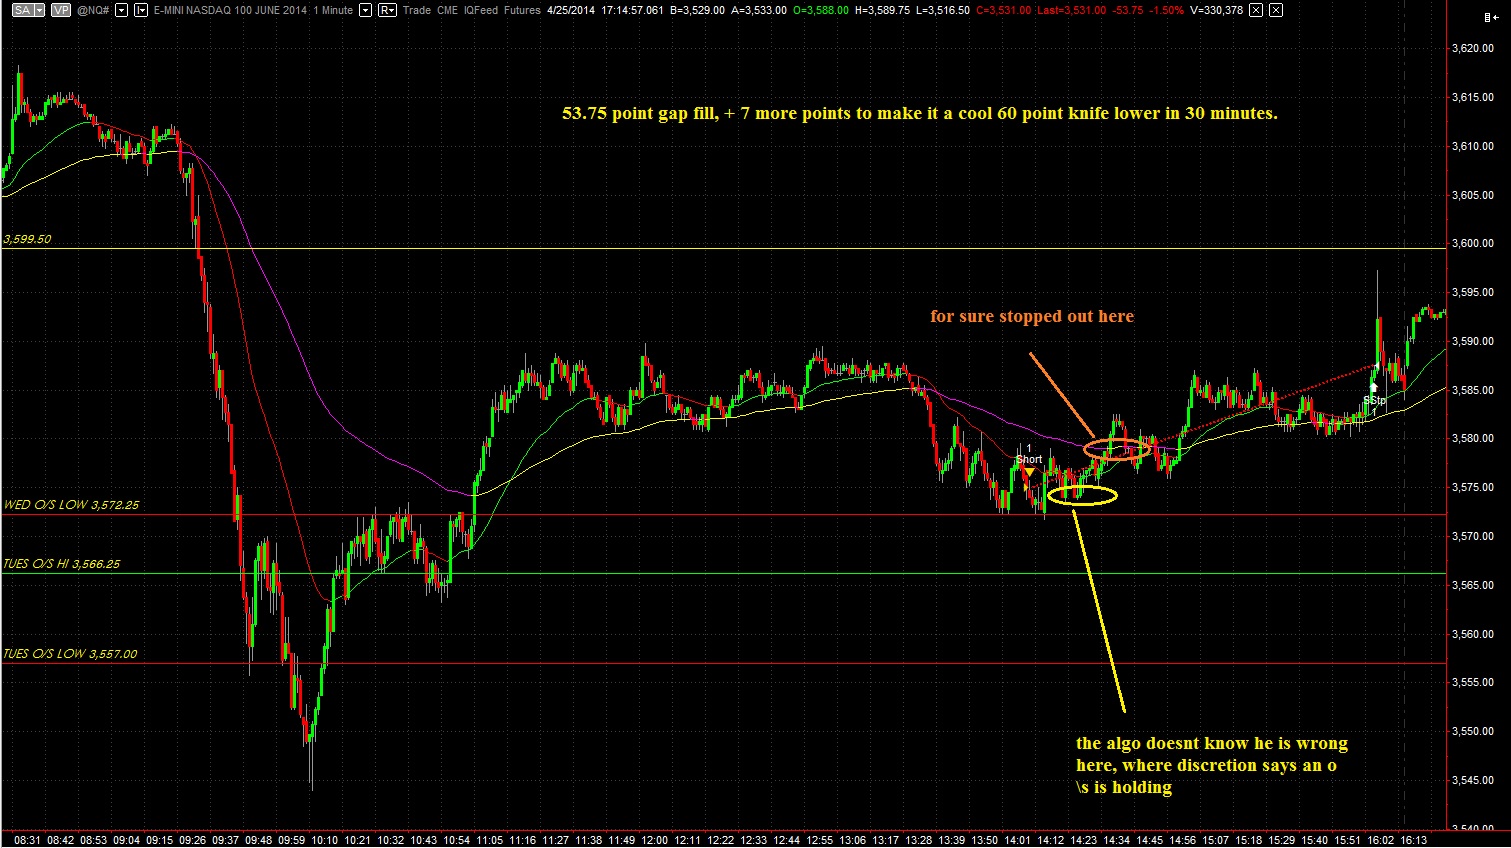
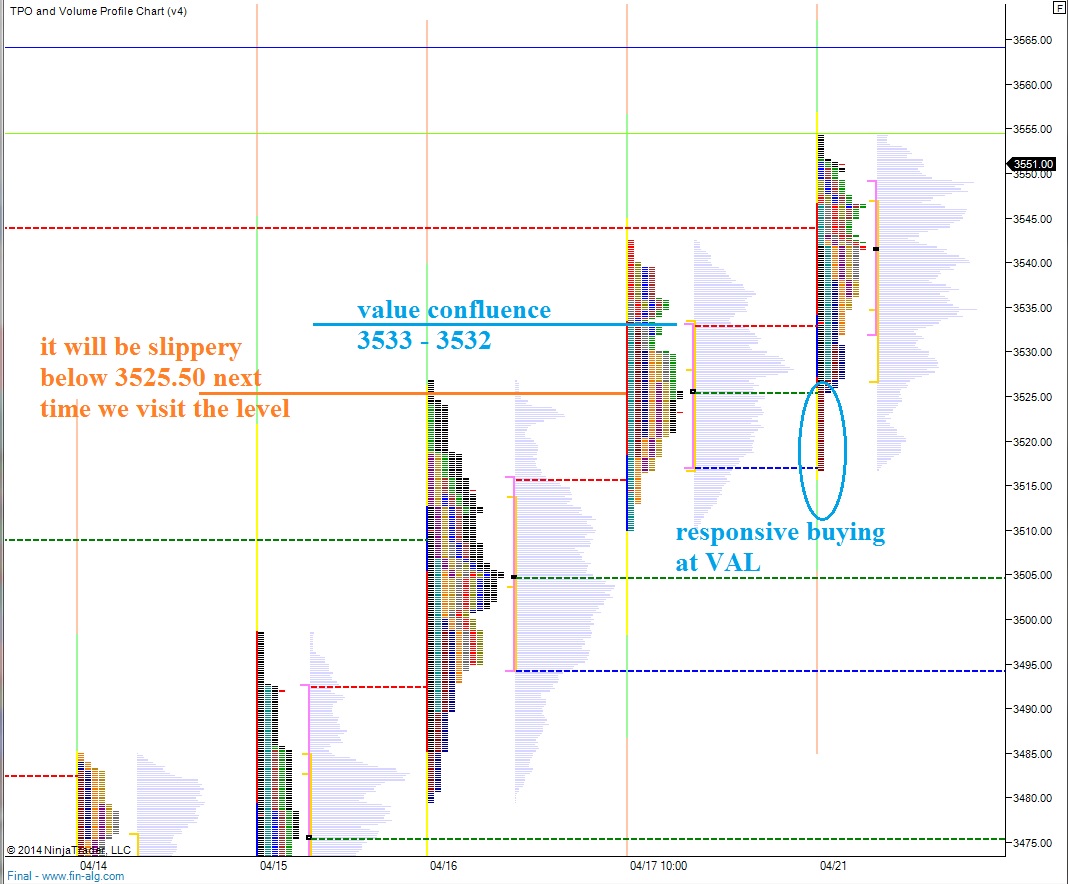
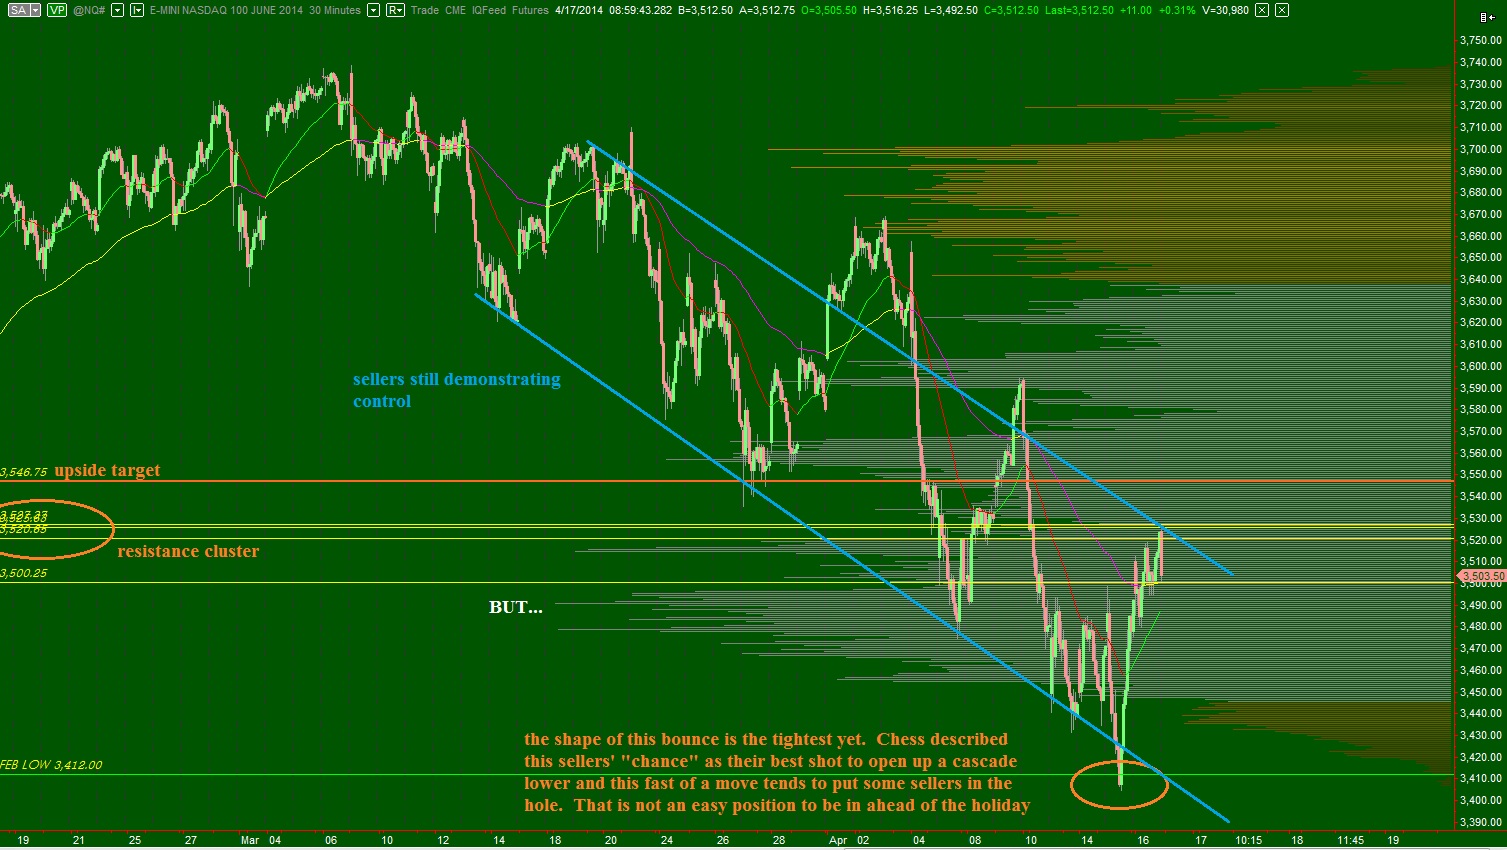
Since we have printed more than three TPOs (time price opportunities, the blocks that form market profile) inside of Wednesday’s range, my goal is to find a clean short entry intraday to ride a rotation through Wednesday’s value while targeting scales at the curious low volume node at 3520.50 and the value area low at 3507.50.  Since I know my targets, all I need to find is an entry intraday with risk less then ½ or 1/3 my desired profit.  This is risk management.  I have highlighted these observations and more on the following market profile charts:

NQ__MarketProfile_05092014


NQ__MarketProfile_05092014_24H

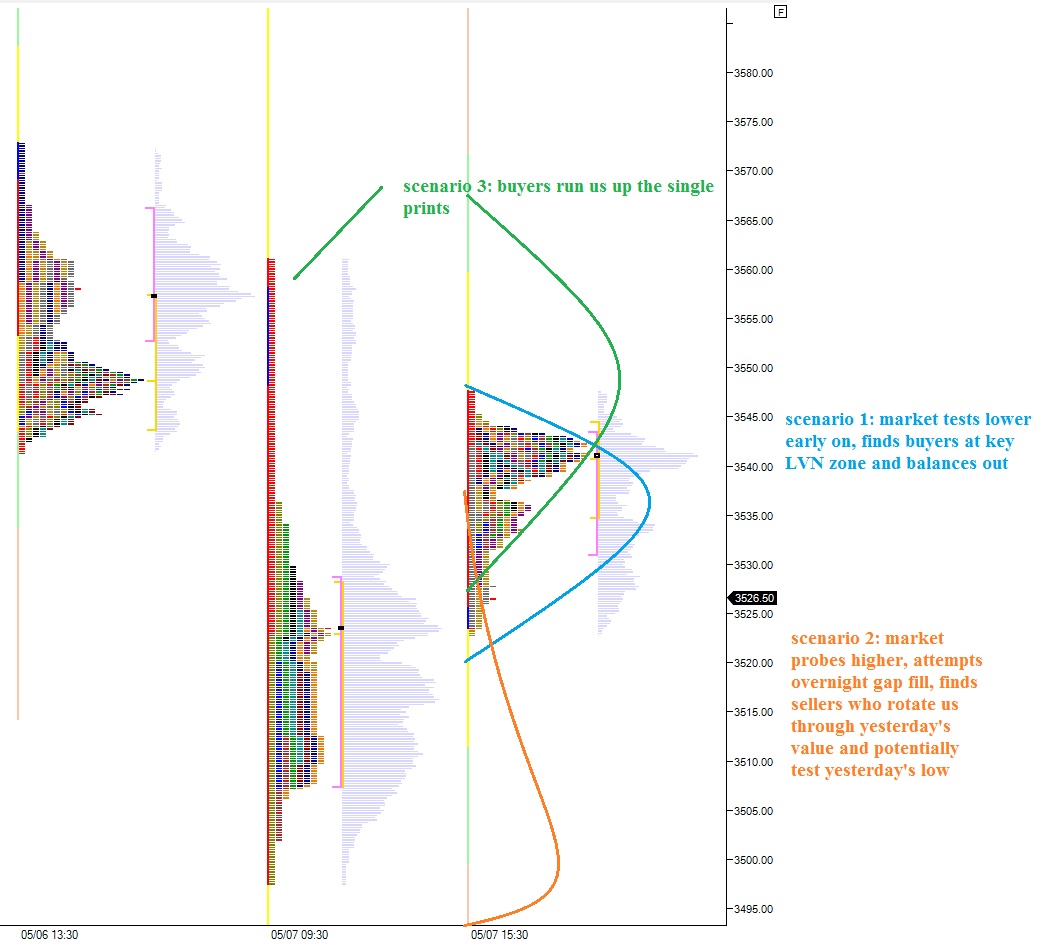
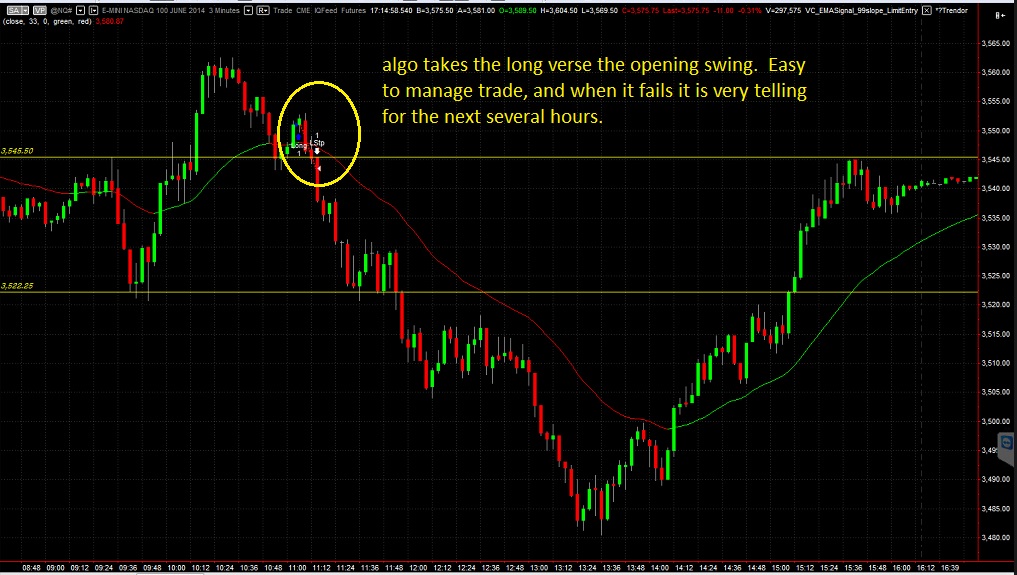
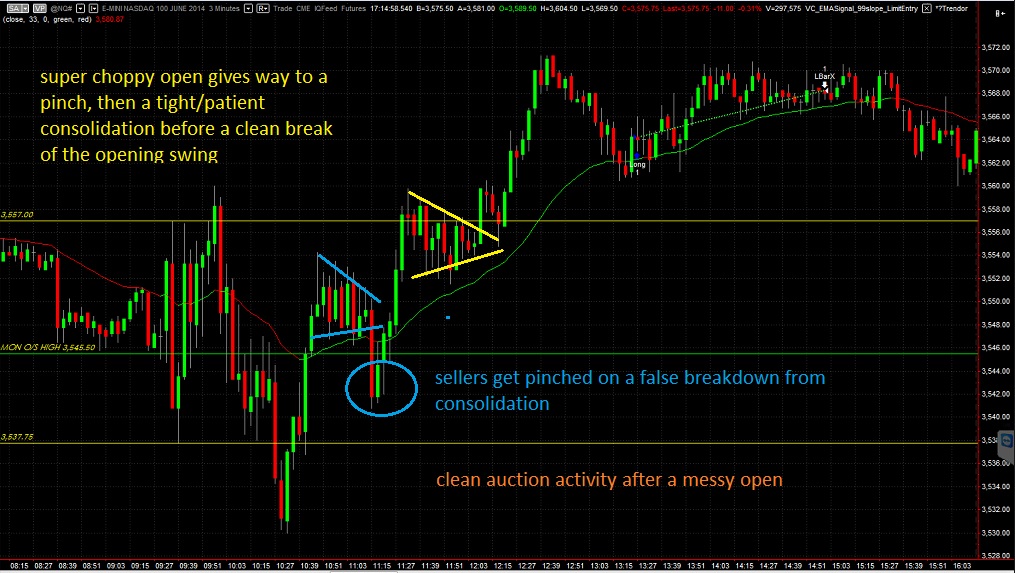
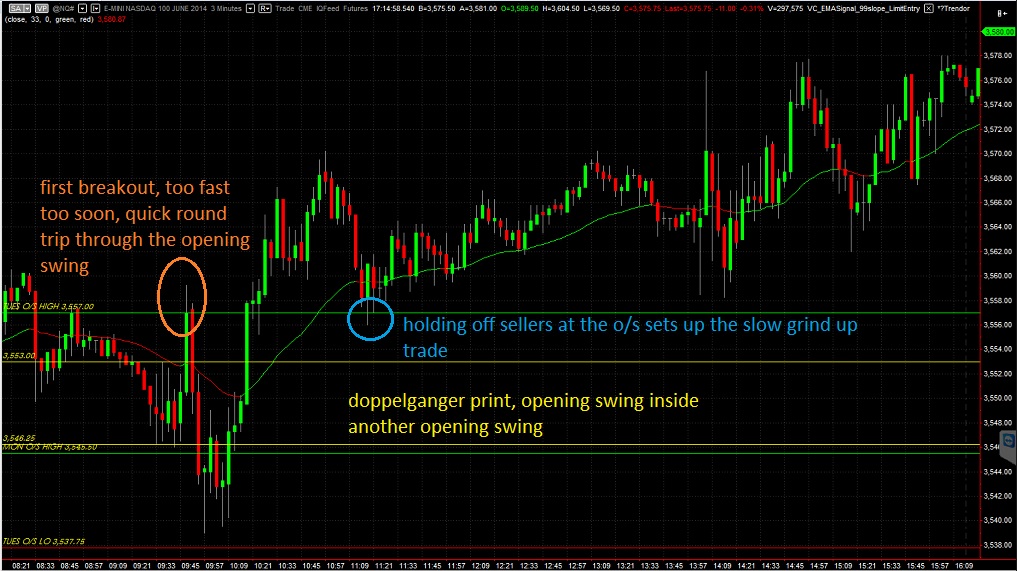
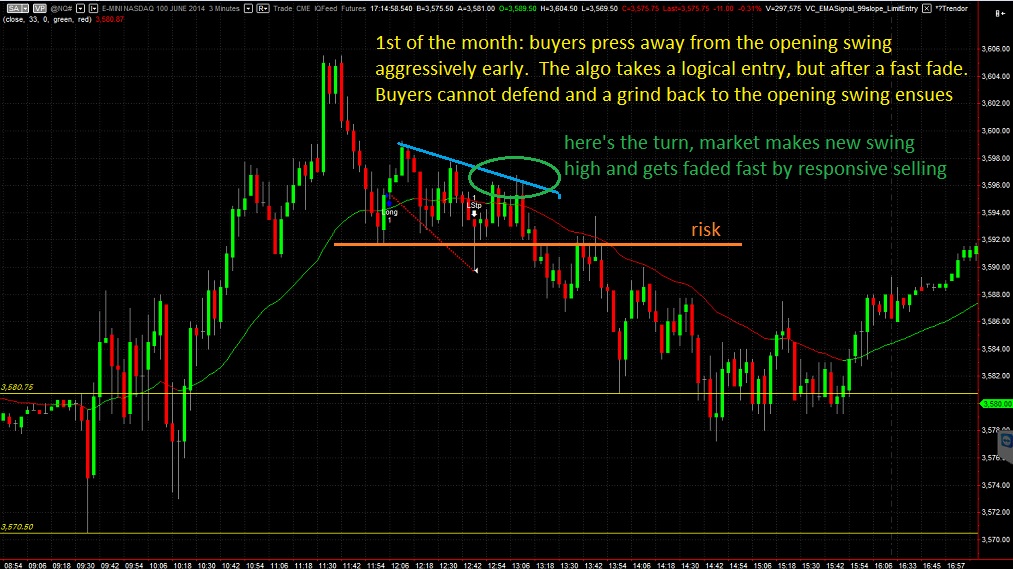
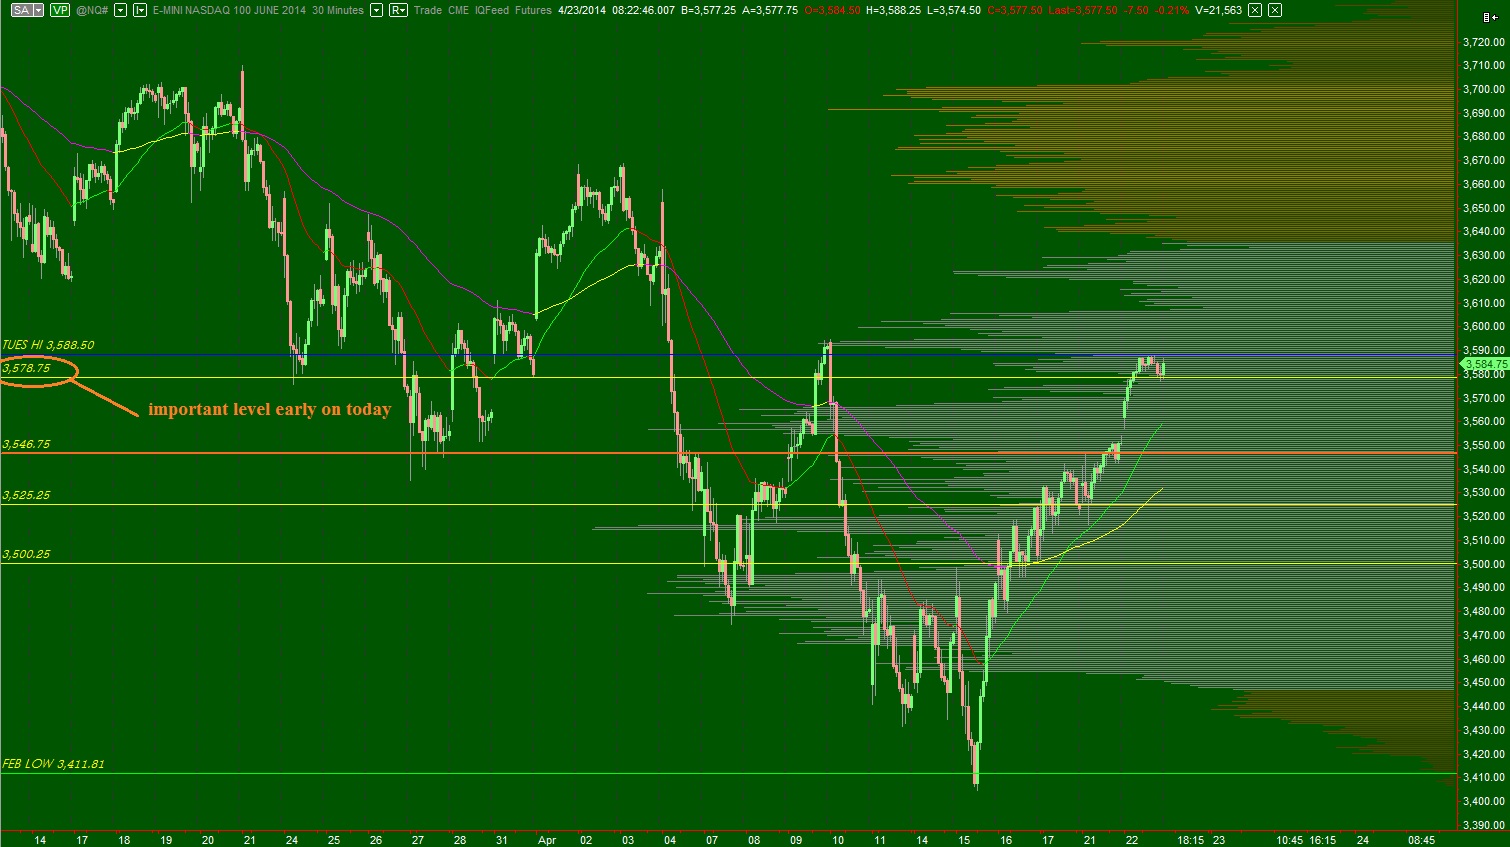
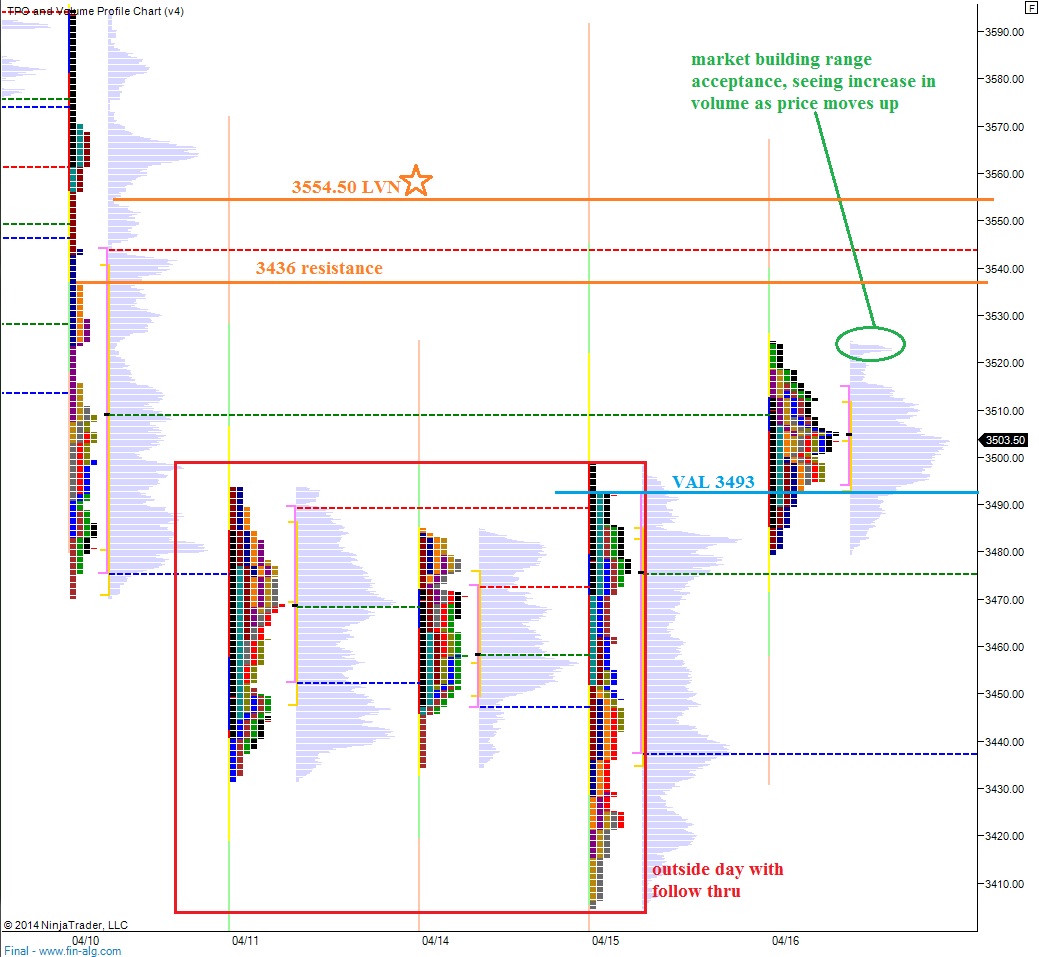
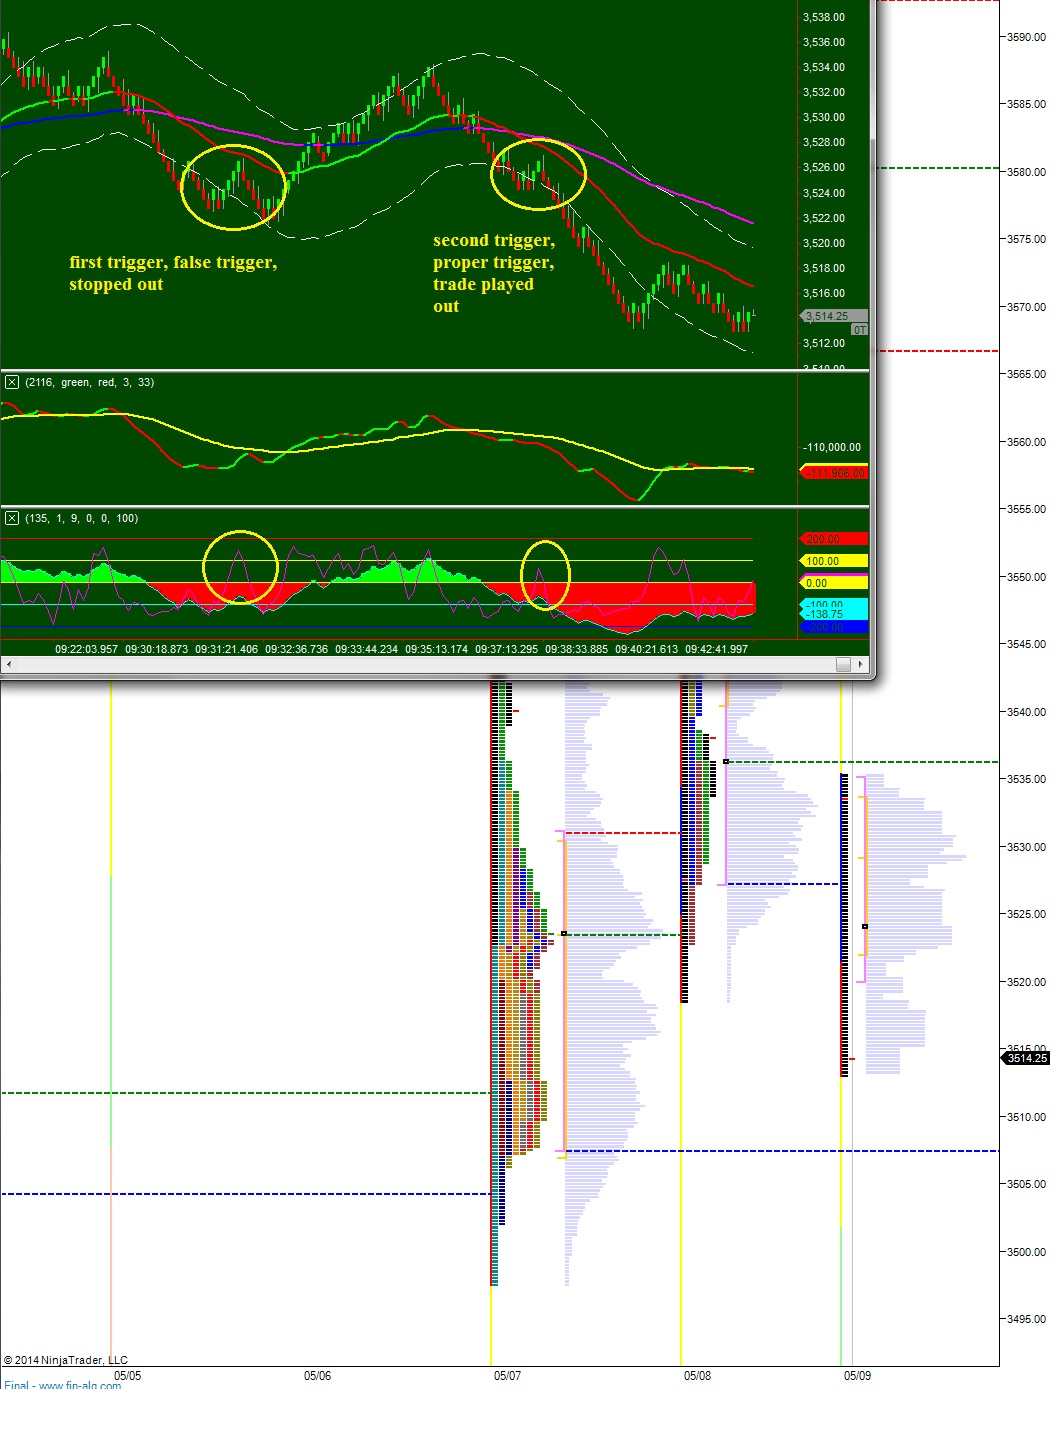
UPDATE: The trade played out mostly as anticipated, here’s the look:


NQ_shortTrade_05092014


Comments »

Sellers Better Bring The Speed

The market has been kind enough to reward even the most simple of short trades, like shorting Twitter into lockup expiration.  With this in mind, we should respect the head-and-shoulders pattern forming on the NASDAQ composite over the duration of 2014.  First thing first, sellers need to gain control of the intermediate term.  Right now we are in balance.  See below:

NQ_IntermediateTerm_05082014

Here is the same volume profile (15 sessions) without bars overlaid.  I have highlighted the key price levels inside our current balance:

NQ_IntermediateTerm_05082014_naked

The short term auction is seller controlled.  We can see value migrate down after 4-6 days of overlapping.  The sellers struck first.  Yesterday however suggests the action may have been temporary.  Early in the day the profile resembled a lowercase letter-b.  This is long liquidation.  However, the sellers did not demonstrate their usual follow through.  Instead responsive buyers came in and auctioned price up for the rest of the day.

Key today is whether buyers continue responding to these lower prices, or whether sellers begin initiating more selling into the weakness.  I have highlighted these observations, a few scenarios, and important levels on the following market profile charts:

NQ__MarketProfile_05082014


NQ__MarketProfile_05082014_envision


Comments »

Opening Swing: Wait for Your Wave

The opening swings this week were choppy and indecisive, but from them emerged several clean auctions.  As the week progressed more and more opening swings piled up before we ultimately came into balance ahead of the weekend.  Below you can see how the daily auctions played out relative to the opening swings and also an update to the intermediate term auction:

MONDAY:

04282014_OS

TUESDAY:

04292014_OS

WEDNESDAY:

04302014_OS

THURSDAY:

05012014_OS

FRIDAY:

05022014_OS

INTERMEDIATE TERM VIEW:

05022014_NQ_OpeningSwing

LAST WEEK’S AUCTIONS PER THE MARKET PROFILE:

05022014_NQ_WeekofProfile

24 HOUR PROFILE SINCE THE MONTH STARTED:

05022014_NQ_24hour

Comments »

Opening Swing: A Week of Rejected Prices

The sellers sat back and waited for higher prices this week. Once they had prices they deemed unfair to the upside, they came into the market in droves. Thursday and Friday successfully unwind steady bull progress. However, there is still potential for buyers to turn the market around according to my intermediate timeframe analysis. For now, here are the weekly opening swings and also a week of market profiles. Enjoy:

MONDAY:

04212014_os

TUESDAY:

04222014_os

WEDNESDAY:

04232014_os

THURSDAY:

04242014_os

FRIDAY:

04252014_os

THIS WEEK IN MARKET PROFILE:

NQ__MarketProfile_weekly


Comments »

Putin on The Risk

Nasdaq futures are lower overnight, currently trade is down nearly 20 handles off Thursday’s close.  Selling activity picked up early this morning around 6:30am.  We are currently trading right around yesterday’s value area low meaning we are set to open inside range, potentially inside balance which suggests the market is coming into balance.

The weekly candle will give us a ton of information this afternoon as we get to see whether price will struggle at the midpoint of my proposed bracket range or if we have enough power to continue higher and set the other extreme.

The intermediate term auction is buyer controlled and working on continuing higher after printing a higher low yesterday.  I have highlighted the intermediate term on the following volume profile composite:

NQ_IntermediateTerm_04252014

The short term auction is a rare spectacle of balance.  We printed a neutral print with price never exceeding the initial balance.  This happens less than 3% of the time over the last 3 years of data.  It shows indecision on the part of buyers and sellers.  We can see a volume skew to the upside plus a close near the value area high which suggested just a slight bit of buyer conviction.  However, the next accepted move away from here will be the important one.  For now, the short term is in balance:


NQ__MarketProfile_04252014

Comments »

Sure Is Quiet Around Here, Considering The Action

Nasdaq futures are quite a bit higher overnight, far outpacing the performance of all other major indices.  As of this writing, we are set to open about 50-to-60 points higher on the /NQ_F futures.  Pre market we had Durable Goods Orders and Jobless Claims which brought more buyers in, however most of the overnight strength is being attributed to earnings.

We are now above the midpoint of my proposed bracket range on the NASDAQ meaning the risk of being long is greater than being short.  At the same time, our intermediate auction continues higher.

These big overnight gaps can often create a frustrating day trade environment.  Risk is elevated because the market is clearly out of balance.  Often it is best to do very little, instead managing existing positions and carefully looking for rotation opportunities into stocks that have not run.

I highlight my primary upside target for the Nasdaq on the following intermediate term volume composite:

NQ_IntermediateTerm_04242014

I am using a 24-hour market profile this morning since we had so much overnight action.  I want to see the footprint this action left and look for high opportunity levels as well as envision how today’s profile may take shape.  I have highlighted these observations below:


NQ__MarketProfile_04242014

Comments »

Potential to Run Higher

Nasdaq futures traded mostly flat and balanced overnight until some early morning selling pushed us a touch lower.  As a result, the overnight profile shows two distinct volume distributions.  We have Flash PMI data at 9:45 and New Home Sales at 10:00 as well as some major Dow components reporting earnings before the bell.  Perhaps the most sensitive announcements pertaining to the Nasdaq come out after market close today, including earnings from Apple and Facebook.

What I attempt to do with a long term chart is speed read the context of the market long term and use the information for broad strokes of risk analysis.  Essentially, my vision is for the long term auction to come into balanced, bracketed trade.  This is something that has not really happened since mid 2012.  We are roughly above the middle or mean of this bracket, which makes risk of holding longs greater.  This still is occurring inside a very long term uptrend so I give the upside a slight benefit of the doubt:

COMPQ_04232014

On the intermediate term, my goal is to determine who is in control and when we may see a new intermediate term change.  Right now the buyers are in control of the intermediate term.  They are pressing prices higher since tax day.  We have come close to exceeding the prior swing high and the possibility exists that buyers can remain in control, further driving prices higher.  However, I took the stance yesterday that we may be nearing another inflection point and I made a few adjustments to my portfolio.  Yet buyers remain in control of the intermediate term swing, see below:

NQ_IntermediateTerm_04232014

We use the short term auctions to gauge the continuation of the auction, always looking for signs of aging like overlapping value or opposing wicks (responsive selling) or sloppy distributions of volume within the profiles.  Yesterday exhibited strong buyer control but also displayed a few interesting signs.  We formed a P-shaped profile which suggests a short squeeze erupted early on but new, initiative buyers were not strong enough to continue pressing the value higher.  In context, their passiveness in the afternoon makes sense; we made a ton of progress via a gap higher and a strong morning drive.  Buying at this point became difficult.  Yet, we did see some buyers dipping their toes in as another rotation did develop late in the day.  Overall, buyers still in control also by closing out the day near the highs.  This auction is likely to continue higher in the short term, especially if yesterday’s value area low holds as support.  Otherwise, the gap fill trade may kick in.  See below:

NQ__MarketProfile_04232014

Comments »

Earth Day Nasdaq Roundup

The Nasdaq composite is up slightly overnight on a balanced session of trade. One of the economic releases I will be watching today is the 10am Existing Home Sales and whether it stimulates trade in my shares of Zillow.  There are no other major economic reports out today, but we do have a slew of earnings on tap in the coming days which may materially affect the manner in which the NASDAQ trades.

The long term auction is in the process of balancing via a bracketed trade.  My goal in these conditions is to locate bracket extremes as well as the midpoint and base my risk around these parameters.  Currently I estimate we are below the midpoint but far enough away from bracket lows to justify reducing risk a bit.  As this balance progresses, the parameters will become more clear.  This process is more art than science.

The intermediate term swing trade is buyer controlled.  I decided to change my interpretation of the intermediate term timeframe recently.  The intermediate timeframe is not something I measure in time, but rather by the swing trade occurring.  Buyers control the current swing but are tasked with either printing a higher low, a higher high, or both.  Thus even through the control the current swing, their control is still in question.  See below:

NQ_IntermediateTerm_04222014

The short term auction is buyer controlled.  We are seeing their force abate slightly as value begins to overlap.  However buyer participants came into Monday seeking lower prices and when they saw a perceived discount they snapped it up.  Look at the strong responsive buying tail we printed yesterday as well as the follow though initiating buyers who closed us near the high of the session.  This is a solid example of a buyer controlled market profile:


NQ__MarketProfile_04222014


Comments »

Big Picture Balance

As we enter the thick of earning’s season, it becomes more important than ever to not lose sight of both the big picture and the intricate short term picture which develops before us.  Overnight we saw an upward move Sunday evening which gave way to balanced, two-way trade overnight and into the morning.  As the USA comes online, we are seeing sellers creep onto the tape.

The long term auction is very interesting this week as we can see a notable change taking place.  For quite some time, it appeared the long term auction was buyer controlled where it now appears balance has taken hold.  Research shows the markets spend more than half their time in balance thus one must expect such an environment to return often.  The question is whether buyers can build upon last week’s responsive buying.  To me, it is not so important that these recent lows hold, but instead that we see equal force being applied on the market by both buyers and sellers.  Here’s the current long term auction:

COMPQ_04212014

On the intermediate timeframe, we can see volume totally dried up when we made new annual lows last week.  Speculators often look for explosive, high volume type action to confirm a swing high or low when really the exact opposite occurs at these levels.  What happens movement in the direction of the trend stops bringing new participation in.  In this case, sellers were not motivated to act by the new lows.  Instead we saw a buy response which was equally as strong as the selling move down.  Thus began an intermediate term swing higher:

NQ_IntermediateTerm_04212014

I am using my EMAs as well as the very low volume node just a tick above the very round 3500 price level as my intermediate term pivot this week.

The short term shows buyer control.  Value is migrating higher without much overlap and the profiles are showing healthy auction activity on both sides.  Whether this clean auction continues through an important week of earnings will be telling for the weeks to come.  See below:

NQ__MarketProfile_04212014

Comments »

Peering Through The Looking Glass

Nasdaq futures were set to drift lower overnight after some mixed afterhours trade in Google and IBM added a layer of uncertainty into the trading environment.  Drift lower they did until about 7am when a low volume ramp higher occurred.  Since then we had jobless claims which was received initially with a push higher.  We are currently trading inside balance and inside range from yesterday which suggests a lower risk/reward environment.

The intermediate term auction is interesting.  Sellers came in where I expected yesterday, which was a patch of low volume nodes on the composite profile.  Their response was perhaps exaggerated a bit by the afterhours earnings which kicked off the selling.  Sellers still retain control on the intermediate term, but the most recent swing bounce has been the sharpest yet which leads me to wonder if the velocity will be enough to get us higher.  Above yesterday’s high we begin to enter a zone of fast trade.  First let’s observe the intermediate term trend:

NQ_VolumeProfile_intermediateTerm_04172014

Now we can increase the magnification and observe the short term auctions.  Tax day, 04/15, we printed an outside day where price exceeded both the high and low of the prior day.  In this case, it was actually the prior two days.  Yesterday confirmed the outside day by migrating value higher.  These two bits of context tell me buyers control the short term auction.  Volumes are lower given the holiday climate, but you can still see a clear distribution formed yesterday.  One subtle footprint however is a spike of volume near the highs.  Normally we would expect to see volume thin out at the extremes—if we are in balance.  This suggests increasing prices facilitated more trade and that an imbalance may exists.  I have highlighted this occurrence a few other observations on the following market profile chart:

NQ__MarketProfile_04172014


Comments »