iBankCoin
Home / Market Profile (page 160)

Market Profile

Big Moves Overnight

Large waters overnight in the S&P 500, where the globex session printed a 14 handle range.  Wednesday’s late afternoon selloff continued into the evening before stabilizing around 9pm at 1631.50, which is right at the lows of 07/08, the Monday after Independence Day.  As of this writing, the market stalled out 1645.25 which marks yesterday’s volume point of control (VPOC) and also the tip of the lower breast we observed yesterday afternoon.

The upward rotation overnight picked up steam around the European open, and put the squeeze on from 1637.75 – 1643.75.  What I mean to say is the market made no pause or rotation lower throughout the entire move upward, giving overnight shorts little room to cover.

Since then the market has stalled a bit, but is aligned in such a manner that welcomes bulls back into the tape.  Whether or not they will oblige early on is debatable.

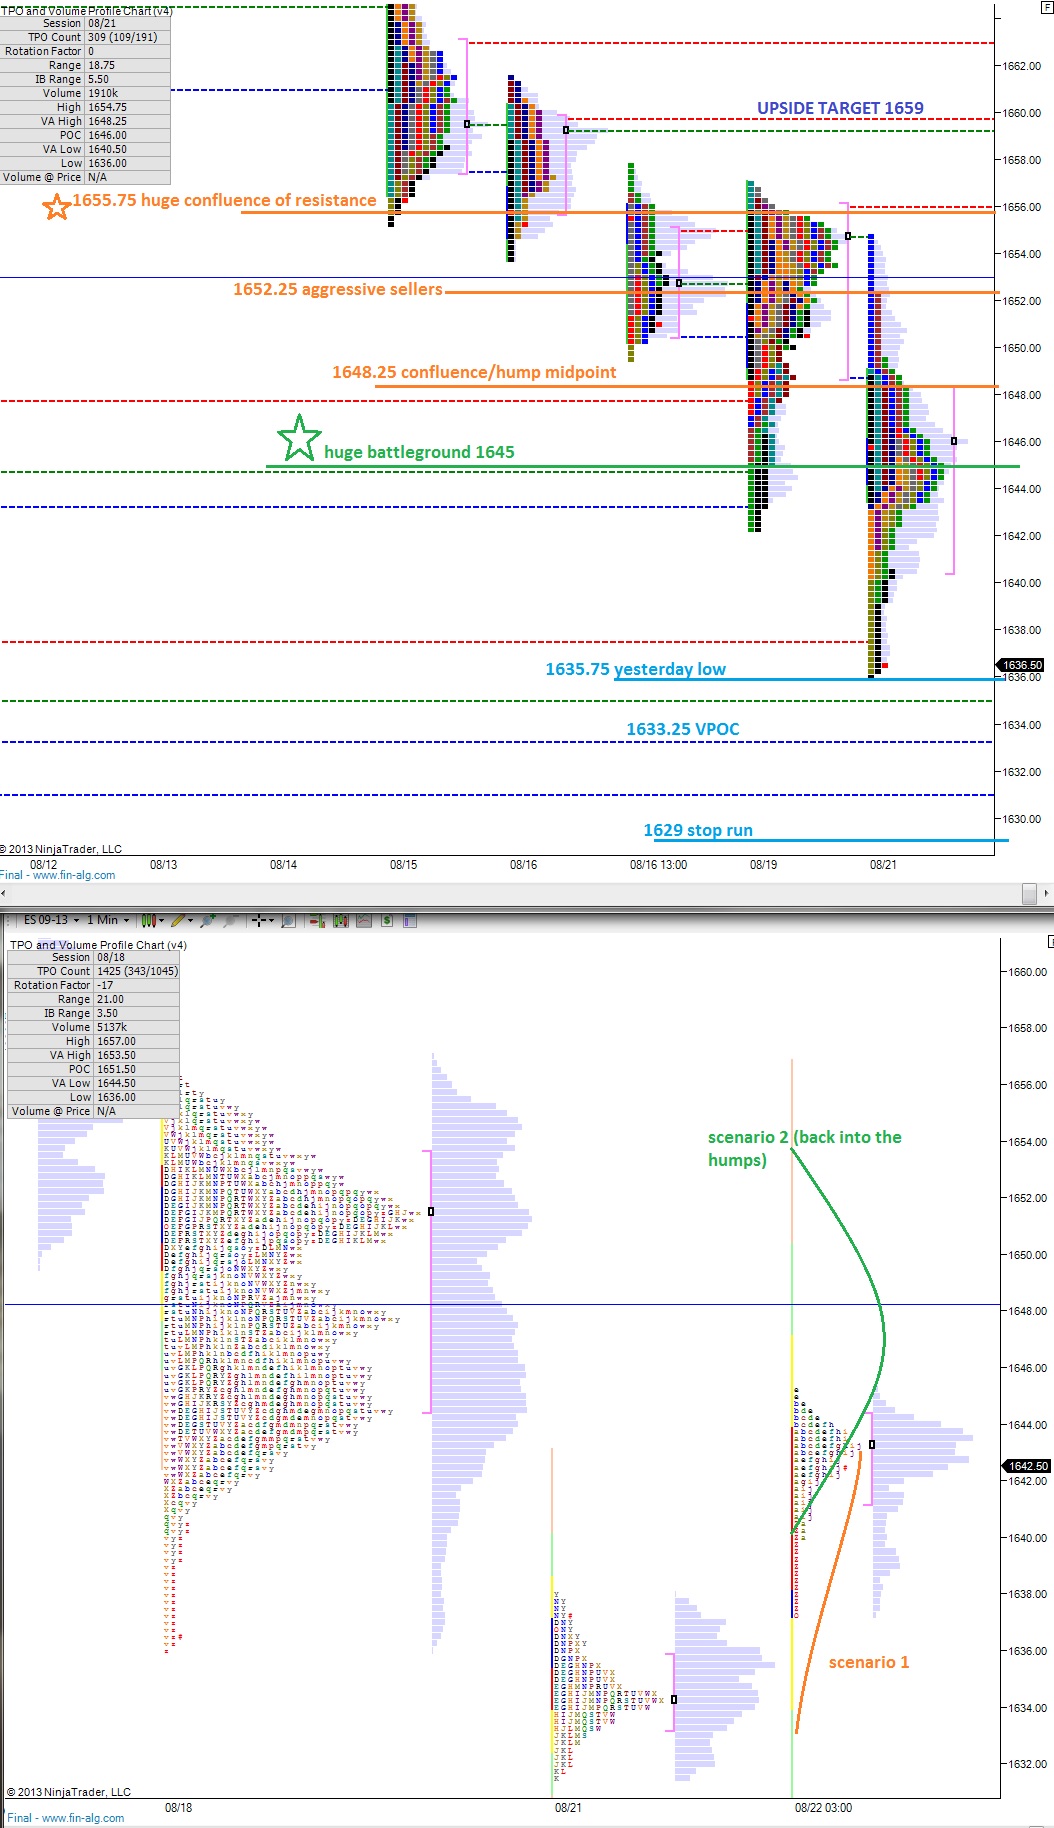
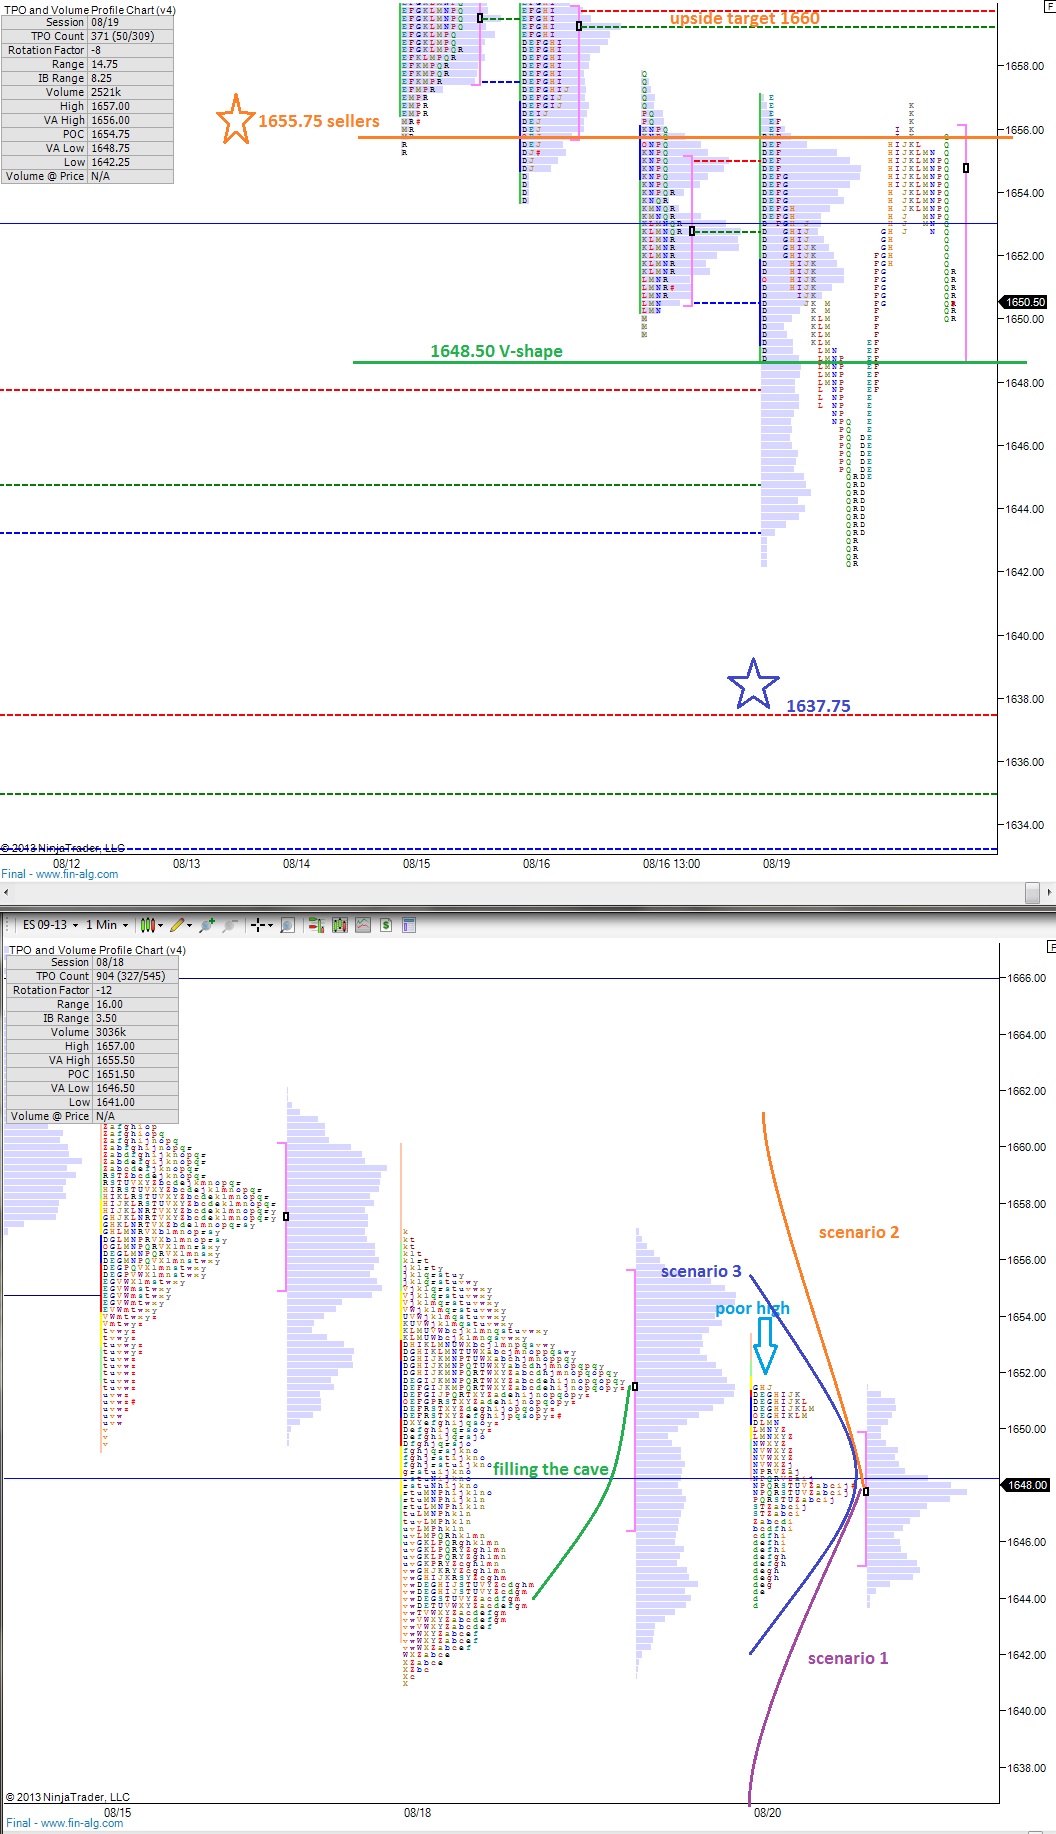
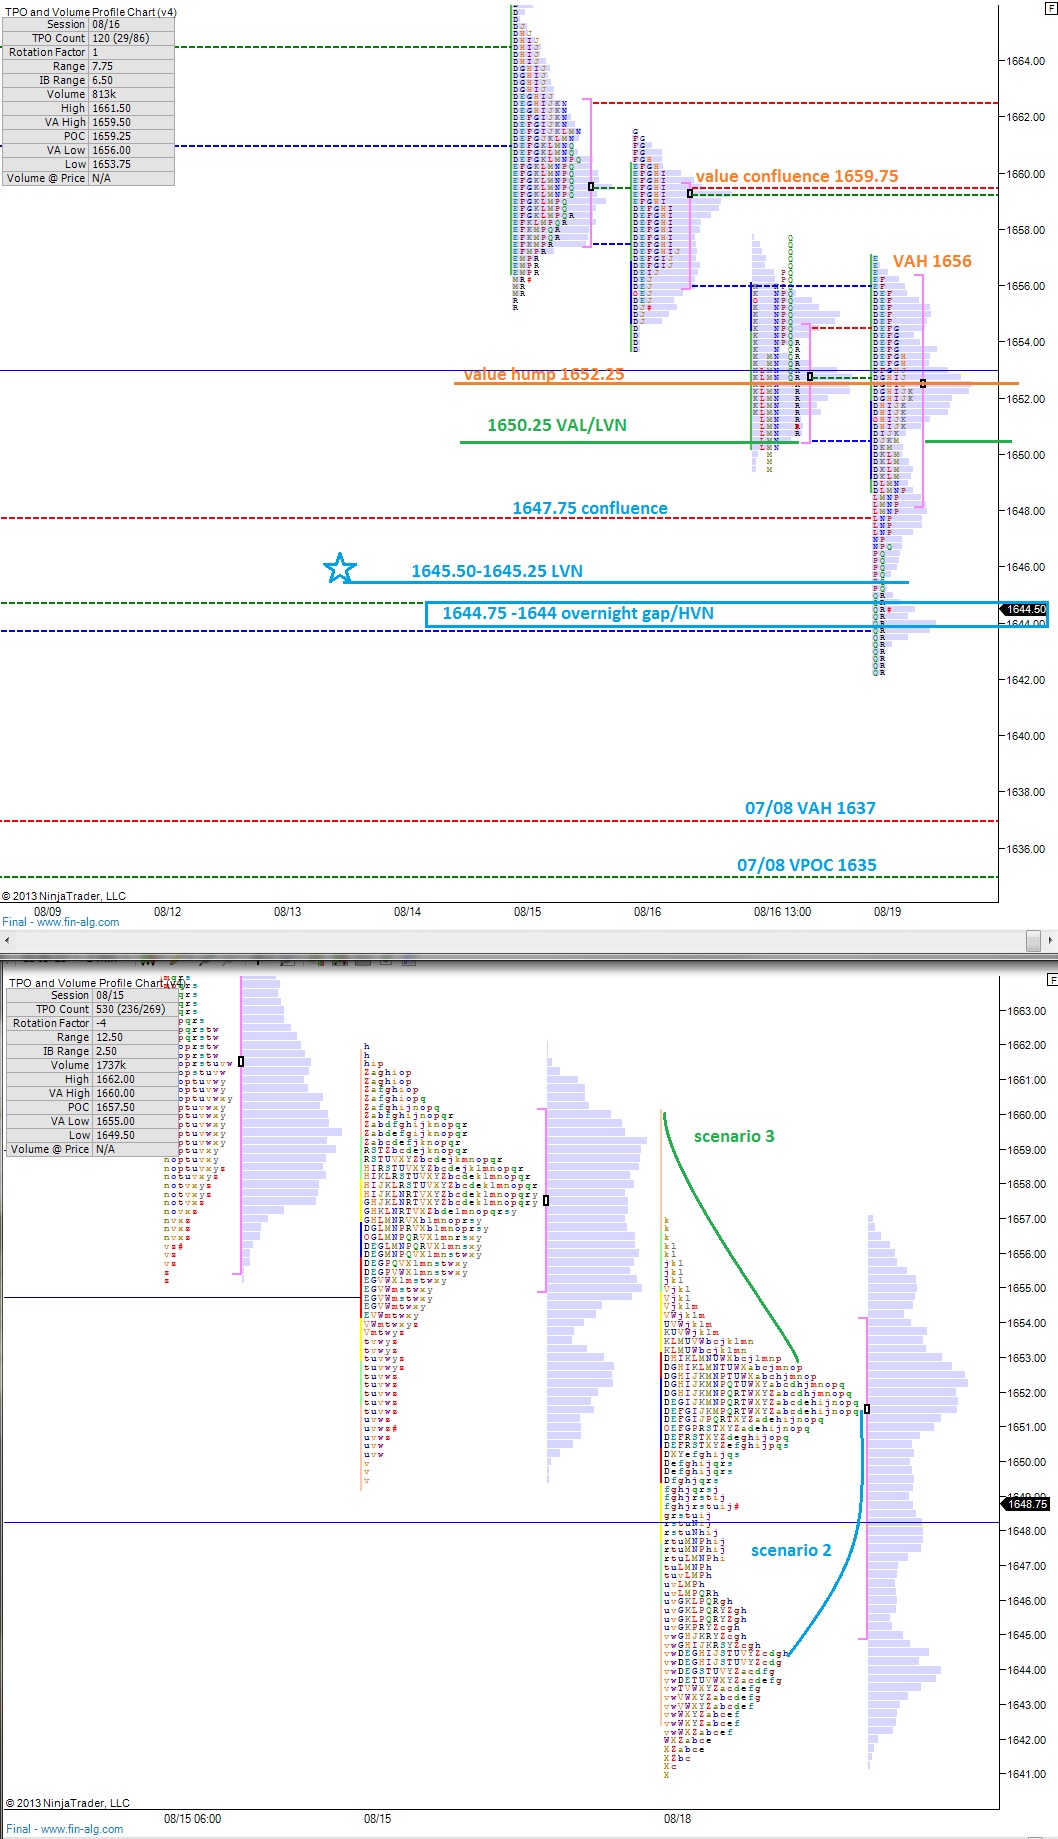
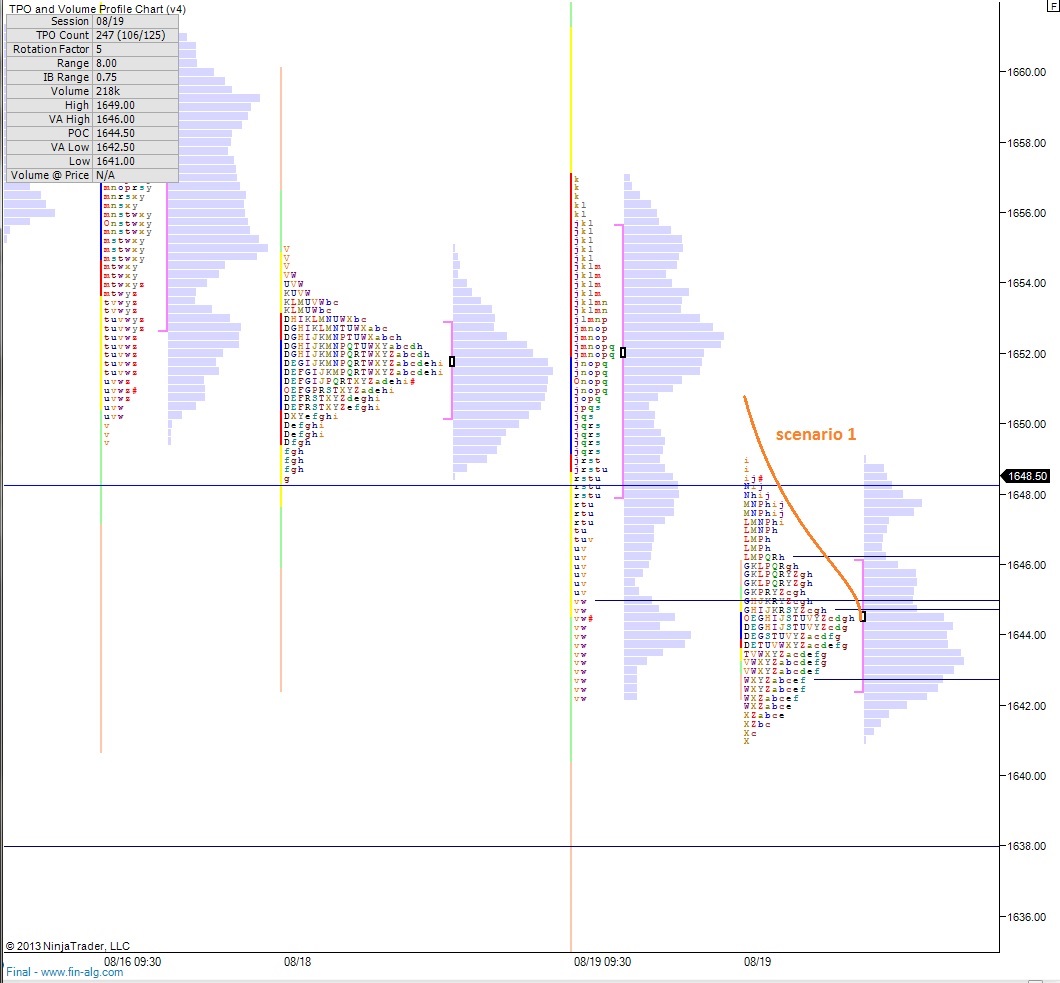
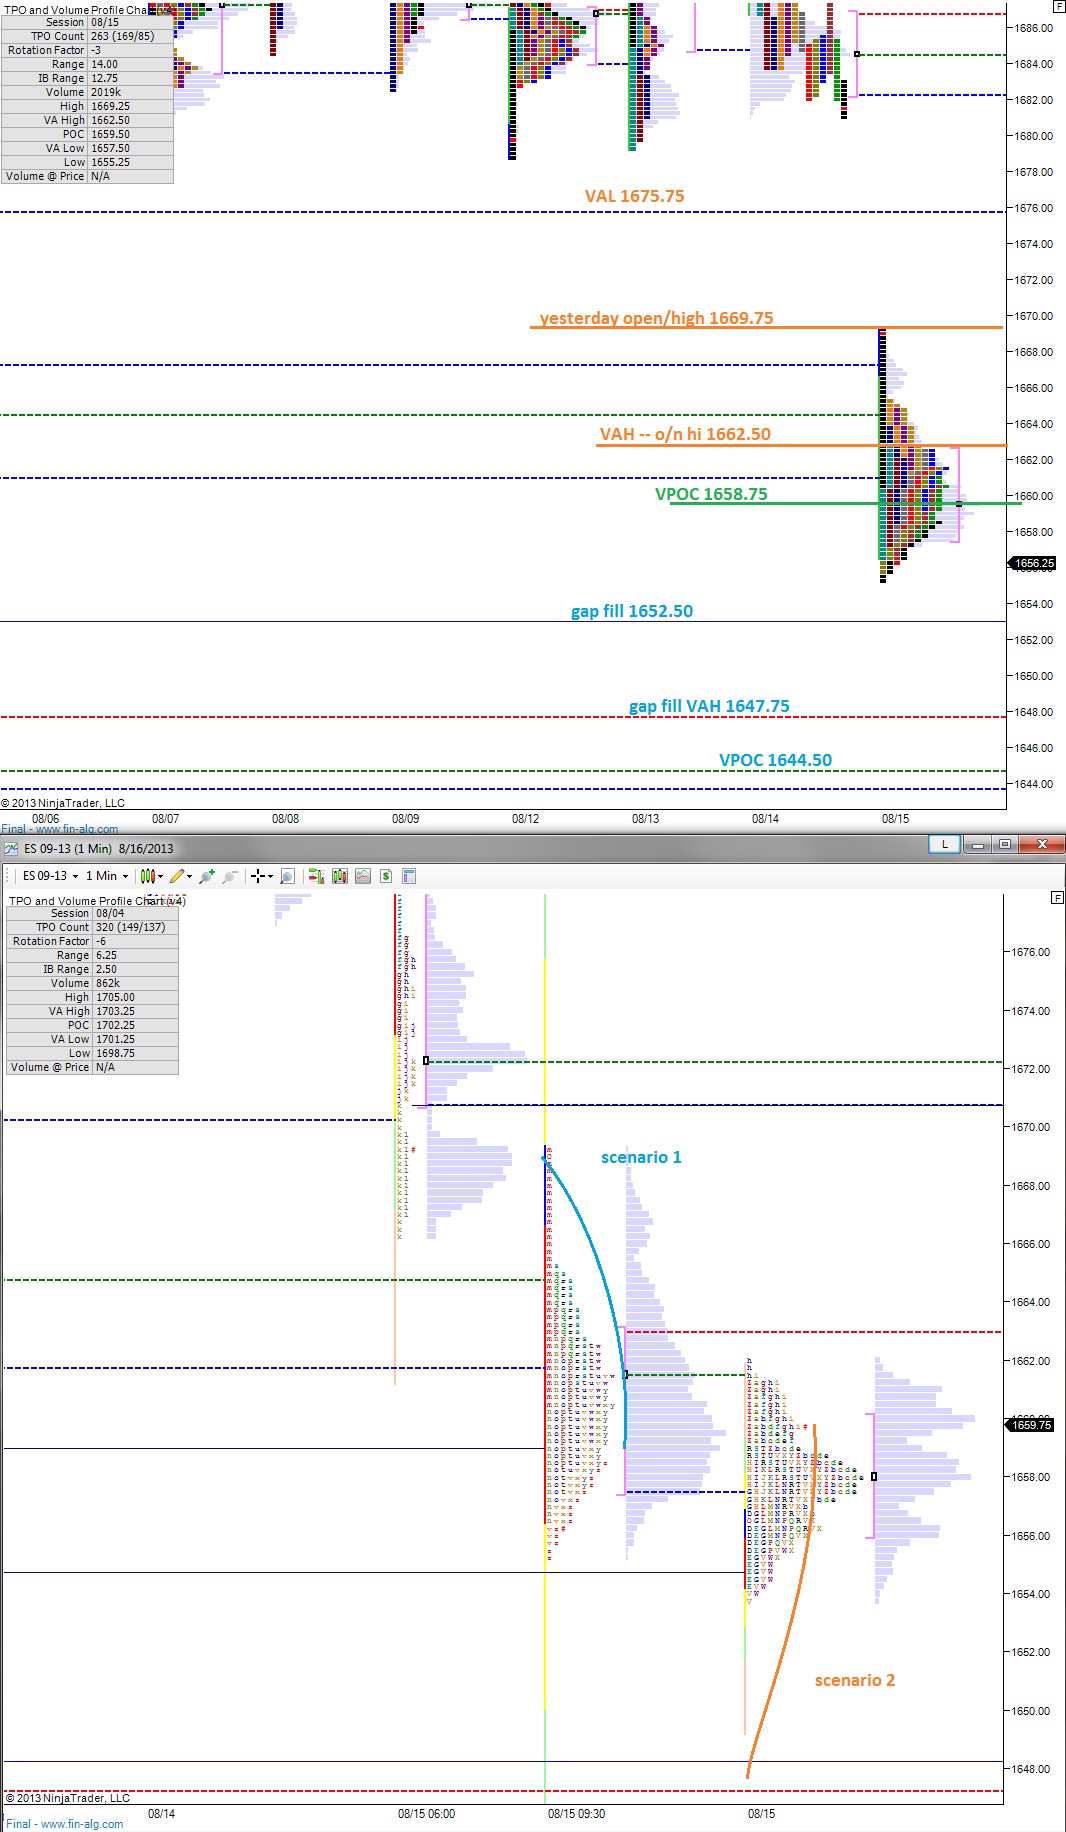
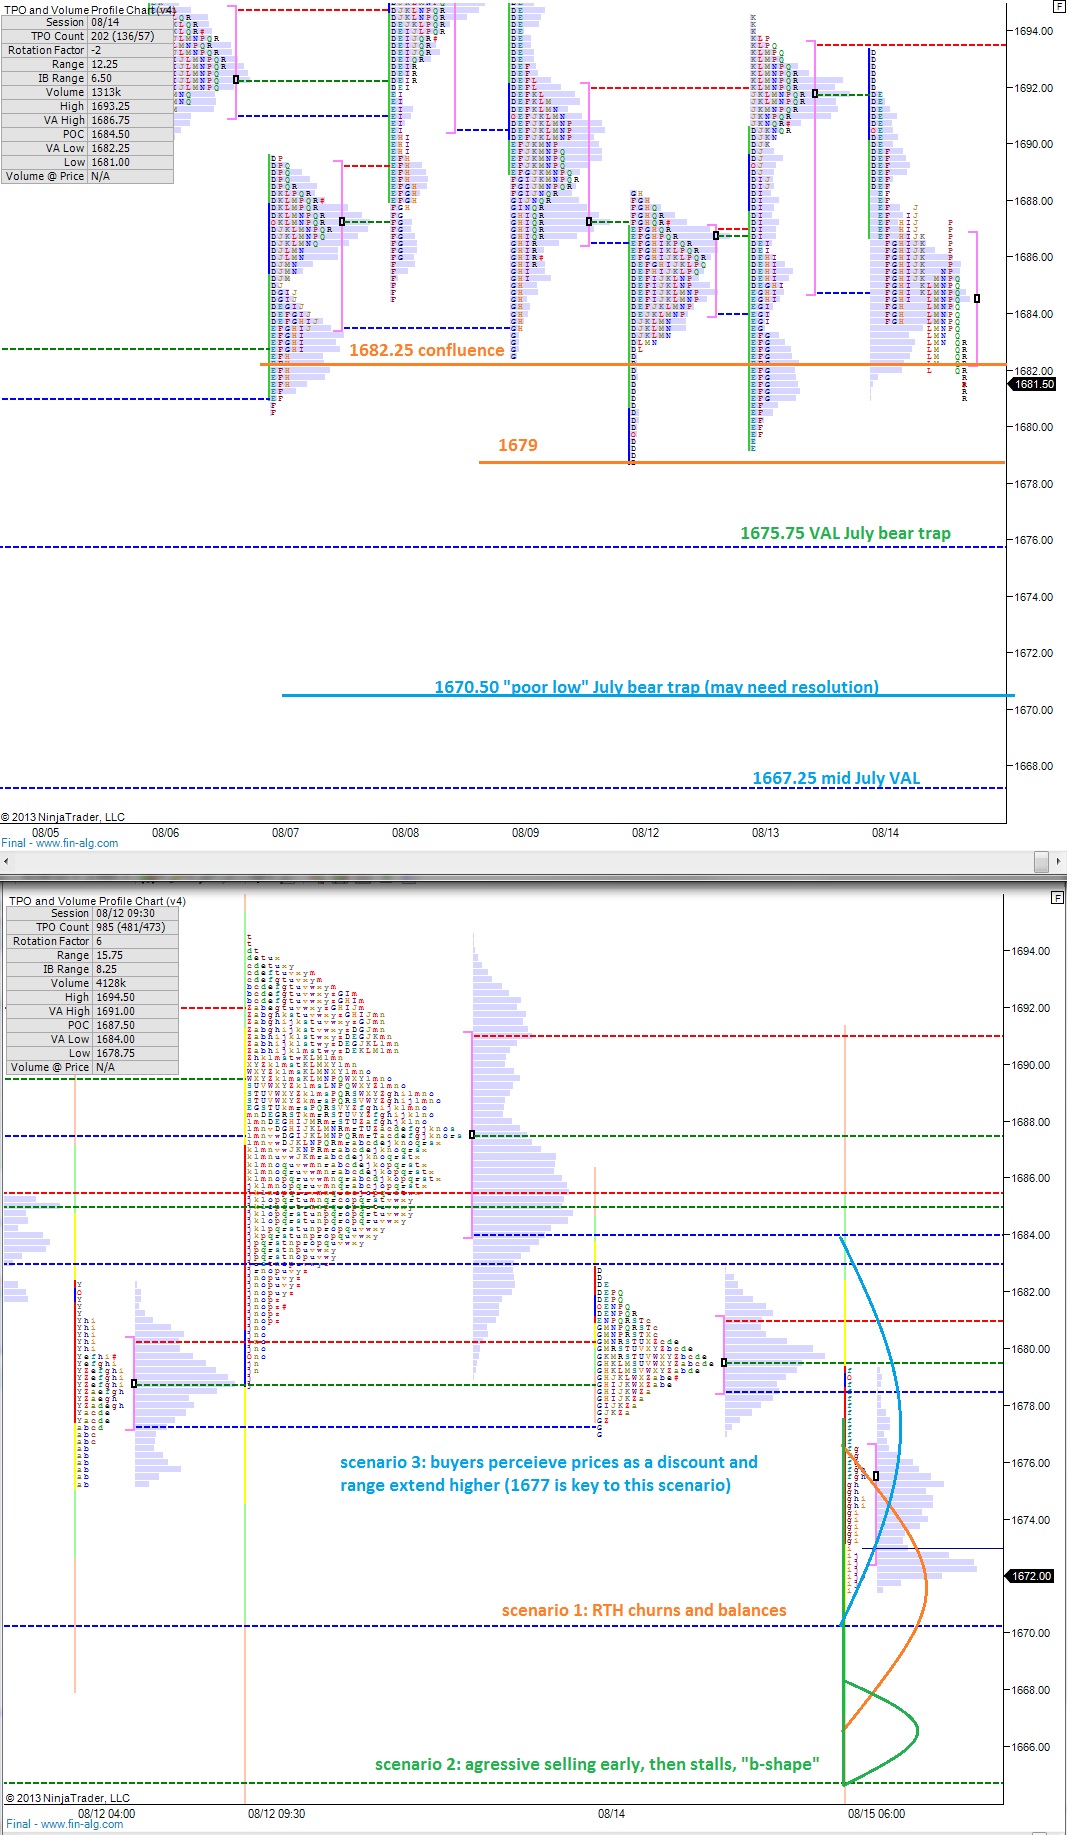
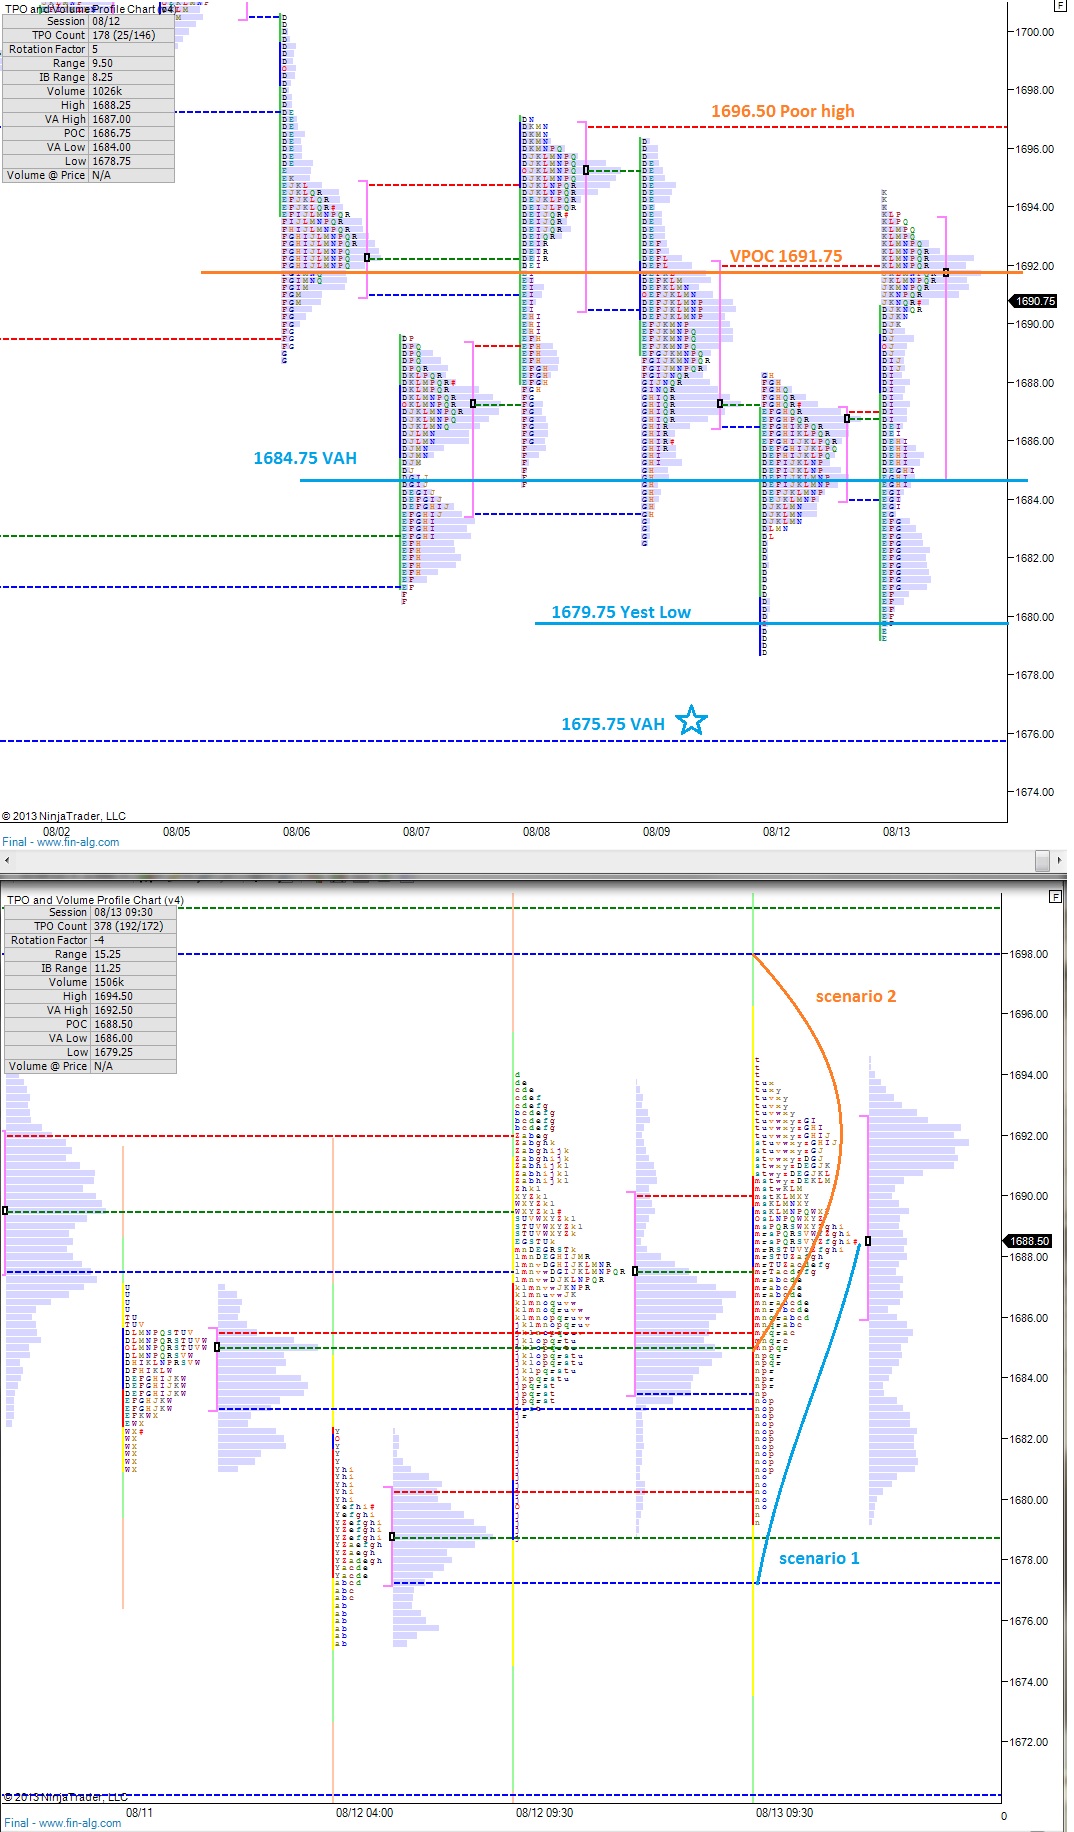
I’ve split the overnight profile into two parts to emphasize the short squeeze P-shape that developed and highlighted a few scenarios for today’s trade.  I’ve also marked the RTH profiles with levels of intraday opportunity on the following profile charts:


ES_MarketProfile_08222013

Comments »

Wild Chop Gives Way to Selling into The Bell

It was another frustrating day of RVLT sucking wind only today it was accompanied by APP.  I’m a huge fan of the APP brand, so their ticker is a permanent fixture on my Always Stalking watch list.  When it fell out of the tight/multi-month consolidation I took it to be the head fake, the shakeout, before the actual move.  Well wouldn’t you know it, I was -10% on the name in a flash reminding me how important entries are on these low priced stocks.  I simply don’t have a ton of conviction here, so I cut my loss and moved on.

You know my thoughts on RVLT.

YGE was interesting today, being one of my largest positions and all.  I want better prices before parting ways with any of my shares.  They’re Chinese and solar, I mean, what’s better?

Yelp had a decent day and some clown ‘angel investor’ put on his big boy pants and bet five stacks Yelp will be out of business by 2015.  Oh, you bad.  He made his bet via FB, BTW.  Have you heard of the stock market, you coward?

Nothing else really materialized in my swing portfolio.

Meanwhile, you hear traders calling days like today a day trader’s dreams or a day trader’s environment and I’m pleased to report #BOSSRAM concurs.  On the session, Bossram Alpha took 12 trades covering three different cycles and went 12-for-12 to earn a staggering 13.75 handles.

Based on a one contract position size Bossram yielded $687.50 before commissions.  Considering the position size can increase by one contract for every $1800 earned, you can see the scalability.  All trades taken must have seen price to go through the entry and exit by a tick in order to validate the walk forward and provide conservative numbers.  I think it’s safe to say BOSSRAM does well in choppy environments.  Aka, this is the perfect fix for a momentum trader stuck with summertime sadness.

I’ve been overly excited for algorithms I’ve built in the past, so believe me, I’m still a skeptic.  But today’s performance was dead on with what I’ve seen occurring in my seven month back test.  ROBUSTO!

I look forward to taking the cycle live alongside my current /ES trading repertoire.

Be on the lookout for odd moves overnight, it seems like that kind of night…especially with the rare moon.

Comments »

Stuck Between Two Humps on Hump Day

A simple price check of the S&P futures via your favorite electronic device may give you the impression the market has weakened overnight.  However, when you frame the overnight auction in the context of our recent profile developments, you’ll see the market is still stuck between two large value humps and working at filling in the cave.

Market profiles are quirky characters that insist on adhering to the familiar bell-shaped distribution.  It’s nature, really.  For the most part, we can play along with these formations to build context into our trading.

The momentum ball is still in the seller’s court but the bulls did a decent job of stalling their progress yesterday.  My initial expectation is to stay stuck in between the two value humps highlighted below until we get some Fed talk to move the market.

I’ve highlighted a few scenarios in the following profile charts, as well as marked up the relevant price levels on the RTH chart:

ES_MarketProfile_08212013

Comments »

Bad Move Bulls

My book recaptured over 1.5 percent of the most recent losses today if you don’t count RVLT.  Unfortunately for the Raul, RVLT very much indeed counts, and today’s respite was much less.

BLAST.

A stock down big during an all-up tape is like a cold dagger to the back.  The blade is chilled even further, perhaps dipped in liquid nitrogen, when a stock gets crushed on no news…simply more sellers than buyers.  But since said blade has been dipped in liquid cold nitrogen with the intent of delivering a shrilling cold death blow it is brittle.  Pathetically brittle in fact, to the point where my Greek bones, formed atop Mount Olympus, shatter the dagger into a million tiny fragments at the point of contact.

Such is the eventual fate of those who bet against me in RVLT.  Of that you can rest assured. I added to my position today.

Other interesting thoughts toddling through my mind: I started getting the itch to size my O long back up yesterday.  I didn’t actively listen, and the thought continued in my mind all day, like a catchy merry-go-round jingle.  I like O down here, but I know so little about REITS and RATES and ROUTS which made me a bit abash to sounds the horns.  Consider this: O is unch on YTD and pays a 5.5% coupon.  If you didn’t get a piece of the capital appreciation, you’re still making bank.  Relax, and wade into this space before it is again en vogue.

YGE was my largest position coming into the day.  I’ve been in this name for quite a while, wondering if I’d one day wakeup to a Chinese air raid, a Red Dawn of sorts.  It hasn’t happened yet.  The Chinese have been very kind to me because I’m a diplomatic gent.  Respect is important in all cultures.  That being said I consider this week’s action is YGE to be of the do-or-die ­variety because we’ve reached a critical juncture on the chart that can explode in either direction.  Odds favor the long side still, so I’m expecting the gods to shine on these solar panels.

The tape as dictated by the /ES got a bit ahead of itself today.  This became evident when the market didn’t rotate off the value hump at 1652.25.  Given the weight of tomorrow’s Fed talk and the confluence of value around these levels, to disregard them and print higher seemed either surprisingly bullish or getting a bit ahead of ourselves.  The market, our favorite arbiter, answered that question by swiftly correcting the tape into the bell.  It was nothing more than a ruler slap to the bull’s knuckles IMHO.

Being about 85% long, I clearly am free of bias.

But seriously, I work hard to remain objective in my profile analysis.

Until tomorrow,

Raul


Comments »

Finding Buyers

Buyers entered the market early Monday morning and lifted prices higher during the first half hour of trading.  It was at this point that the force exerted on the tape by the flow of sell orders became greater than the momentum of the buyers.  We spent the rest of Monday auctioning lower.  The action trickled into the globex session until the market finally found buyers at 1641 about the time European markets opened.

The Euro dollar firmed up overnight as well.

As the USA came online, we saw more buy flow entering the tape, pressing prices back toward the opening print from Monday near 1650.  This makes for an interesting junction to open the cash market.

I’ve looked at the 24 hour profile two different ways this morning, first exclusively separating the profiles into individual distributions, and second I looked at a merge of the nearby auctions to create a micro composite of the last several days’ activity.  From these two looks I’ve drawn out three possible scenarios that would not surprise me in today’s trade.

I’ve also highlighted some price levels of opportunity using the RTH profiles on the below charts:

ES_MarketProfile_08202013 ES_MarketProfile_08202013_24H

Comments »

The Big Gap Fill Marches Onward

After gapping higher in July and pressing to all time highs, the S&P grinded out a sideways consolidation before experiencing the corrective trading we experienced late last week.  The downward action is accomplishing the ever important task of filling a gap in the price action.  When we gapped higher on 07/10, the market left a large gap in its wake, spanning from 1661 to 1653.  The closing price on 07/10 was even lower, at 1644.75 which is where we need to trade to fulfill the gap.

It will be pertinent to monitor the profile levels from 07/10 early this week as we come into its range.  1647.75 marks the value area high.  Spending an hour or more trading below this level swings the door wide open for trade down to the gap-fill/VPOC at 1644.75 and the value area low at 1643.25.

The S&P is currently priced three handles below the Friday closing print and this gap is another (smaller) piece of context to be mindful of.  Trade back up to 1651 or perhaps to the overnight VPOC at 1651.50 seems a distinct possibility if the revision trade kicks in early.

Up above we have plenty of tradable opportunities at resistance which I’ve highlighted on the following profile chart:

ES_MarketProfile_08172013

Comments »

Deploying Cash to Explore for Oil

I used some of that pesky cash on hand to reinitiate a position in END and start a new position in MHR.  I have to tell you, the news cycle is an interesting creature, feeding us what we demand.  Take Egypt for instance: they’ve been backwards freaks since the nose dropped off the Sphinx—troglodytes in sheep’s clothing.  Yet here we are, with oil pulling back ever so gingerly after thrusting higher, and the news is aligning with another thrust.

Talk about harmonic orchestration!

I’m not here to debate the toxicity of news.  I write to bring you the news, as filtered by my deranged microcosm.  Oh, and I’m here for one other reason—to extract money from the stock exchange.

I’m up over one and a quarter percent today which has helped return air to my lungs.  It was getting hard to breathe there for a minute.  I had nine-one dialed on my rotary phone, entirely prepared to round out the final one only a moment before fainting.

Now I’m going into the weekend with confidence, unjustified as it may be, restored. I need weekends, you see, to allow me to gather my thoughts so I can survive five days of market flow.

I bought back into a long time favorite company and short term favorite stock of mine, American Apparel.  They are the Cadillac of undershirts, which is great, I wear them almost every day.  But buying their stock was simply a matter of financing more tee shirt purchases based on a chart I like.  This thing has been dead money for-e-ver, and someone tossed in the towel these last two days, “fuck it” and I was there to claim their shares.  I’ll AT THE LEAST, ride these babies back up to the dead money zone.  At the most, we’ll finally get a pulse and I’ll ride a pumper.  There’s a lot of good investors who believe in this name.

Heading into the bell, I’d like to open my book to your criticism.  Here are my swing holdings, listed largest to smallest:

YGE, AIXG, RVLT, CREE, END, YELP, F, APP, MHR, LO, FB, IMMR, and O

I’ll be checking in this weekend with some data stuff I’ve been working on in the /ES.

Comments »

On The Lookout For Dynamic Action

The overnight session continued gyrating and trading decent volume after yesterday’s strong move.  The profile printed by the action shows a semblance of balance with the buyers working to regain a bit of control.  The key achievement of the buyers overnight was setting a higher low at 1656.75.  It will be interesting to see if they defend this level early on (if necessary).

Going into Friday trade, I’m interested to see if participants are as inactive as we’ve seen in other quiet Friday summer trading days, or if they’ve been lured back into the market by the dynamic action.  If we see a small range session with little range extension that would tell me we’re seeing mostly local trading.

I’ve highlighted a few larger scenarios that wouldn’t surprise me to see play out on the below 24 hour profile chart.  Either one of these distribution completions would firm up the auctions taking place.  However, both would require a push from larger market participants, so it will be interesting to see how today plays out.

ES_MarketProfile_08162013

Comments »

Read The Morning /ES Report

Heavy sell flow in the globex session, most notably just after US market close and in the early premarket hours of the US session, have seen the price of the /ES down as much as 10 handles since yesterday’s close.  Mounting tensions in Egypt, Cisco earnings,  and the overall benign action of August appear to have motivated sellers into the market.

If you zoom back and view the bigger picture via a daily chart, you’ll see the market formed a tight consolidation triangle, compressing price, before bursting lower.  This type of move can carry a lot of energy, but thus far has only taken us to the low end of an otherwise bracketed market.  See below:

ES_DAILY_08152013

When I look at my 24 hour profiles (second profile chart below) and start envisioning what trade may look like today, the first thing I notice is the thorough auctions that took place above.  They have formed nice, smooth bell curve distributions suggesting a solid auction of the price levels took place before the market decided to head lower.  Therefore, no unfinished business was left behind for the market to clean up before heading down.  It’s just a thought really, but adds credence to a possible deeper price correction.

The relevant levels of support coming in on our RTH chart date back to mid-July, 07/16 to be precise, which should give you an idea of the churn we’ve been experiencing.  I’ve highlighted these levels, as they will become shockingly relevant as today plays out, along with a few scenarios for today.

The best trades often fly in the face of recent market activity and if support holds, we could be in for an abrupt rally back to the top of the bracket next week because the overarching trend is still higher.


ES_MarketProfile_08152013

Comments »

Some Upside Momentum, But Indecisive

The market drifted lower overnight, not accomplishing much, but setting a higher low: the third in a series of higher lows since the market sold off Sunday night.  The momentum to the upside isn’t nearly as enthusiastic as we’ve seen throughout the year.  Instead it’s a bit more lethargic with price making a higher-high by only two ticks on the last trough-to-peak move.

The moves are also violent and with a smack of indecision, offering large chop often 10 handles wide.

I don’t have much directional conviction currently, but I’ve highlighted some key levels that may give us insight as the day progresses in the following market profile chart.  Sustaining trade over yesterday’s VPOC at 1691.75 would mark good progress for the buyers.  Conversely, taking out yesterday’s value area low at 1684.75 sets us up for scenario 2 on the below 24-hour market profile:

ES_MarketProfile_08142013

Comments »