iBankCoin
Home / Market Profile (page 142)

Market Profile

Coming into Overhead Supply

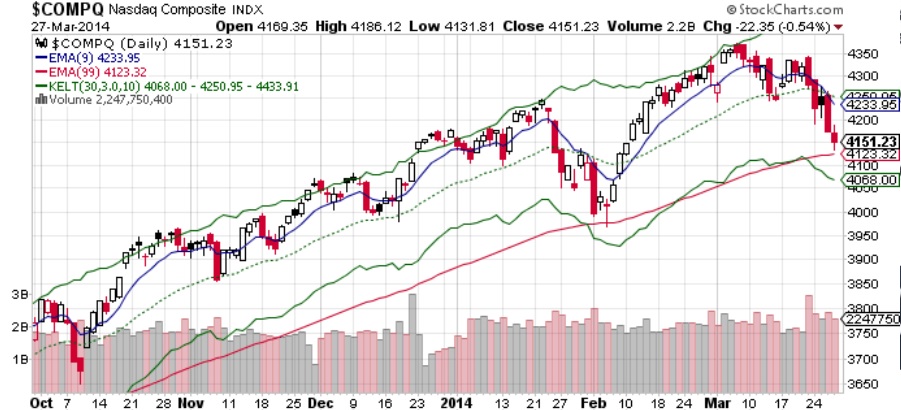
Yesterday was a strong day for the NASDAQ index, a day marked by aggressive other timeframe (long term) participation.  We really dial down in these morning context reports to wrap our mind around the context of the marketplace.  We focus on the NASDAQ because most of the high flying momentum stocks reside within it.  As important as the short term timeframes are to our daily decision process, we always have to keep sight of the big picture.  The long term auction is still buyer controlled.  This can be seen as a series of higher highs and lows on the daily COMPQ chart.  The long term buyer is now tasked with making a new swing high, otherwise the long term auction may come into balance.

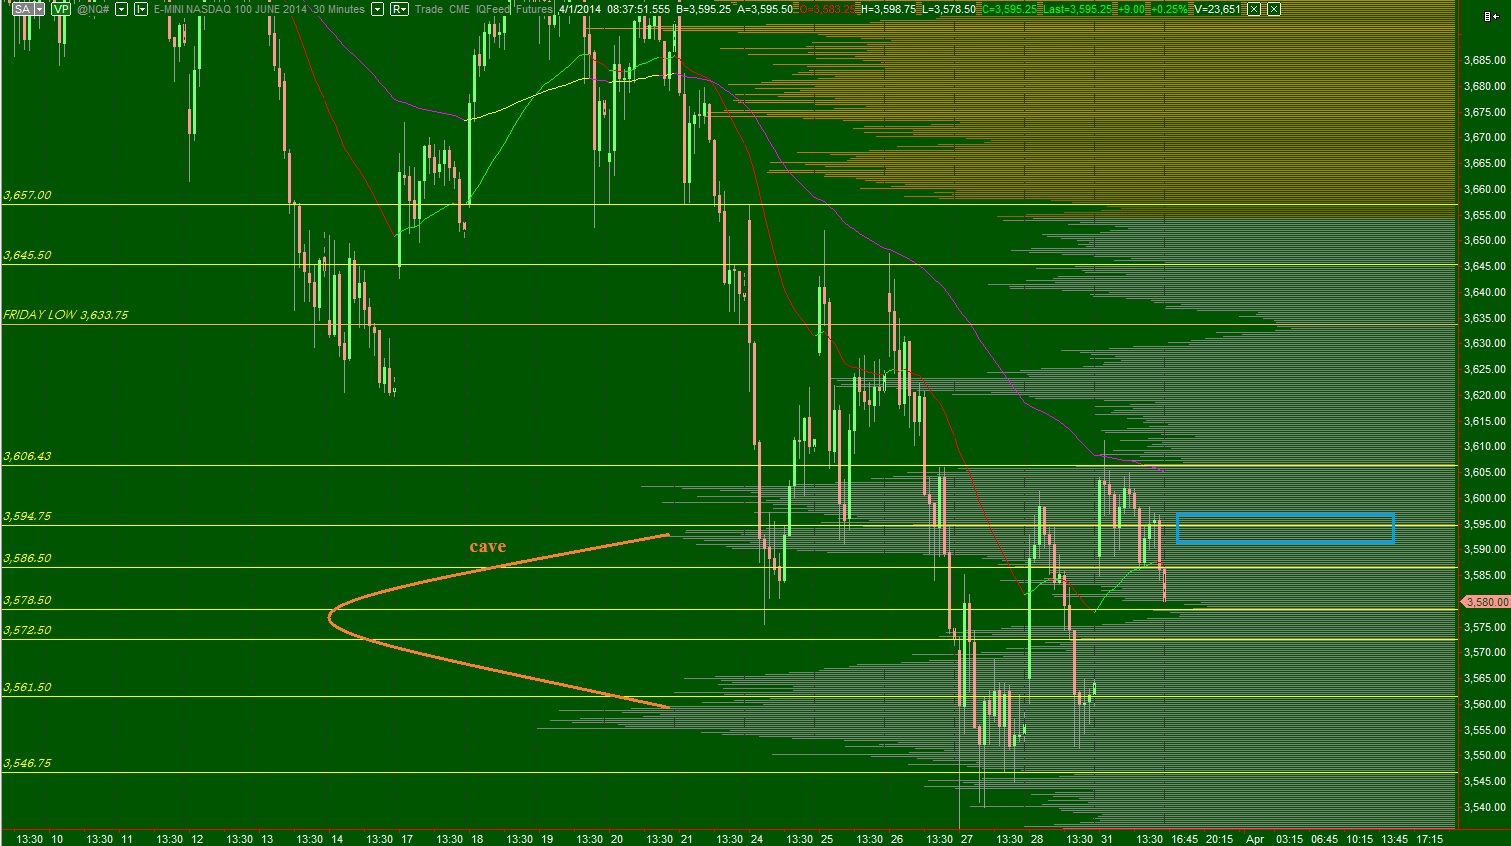
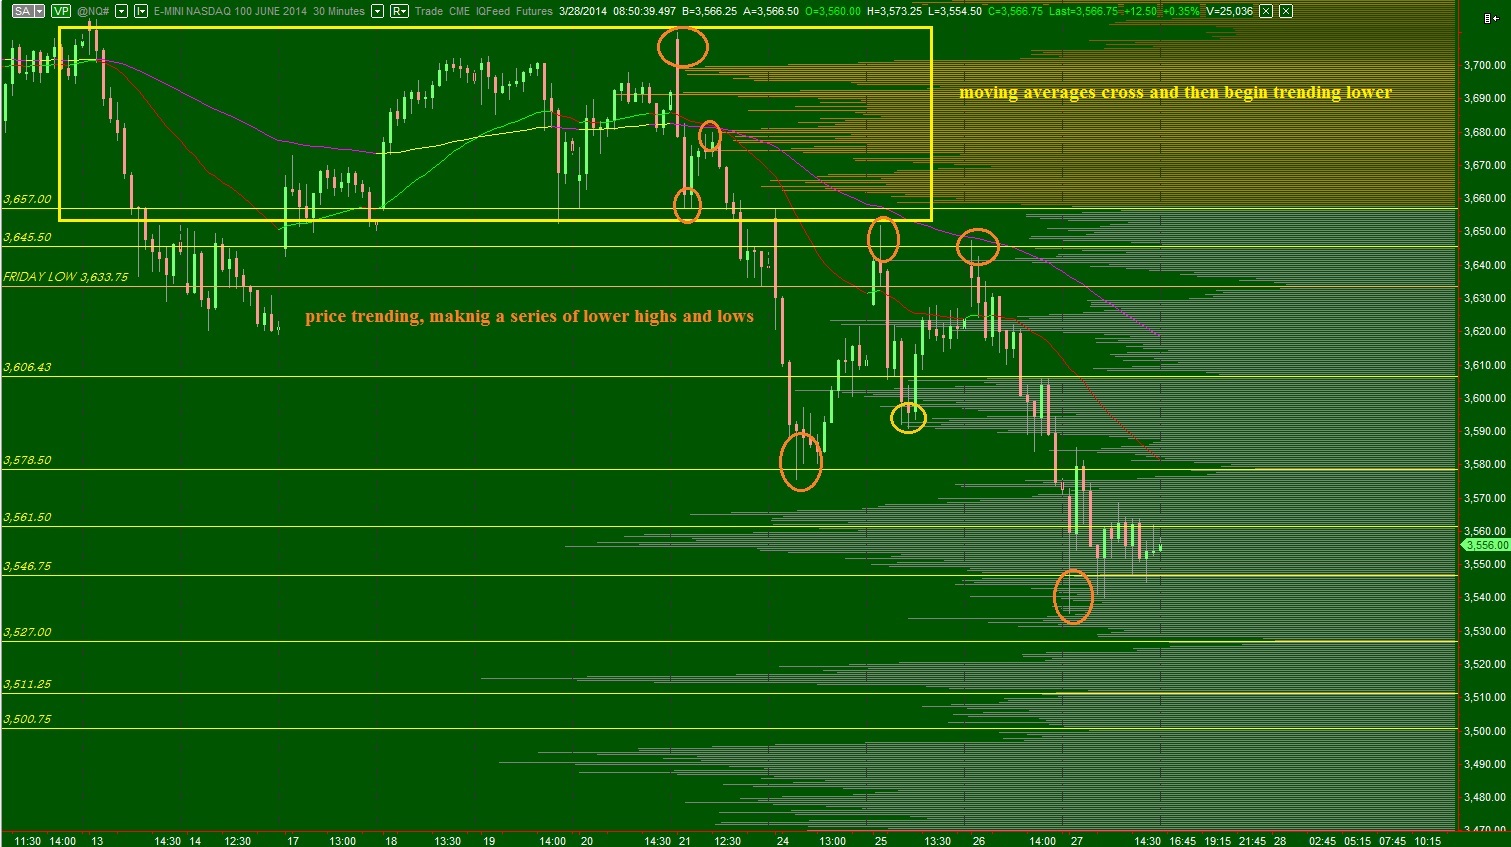
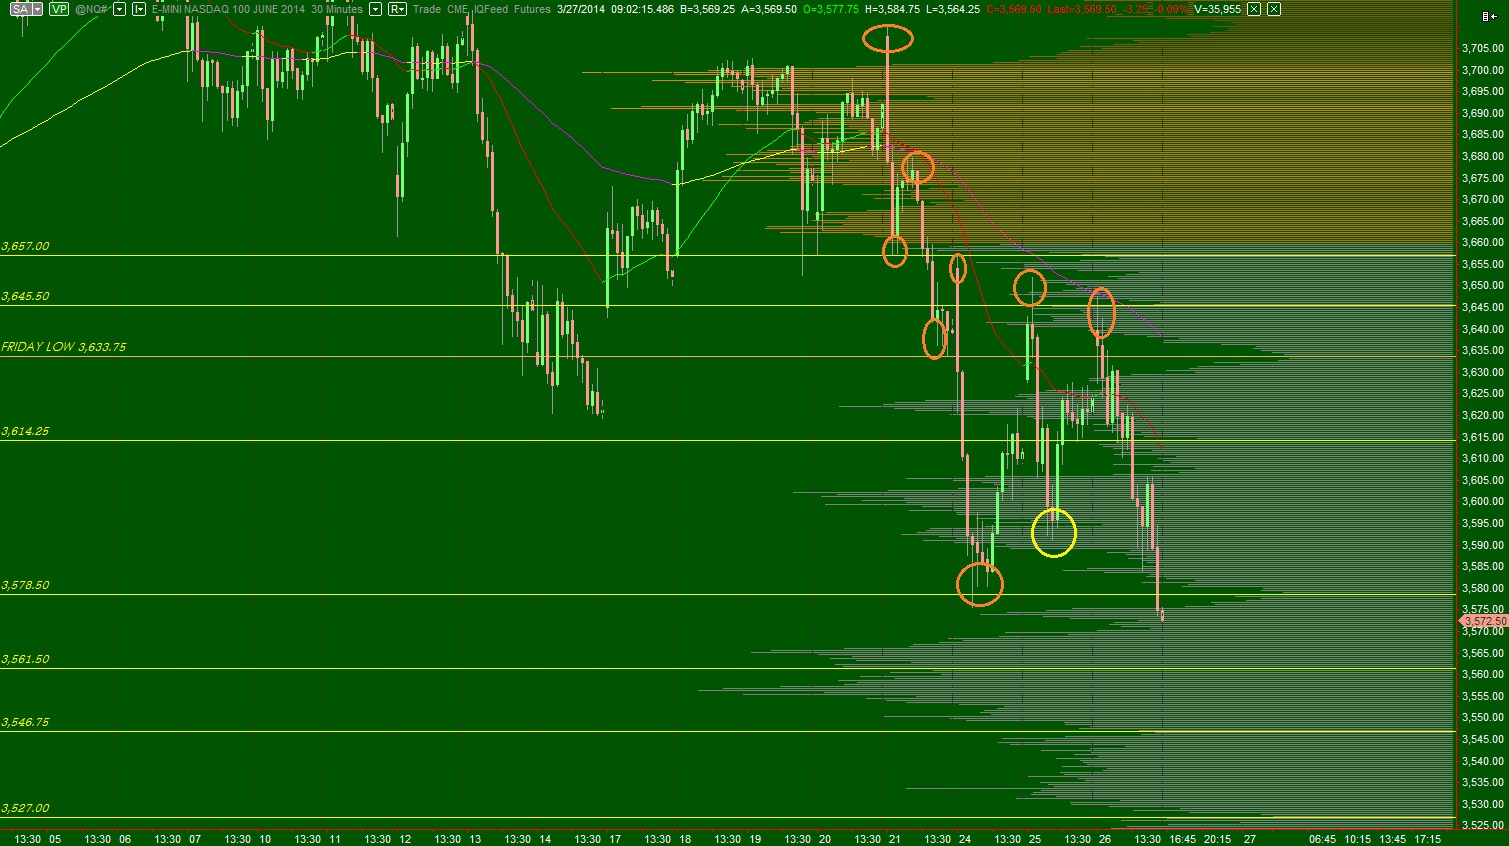
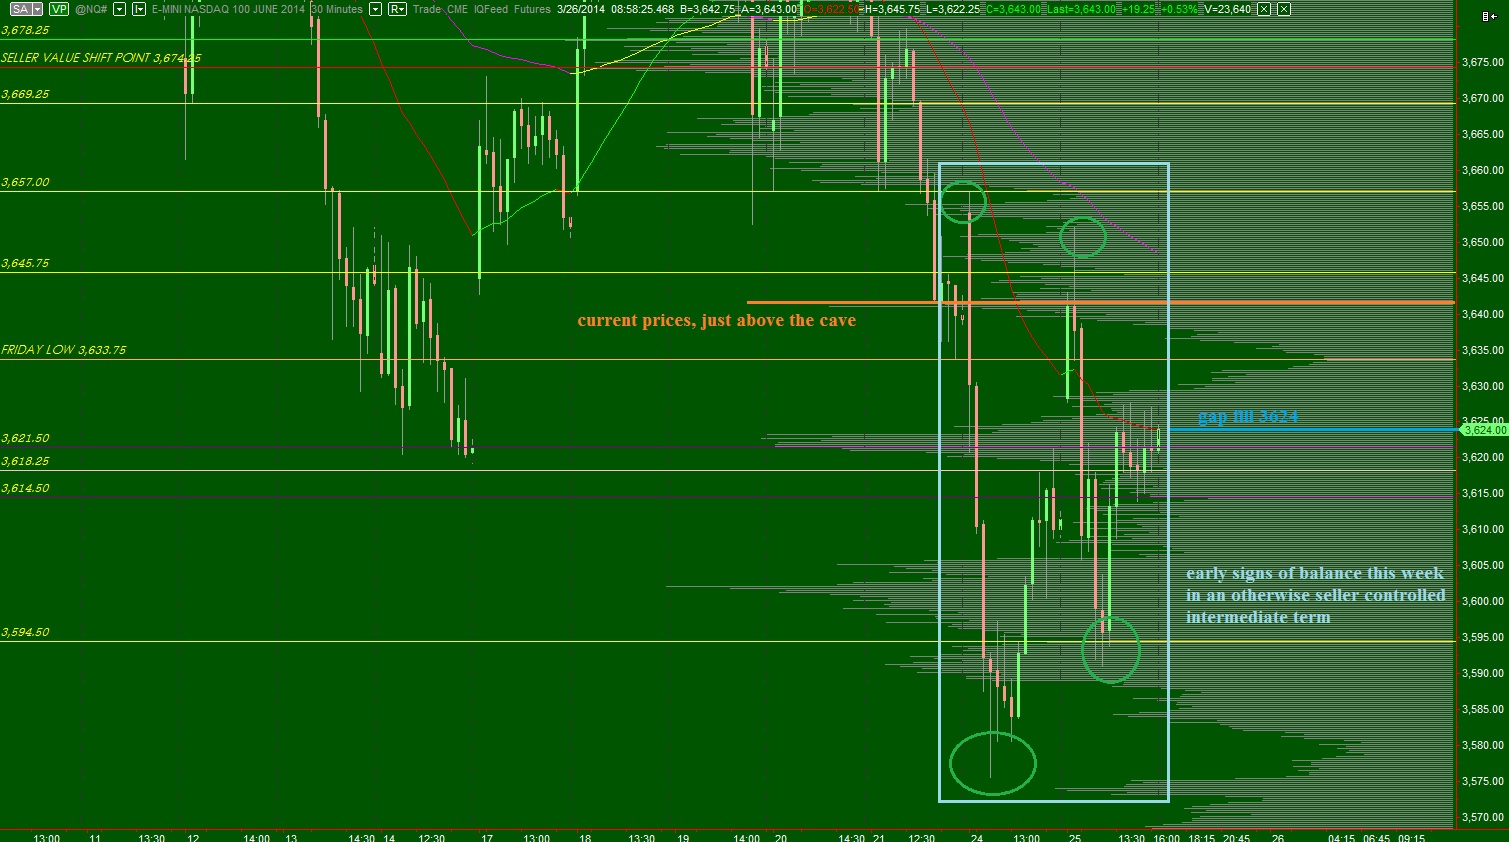
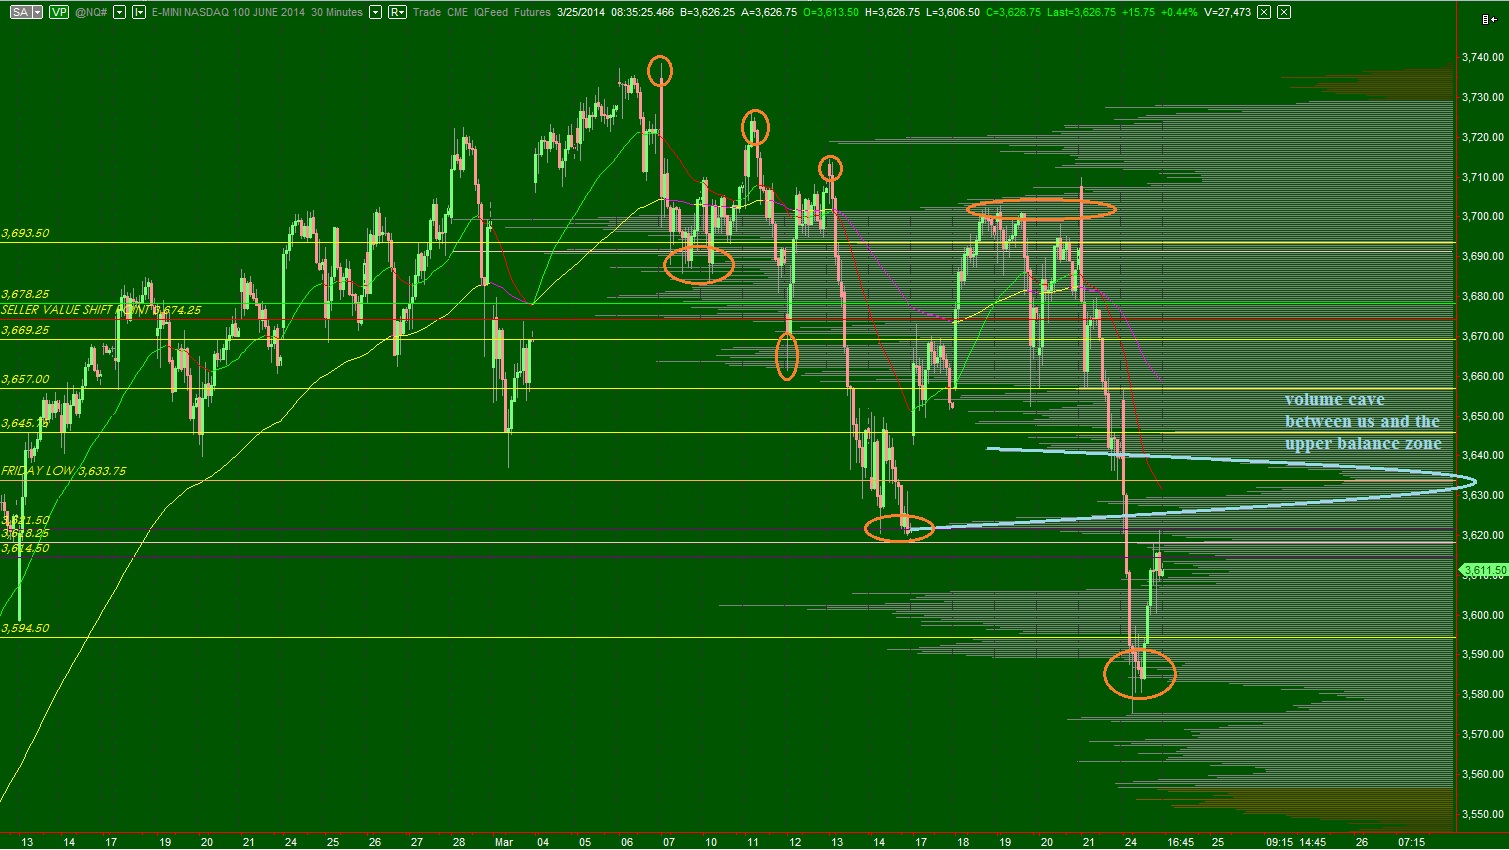
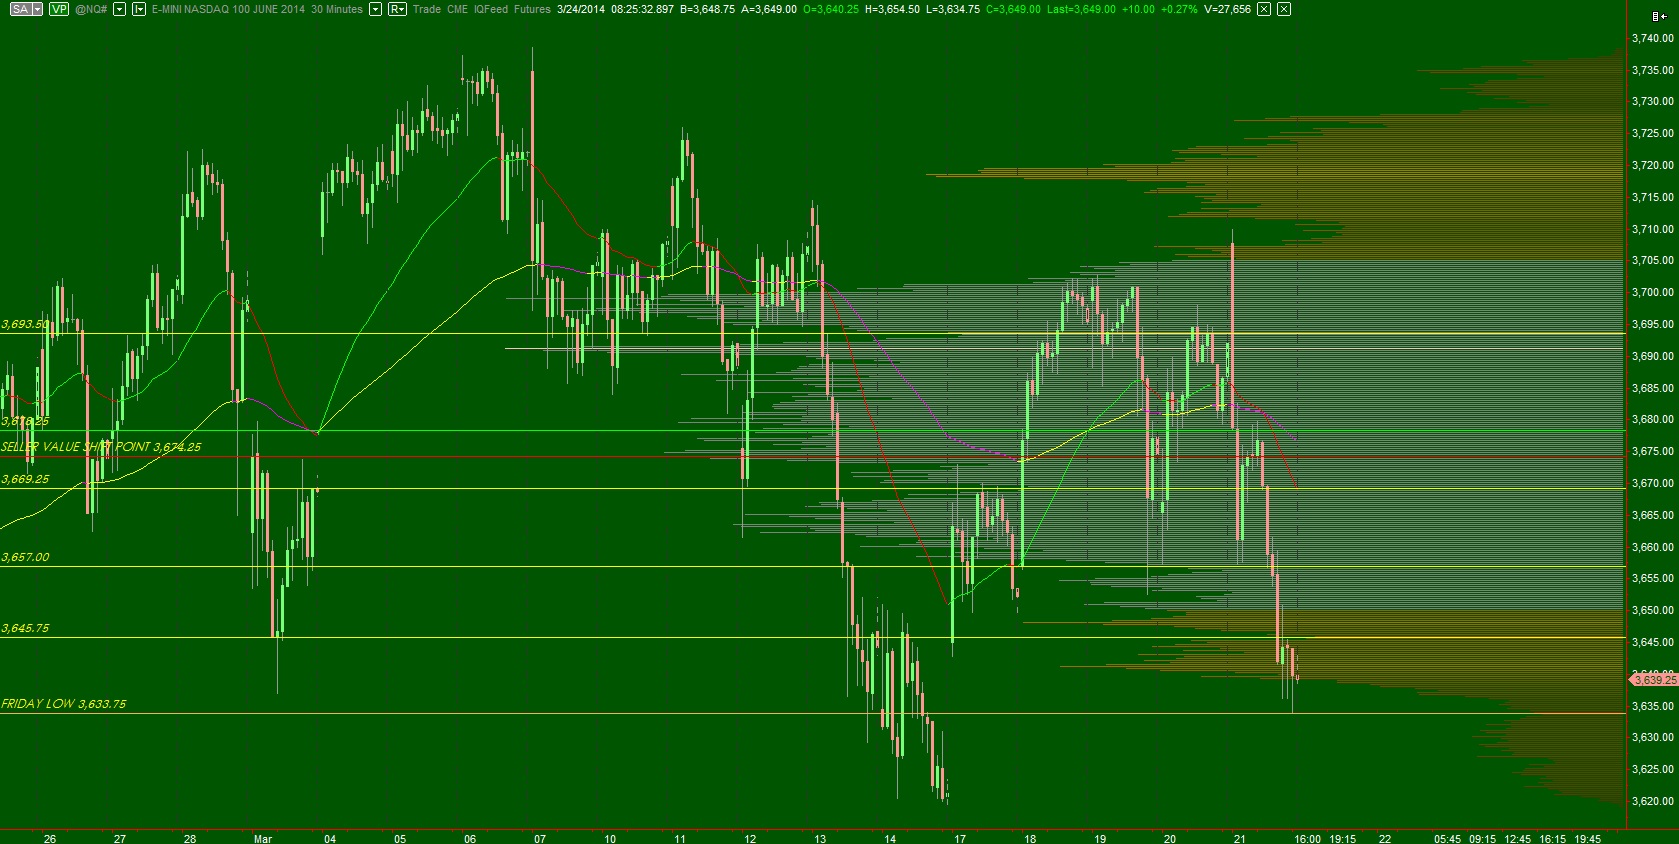
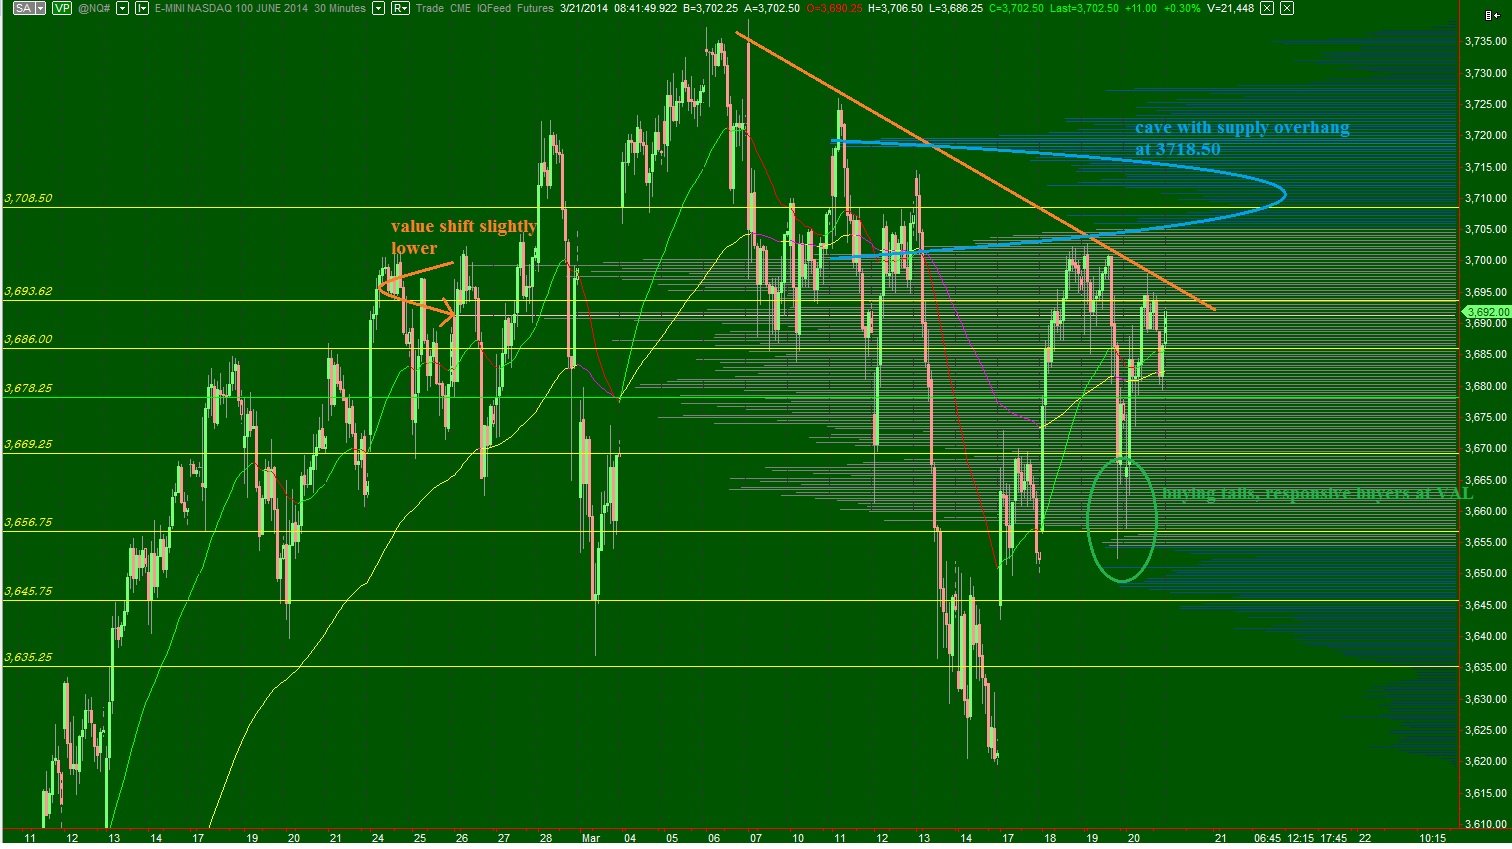
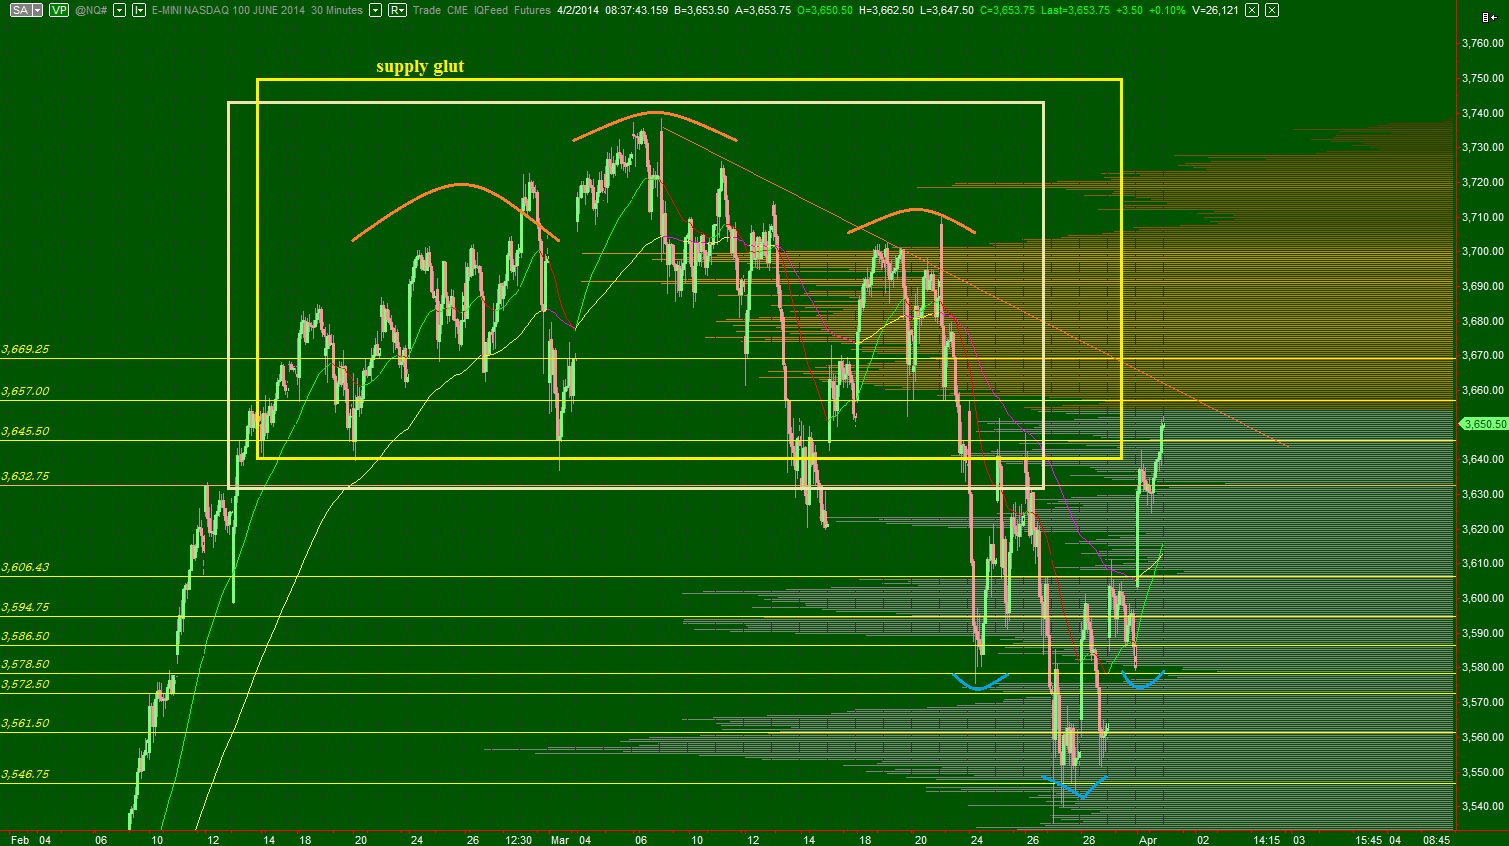
The intermediate term timeframe is balanced.  The strong move yesterday was dynamic enough to push sellers out from their controlling position.  We are however nearing a price zone where I have some expectation of selling.  Price is pushing up into the bottom of our uppermost balance distribution which dates back to February 13th, a day when Ben Bernanke gave the market a final push before leaving his post.  As participants are made whole, we may see supply coming into the market.  I have highlighted some key price levels on the following volume profile composite:

NQ_VolumeProfile_intermediateTerm_04022014

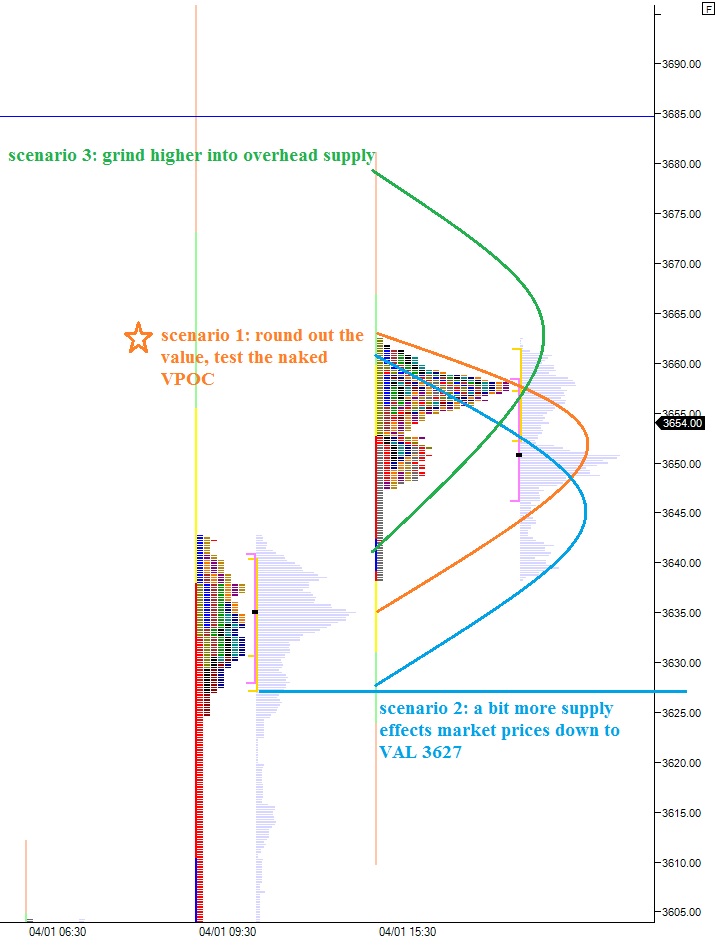
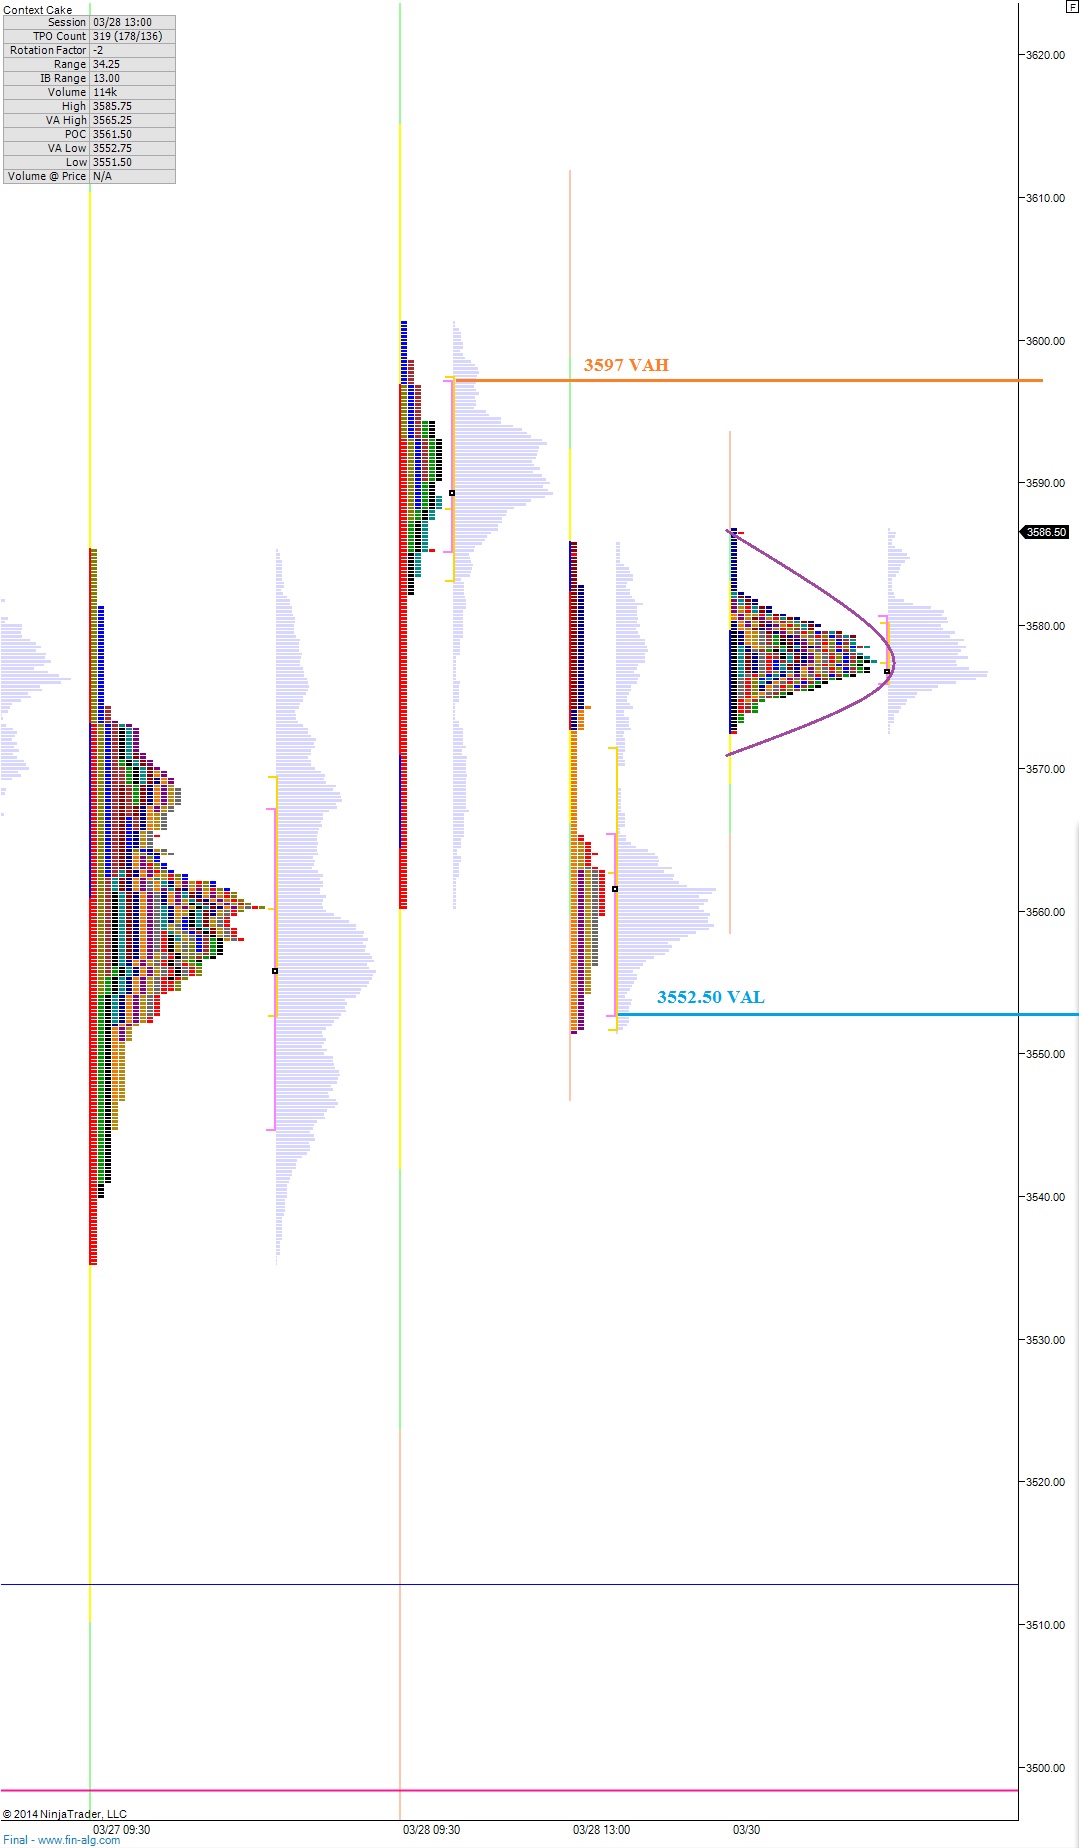
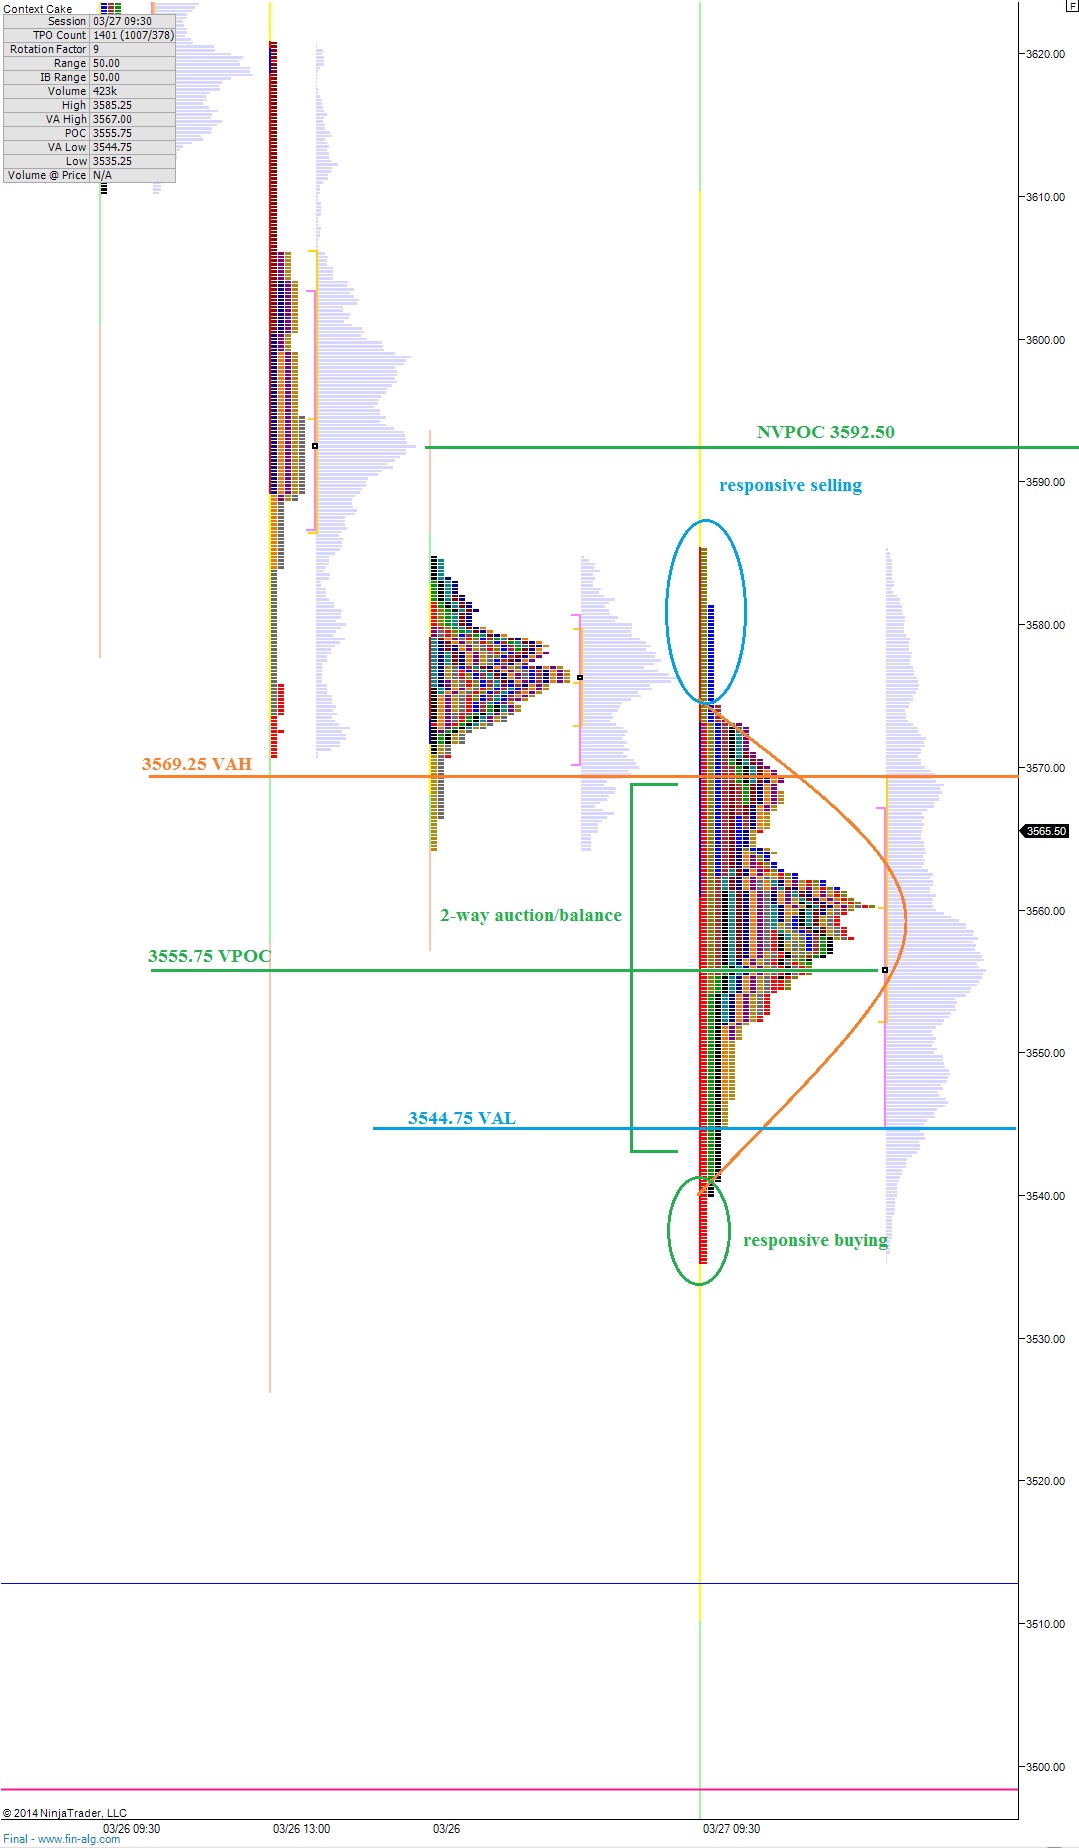
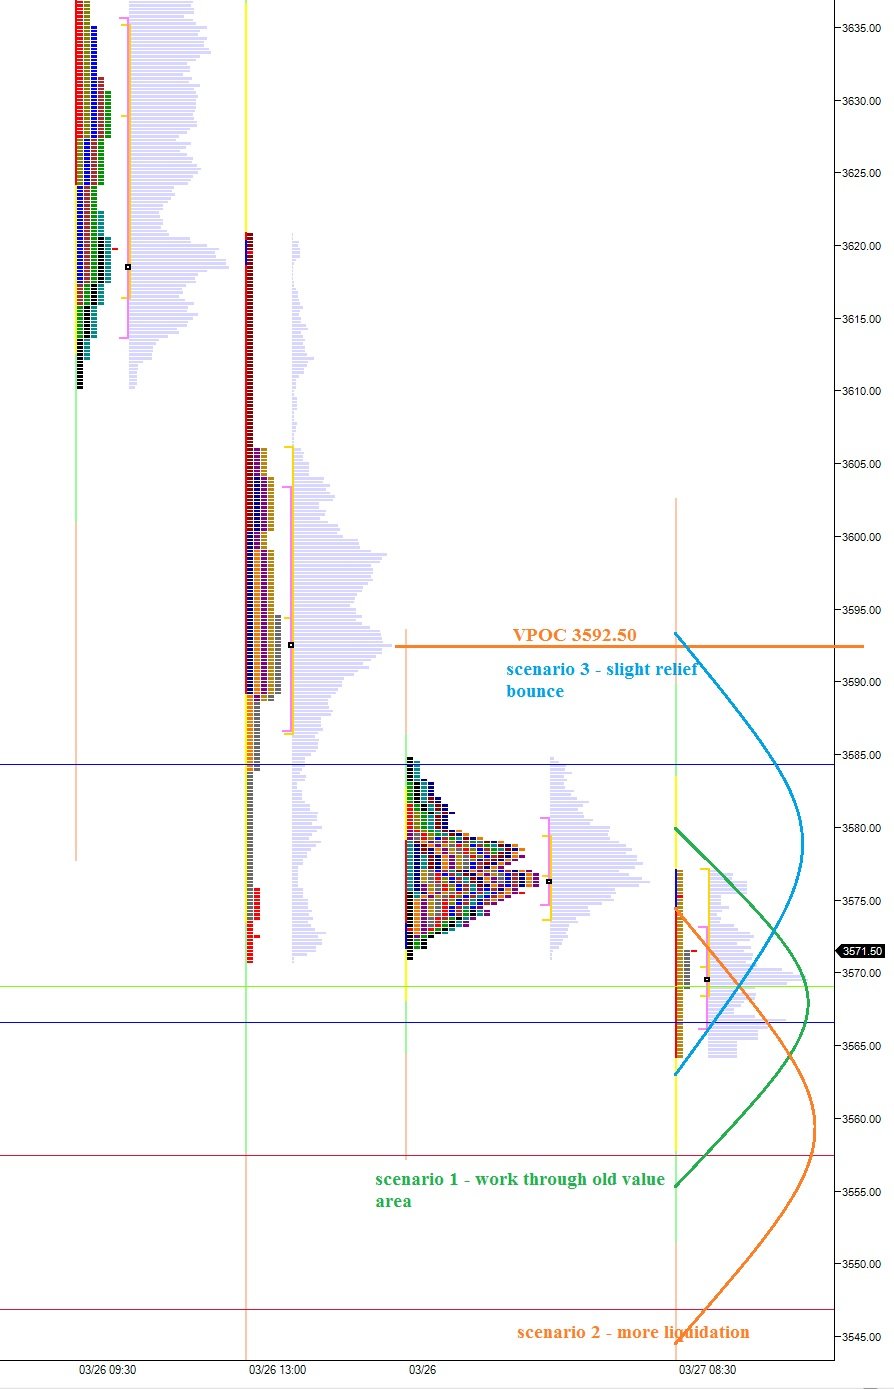
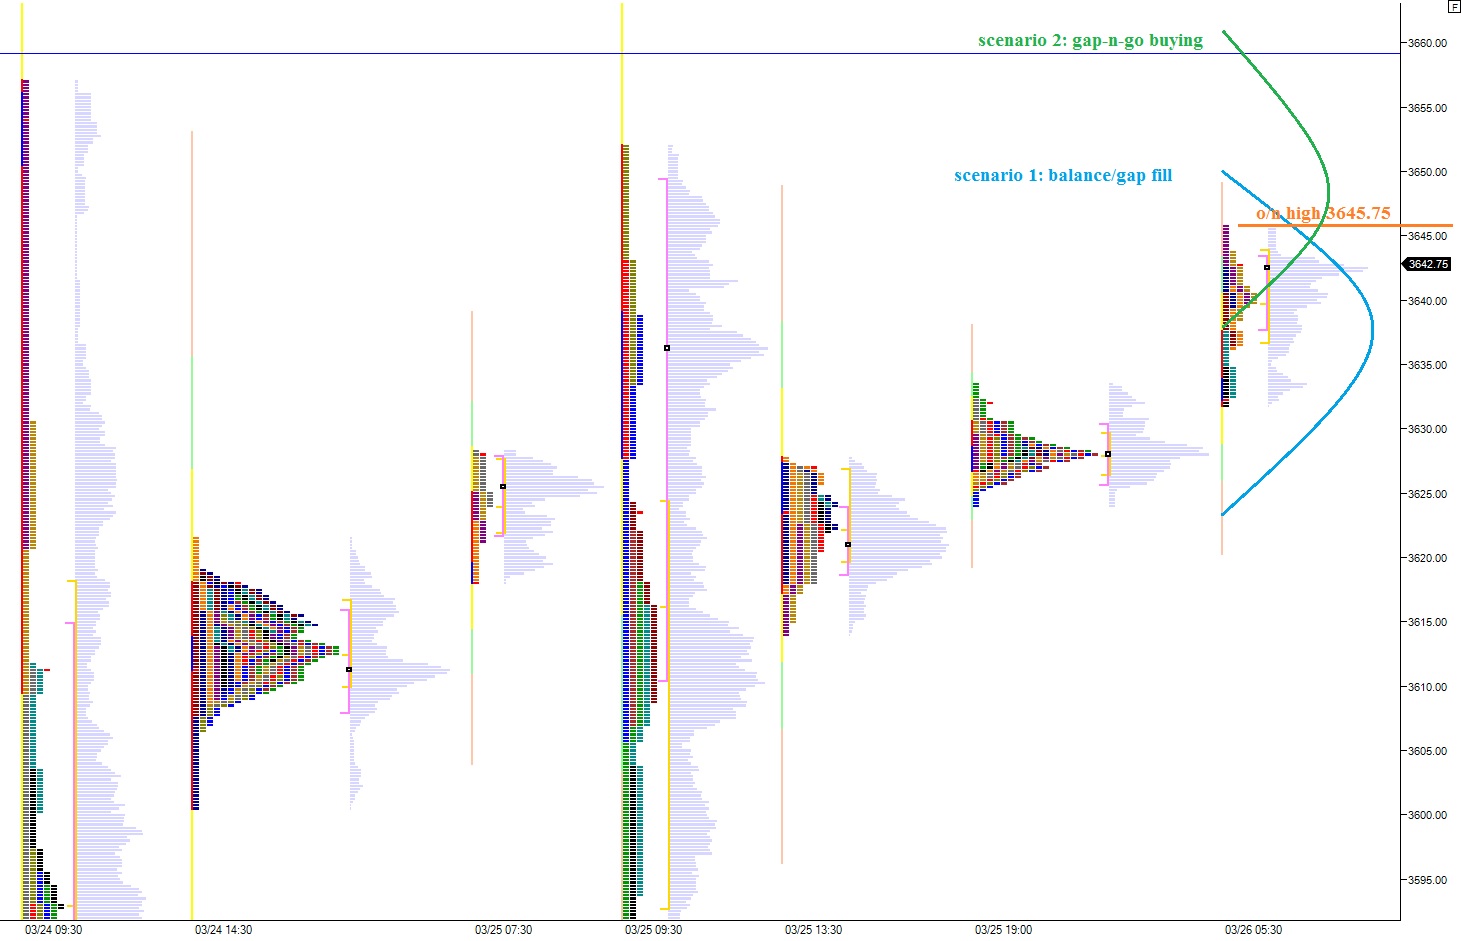
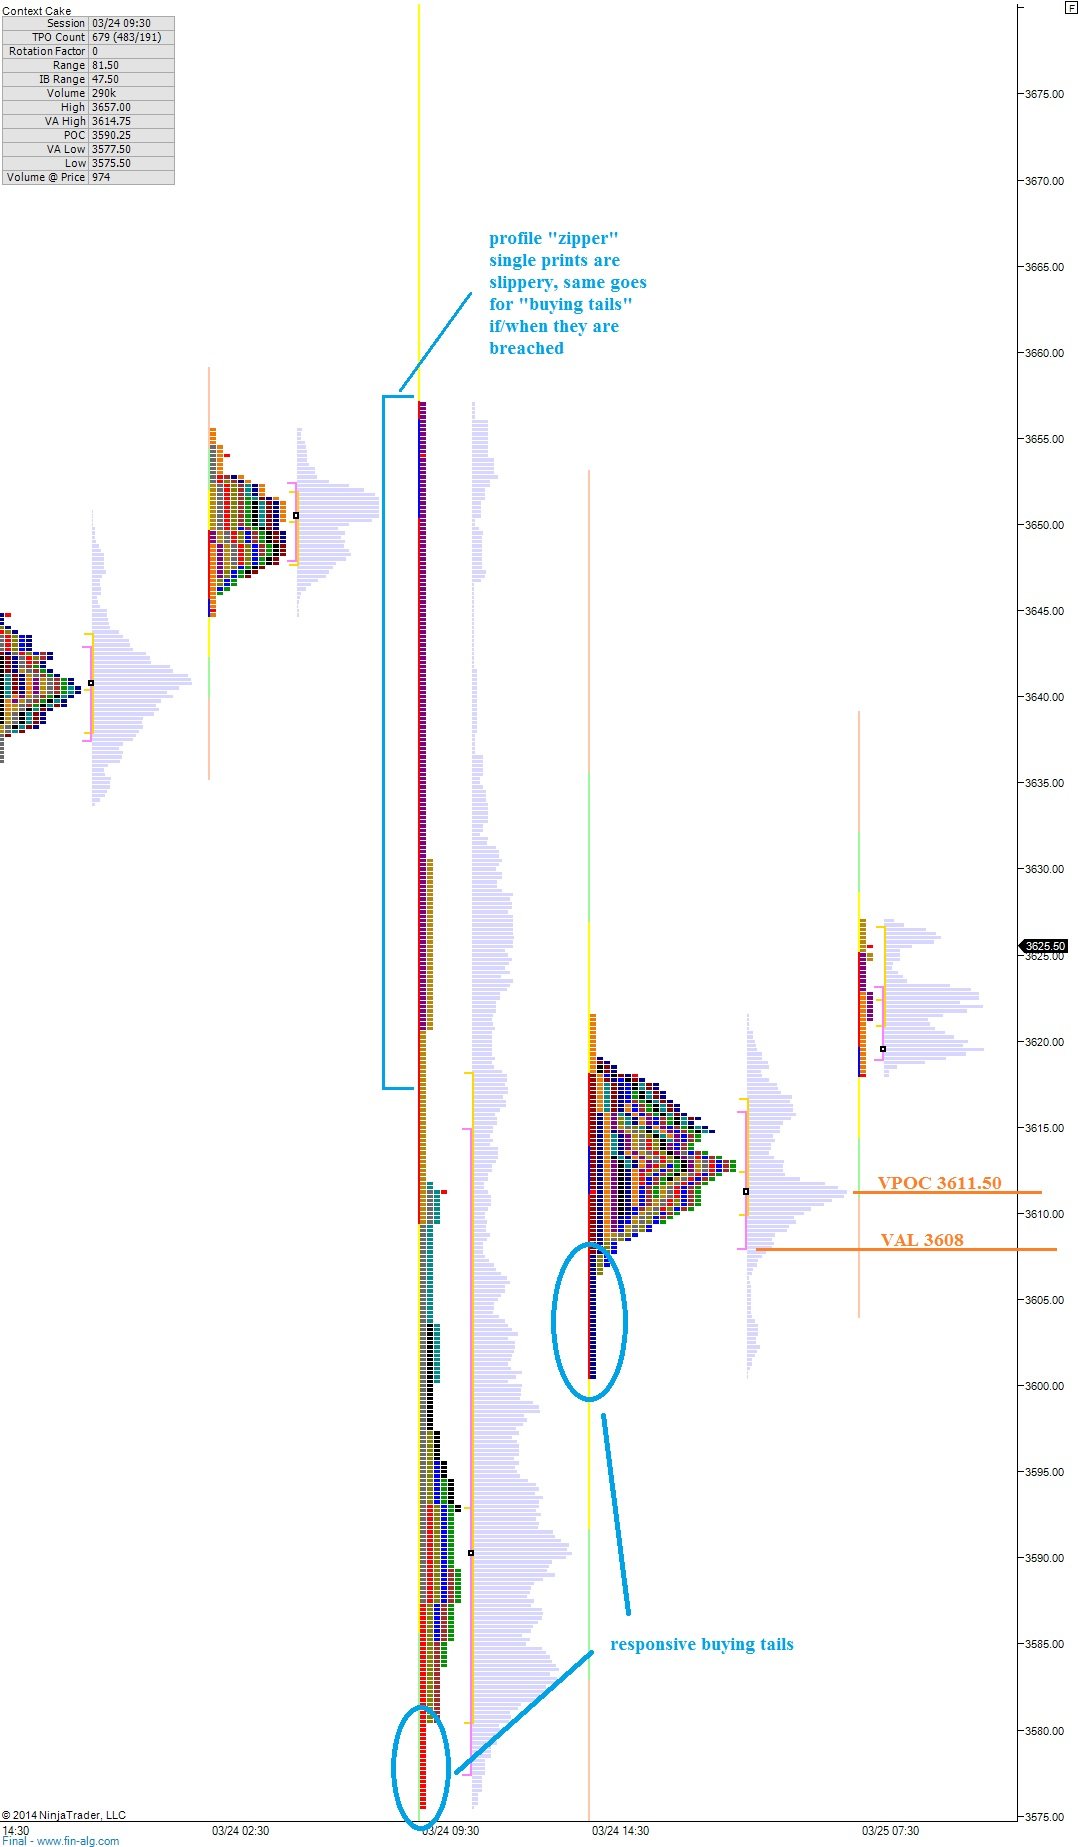
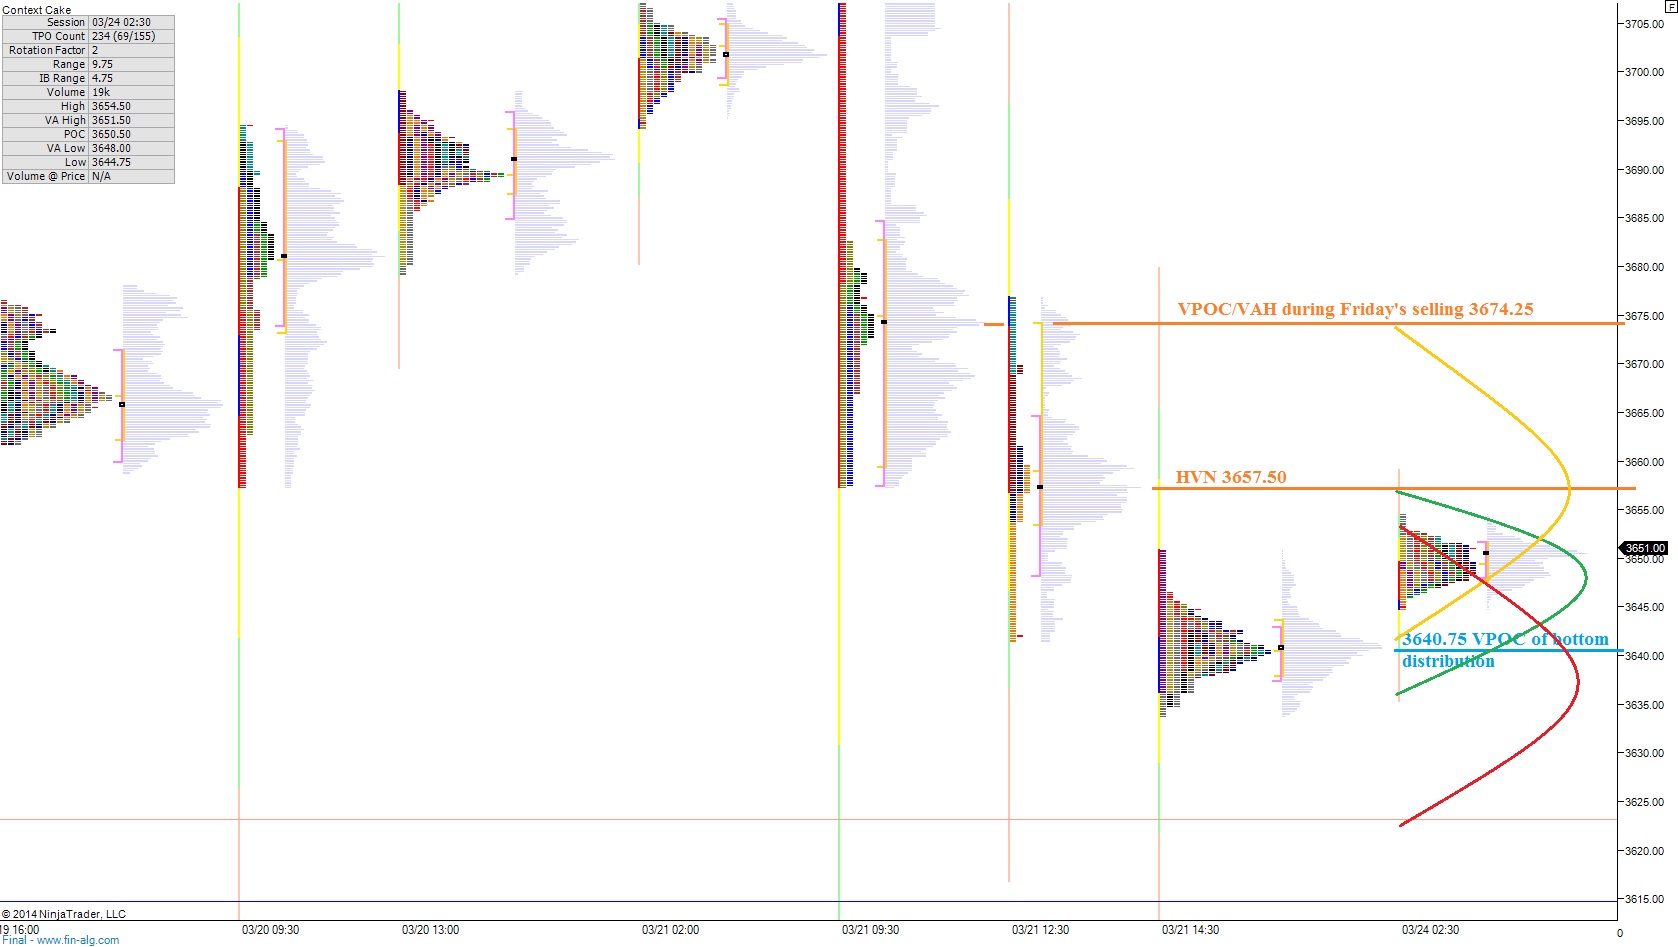
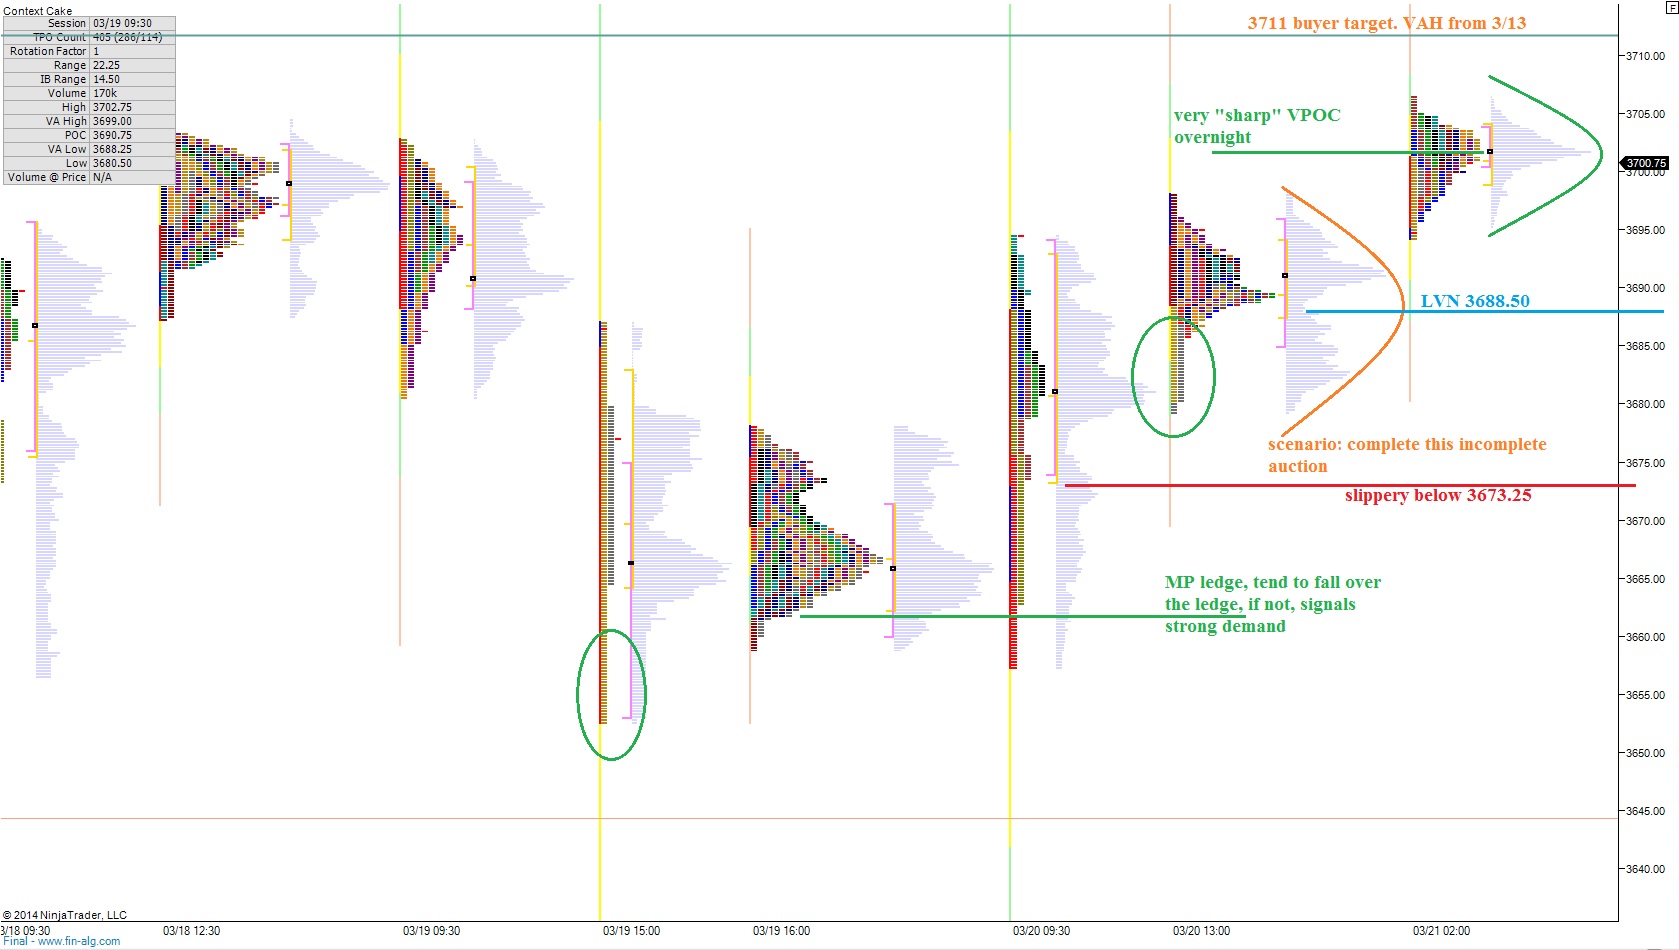
The short term auction is buyer controlled.  This can be seen as value progressing higher over the prior few profiles.  It can also be seen as a lack of overlapping value areas which tells us the buying force is dynamic enough to keep value on the move.  However, our current profile which includes part of yesterday afternoon’s rally and all of the globex session presents a slight imbalance.  From this imbalance, I envision some downside early on.  I have highlighted this scenario, as well as a few other observations on the following market profile chart:

NQ__MarketProfile_04022014

Comments »

Focusing on Early Price Action for “The Tell”

NASDAQ futures drifted higher overnight and as of this blog are set to open inside of yesterday’s balance and range.  Opening inside of prior day range presents a lower risk/reward environment.

The composite index gapped higher Monday morning and was mostly able to sustain the gains.  We did see heavy selling into the bell which carried over into the post market settlement period.  However, this selling was not able to achieve even a half gap fill.  As we progress through this week, we must keep this gap context in mind and how the market ultimately handles it.  Do we leave this gap behind?  Does it half fill then find buyers?  Or do we close the entire gap and then ignite selling momentum again?

Standing between us and the above gap fill scenario is a volume cave on the intermediate term.  The cave spans roughly from 3590 – 3565.  We entered the cave yesterday but sellers ran out of time.  With the overnight inventory long, I suspect we may see sellers present themselves after the opening swing and attempt to stimulate liquidation through the cave.  Whether or not they succeed will be interesting because they still retain control on the intermediate term timeframe.  I have highlighted the intermediate term volume cave on the following volume profile chart:

NQ_VolumeProfile_intermediateTerm_04012014

However, this is the first of the month, the first day of a four day period where buyers have a slight edge in the SPX.  Whether this strength finds its way into the NASDAQ is to be determined.  The short term auction is balanced.  We are trading inside of a large distribution formed yesterday with clear signs of responsive buying and selling.  The break from here will give us guidance into whether either party is able to gain control in the short term.  I have highlighted your key levels to monitor for short term control on the following market profile chart:

NQ__MarketProfile_04012014
The long term auction is still buyer controlled, it is the beginning of the month and quarter, and we are priced to open inside balance and inside range.  This seems like a great day to fade early price level extremes (extensions from the opening swing) and go with and buy flow trend intraday.


Comments »

Month-End Roll Up

Index futures gapped higher Sunday evening and did little else for the remainder of the globex session as price chopped sideways and formed balance.  As we approach USA cash open, the NASDAQ is currently up about 0.50 percent.

The long term auction is still buyer controlled and we are near an area where I expect to see signs of buying.  Keep in mind however, this is only an expectation.  If instead I see heavy selling pressure throughout the week, then we may see buyer control on the long term come into question.

The intermediate term is seller controlled but showing an attempt to balance.  The selloff on Friday afternoon printed a neutral print which suggested slight indecision but an overall directional confidence from the sellers.  Now that price has reverted back to the mean overnight, it will be interesting to see if the NASDAQ futures can stabilize above Friday’s low and consolidate before moving elsewhere.  A consolidation would be a welcomed break for stock traders, perhaps even more so then a strong rally.  I have highlighted the intermediate term on the following volume profile chart:

NQ_VolumeProfile_intermediateTerm_03312014

Bear in mind today is month-end and statistically the first four days of the month favor longs which could skew the picture we see develop today and throughout the early week into a very interesting picture.

The short term auction is balanced.  After forming a large-balance distribution through Thursday’s trade, we printed a P-shaped short squeeze and a b-shaped liquidation profile.  We are now trading in the middle of these two profiles.  Let’s see which breaks and whether it sticks to see where the control is early on:


NQ__MarketProfile_03312014

Comments »

Nearing a Potential Inflection Point

We began seeing sellers abate yesterday after they gave the marketplace a solid push at the opening bell.  Their activity early in the day was dynamic enough to print a very wide initial balance, but as the day progressed we saw their control give way to balanced, two-way trade.  This type of market profile print is referred to as a Normal day although the name is misleading as these types of sessions are more an exception to the rules.  A normal day lacks any real directional conviction and often shows up near inflection points.  We can see the short term coming into balance on the following market profile chart:

NQ__MarketProfile_03282014

The intermediate term auction is seller controlled however, which leads warrants caution until balance can be achieved at the least.  I covered my hedge early yesterday into what I deemed price becoming extended to the downside.  However markets can certainly continue to press their momentum both directions.  I have highlighted the key downside levels on the following volume profile chart:

NQ_VolumeProfile_intermediateTerm_03282014

The long term auction is still buyer controlled.  It is damaged.  The trend is not as clean cut as we have seen for many months, but the pattern of higher highs and higher lows is still in place.  And we are nearing one of my favorite reference points, see below:

COMPQ_03282014

Comments »

Settling Unfinished Business

Sellers gained quite a bit of confidence yesterday.  The day started with responsive selling into the overnight strength which morphed into initiating selling for the rest of the day.  The session ended up printing a new swing low and solidified the seller control on the intermediate term timeframe.

The long term timeframe is still buyer controlled in the NASDAQ composite even through this selling.  This can be seen as a series of higher highs and lows on the weekly chart.  We are watching the market follow through this week on an outside candle print two weeks back.  The outside candle print often occurs near inflection points.

The intermediate term is seller controlled.  I had to rebuild my volume profile back to November 25th to get all the data needed for a proper composite profile representation.  I have highlighted some key levels and observations on the following intermediate term volume profile chart:

NQ_VolumeProfile_intermediateTerm_03272014

The short term auction is seller controlled.  Value is being pushed lower and prices are testing lower into areas of unfinished business (naked VPOCs).  I have highlighted the key levels I will be watching today, as well as a few scenarios on the following market profile chart:

NQ__MarketProfile_03272014

Comments »

Sellers Abate as Balance Takes Shape

NASDAQ futures are higher overnight and we are currently priced to open inside of yesterday’s range but outside of value which presents an elevated potential for big intraday moves.  The overnight profile is also interesting because it shows no real consensus on value.  Instead we have a toothy profile with buyers pushing higher.

Price traversed through the volume cave which delineates where our upper-most intermediate term balance zone exists.  We are currently trading just above it which creates the potential opportunity for an overnight gap fill more possible and rapid due to the low volume structure beneath our current pricing.  The intermediate term is seller controlled but showing signs of balancing.  Yesterday morning sellers were unable to press to new lows verses Monday.  Instead we stabilized at a low volume node just above the Monday low and reversed higher.  Sellers need to prevent acceptance of trade above 3645.75 to sustain their control of the intermediate term. The long term auction is still buyer controlled as seen on a daily chart.  I have highlighted this key price level and the volume cave below on the following volume profile chart:

NQ_VolumeProfile_intermediateTerm_03262014

The short term auction is out of balance and buyer controlled.  This can be seen as value migrating higher.  Buyers need to make a new high above 3645.75 (overnight high) to firm up their control in the short term.  I have highlighted this level and a few potential scenarios on the following market profile chart:

NQ__MarketProfile_03262014

Comments »

Day Trader Environment

The NASDAQ futures are higher overnight, drifting quietly through the globex session after buyers put together a decent bounce yesterday afternoon.  As the USA comes online, prices are currently trading just above the afternoon swing high.

The long term auction taking place in the NASDAQ composite has become an interesting picture.  On one hand, the weekly chart is very much still in buyer control.  The series of higher highs and lows is still intact.  Yet the weekly chart offers us a bit of contex that we continue to watch develop. Three weeks back it printed an outside candle and this week has the potential to confirm it to the downside.  Of course, this is very early speculation since we have only seen one trading day, but something to keep in mind nonetheless.  The daily chart suggests buyers are still in control but with a more confident seller pressing down below recent support.  We have not seen a swing low support broken since late January.  In that instance the market quickly V-shape recovered, should one expect the same outcome again?

The intermediate term auction is seller controlled.  This can be seen as a series of lower highs and lower lows.  The sellers also pressed us out of the intermediate term balanced volume profile.  There now exists a large void in volume where the lower end of balance once existed.  It would not surprise me if price were to traverse this area several times the next time we come to it before the market ultimately decides which side of the cave it wants to trade on.  I have highlighted this volume cave and some other interesting observations on the following volume profile chart:

NQ_VolumeProfile_intermediateTerm_03252014

The short term auction is buyer controlled.  We saw responsive buying yesterday afternoon which resulted in some tail prints which demonstrate strong demand.  When the NASDAQ came into the bell while forming balance and that profile print has a long tail on it also.  There exists a stronger potential for an opening drive this morning for two reasons.  First, the market is currently trading only a few points below the volume cave highlighted above (intermediate term).  Second the market profile prints are single prints like a zipper, and prices tend to run right up these.  Thus, any aggressive attempts to fade early strength are at an elevated risk of a drive.  Otherwise,  we have a solid profile structure to trade against below us.  The play would be to short into any early overbought positions and target an overnight gap fill.  If price trades inside of the prior value for an hour, find another entry onto the short side to trade through value to the VPOC and then the VAL.  I have highlighted this trade as well as a few other observations on the following market profile chart:


NQ__MarketProfile_03252014

Comments »

If Balance, Then Buying Opportunity, Else Caution

Futures are slightly up through the globex session despite my twittersphere erupting with hubris over the China PMI data that came out last night.  I never view the futures after the market closes because I do not trade during these hours and usually someone else will talk about them sufficiently.  To me, the equity index futures really only make sense when the underlying instruments they track are also trading, especially in our current environment, the “market of stocks”.

Taking to the NASDAQ, the long term picture is interesting as we can still see buyers in control of the auction.  The weekly chart printed an outside candle two weeks back which is a candlestick pattern which tends to develop near inflection points.  It is important to wait for confirmation of this type of candle before adding credence to it.

The long term auction as viewed on a daily chart of the NASDAQ composite is in buyer control.  Sellers can shift the long term into balance by sustaining trade below the lows printed two Fridays ago, March 14th.  If they are able to complete this feat, it would put the long term auction into balance.  Until then, we are still in buyer control on the long term.

The intermediate term is balanced with an edge to the sellers.  The potential exists for another revision trade back to the midpoint of the maturing intermediate term balance we have been watching which dates back to February 13th.  The VPOC of our balance still sits well above the midpoint which suggests the market has not yet accepted the lower end of intermediate term balance as fair.  Sellers gain the slight edge because of the speed with which we have seen the market trade.  This fast environment creates anxiety which can result in liquidation.  If we are to stay in balance, then the market needs to not spend too much time below 3645.75 today.  I have highlighted the key levels pertaining to the intermediate term on the following volume profile chart:

NQ_VolumeProfile_intermediateTerm_03242014

The short term auction is balanced.  After the afternoon selling Friday the market came into balance and the action carried through into the overnight session last night.  We are currently priced to open inside of Friday’s range in a thin volume area.  This may result in some fast action early on.  I have highlighted the price levels I find most interesting, as well as envisioned a few scenarios on the following market profile chart:

NQ__MarketProfile_03242014

Comments »

Building Energy

The NASDAQ drifted higher overnight and price is currently trading outside of yesterday’s range.  In terms of potential for a wide range/volatile day, this is as elevated a condition as the market can offer.  Today is also option expiration which can really result in some unique auction activity.  However it is ultimately order flow that dictates the direction of the market inside the day timeframe and we should be keen in our observance of it.

The long term auction continues to show buyer control.  We tested recent lows last Friday and gapped when we came back to market Monday morning.  We have held that gap higher all week.  We need to keep this gap in mind because often these gaps get filled, settling unfinished business if you will, before the market continues elsewhere.  Overall though, the market continues to find a bid on the long term timeframe and continues to auction higher.

The intermediate timeframe is balancing.  Tuesday buyers were able to quell the price action which up unto Tuesday suggested sellers were in control of the intermediate term auction.  After we trended higher Tuesday, we saw the late-afternoon selloff Wednesday (Yellen) which was met almost immediately with a strong buying response.   This can be seen as long tails on the candles suggesting dynamic responsive buying.  Since then we have consolidated and coiled right in the middle of intermediate term balance.  The market is building energy for its next move with a very clean auction into value.  I have highlighted our current balance and a few other observations on the following volume profile composite:
NQ_VolumeProfile_intermediateTerm_03212014

The short term auction is buyer controlled.  This can be seen as value drifting higher over the last few market profile distributions.  The overnight action in particular shows buyer control as it presses value up into the top of Tuesday’s action which marked the high point thus far on the week.  The key for buyers is to press above 3711 and gain acceptance above the level.  That could be the progress needed to invigorate initiating buys in the afternoon.  Otherwise we may see more backing and filling as intermediate term players continue to slug it out.  I have highlighted a few key price levels and observations on the following market profile chart:

NQ__MarketProfile_03212014

Comments »

The Discovery Process

Yesterday we saw the effects of overhead supply and how sometimes the weight of said supply becomes too great and liquidation ensues.  Many a market commenter will cite the Fed meeting as the reason for the move, but an understanding of the auction and balancing process yields the potential directional bias of the market.  An event such as the Fed simply accelerates the process of price discovery.

The long term auction continues being controlled by the buyer.  This can be seen clearly on a weekly chart of the NASDAQ Composite index which shows a pattern of higher highs and higher lows dating back to October 2011.  The daily chart suggests a similar buyer control with prices continuing to hold their recent low around 4200.

The intermediate term auction is in balance.  When we sold off yesterday afternoon, the market was able to find a higher low.  Responsive buying down inside Monday’s range was forceful enough to reverse the directional liquidation occurring.  Price eventually settled near where we hypothesized value to be yesterday morning, 3678.25.  I have highlighted the inflection points which resulted in the market coming into balance, as well as a few key action price points on the following volume profile composite:

NQ_VolumeProfile_intermediateTerm_03202014

The short term auction is in balance.  I have traced the movement of value since Monday and you can see it drifting and consolidating much like a sine wave with increasing frequency.  Sticking with Monday, 3/17, we left behind a naked VPOC at 3644.50.  This level may be targeted by sellers today should we see any follow through by them.  Overall my expectation is for the market to chop about and settle a bit early on before deciding on a direction.  I have highlighted a few levels I will be watching today as well as a few scenarios on the following market profile chart:
NQ__MarketProfile_03202014

Comments »