iBankCoin
Home / Market Profile (page 152)

Market Profile

Examining Overhead Supply

The index markets continued lower overnight, extending the move made yesterday afternoon.  The question now is whether the news driven selling from yesterday has created more overhead supply then can be handled.  This would result in value migrating lower and washing out last week’s progress.

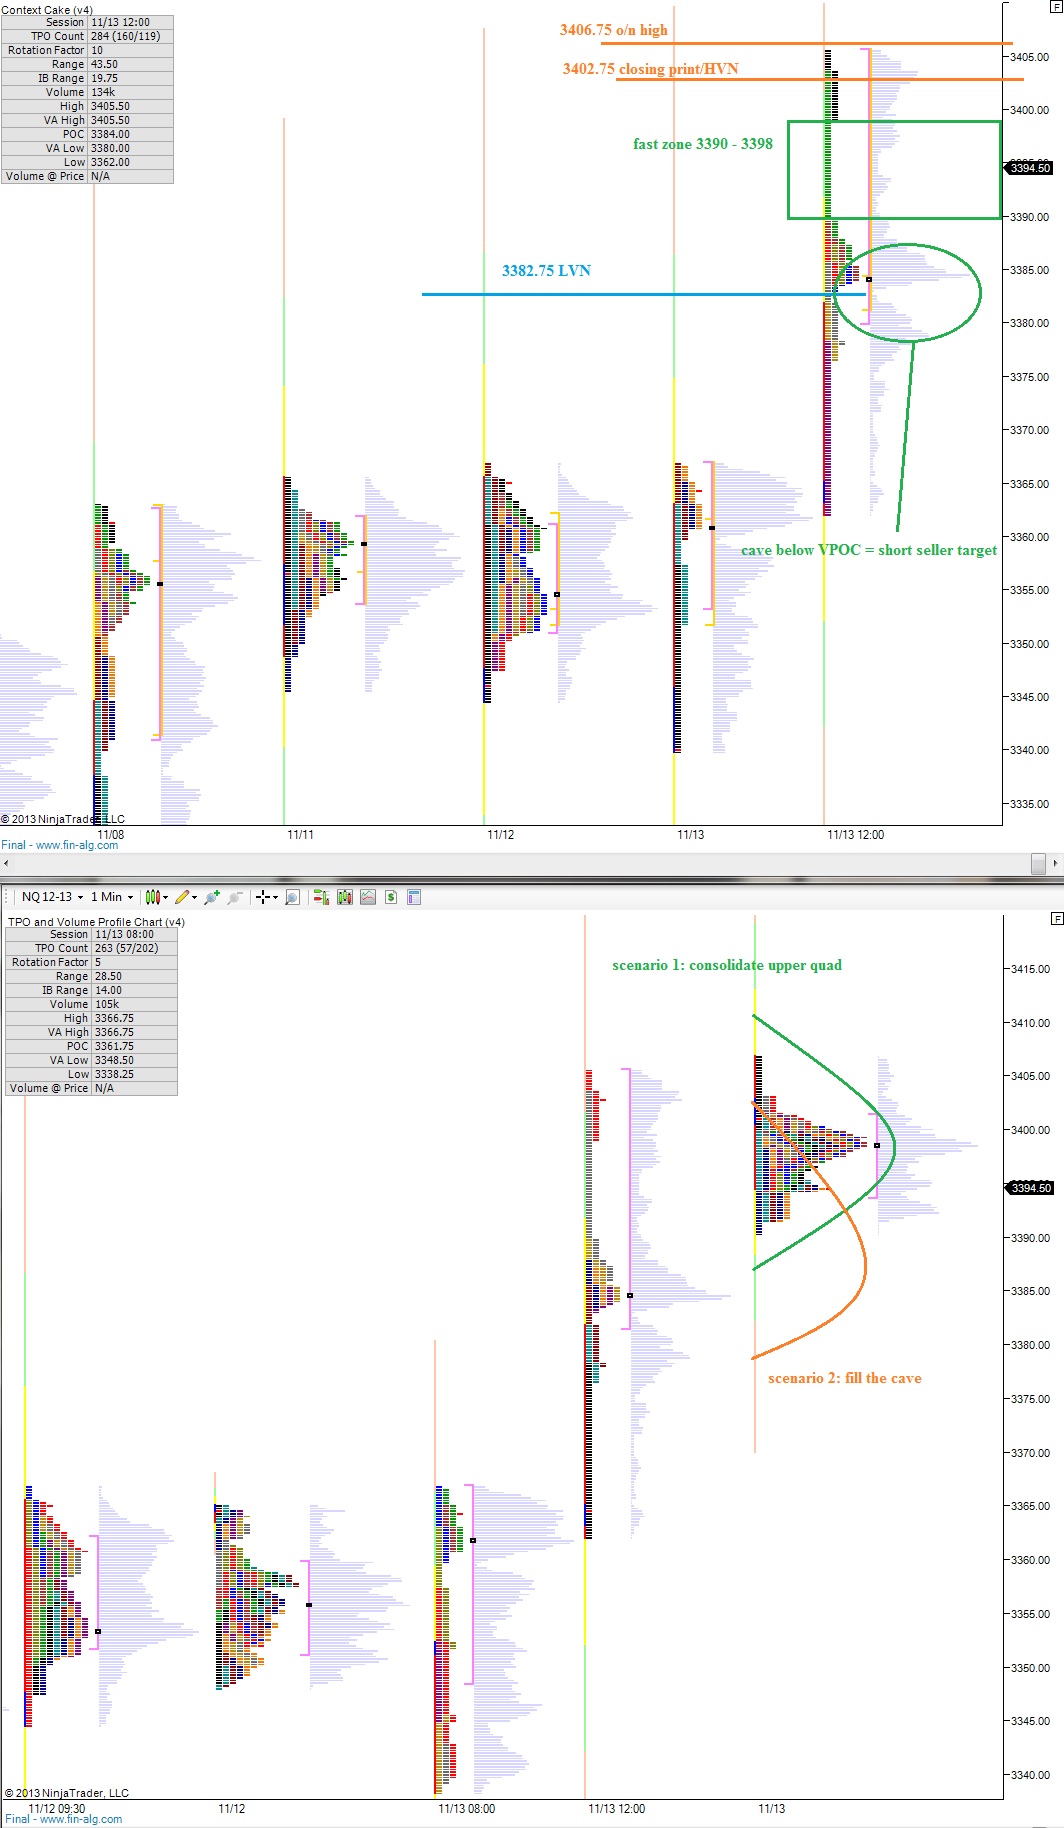
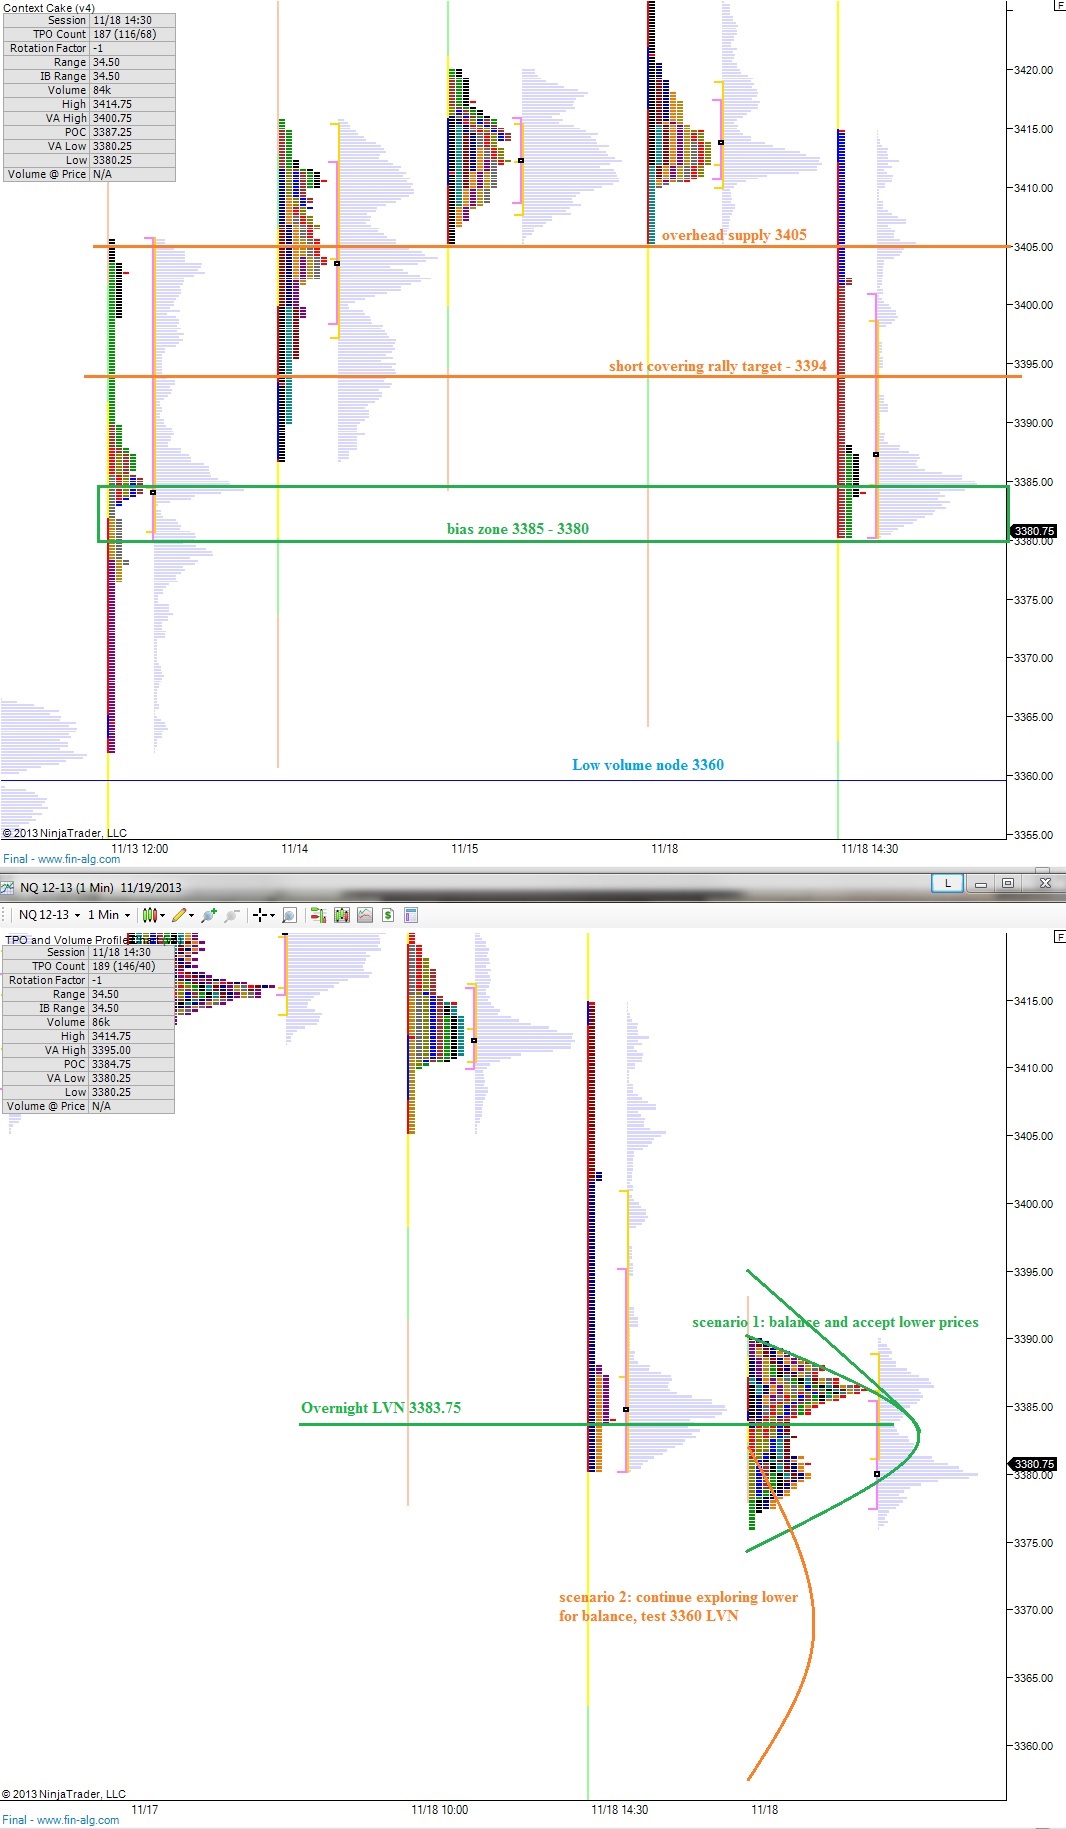
Should a short-covering type rally occur today, I would expect it to run up to about 3394 on the NASDAQ futures.  If the action is able to sustain trade above 3394, the expectation is for buyers to target 3405 where I suspect we will see the effects of overhead supply from the Friday-to-Monday action.

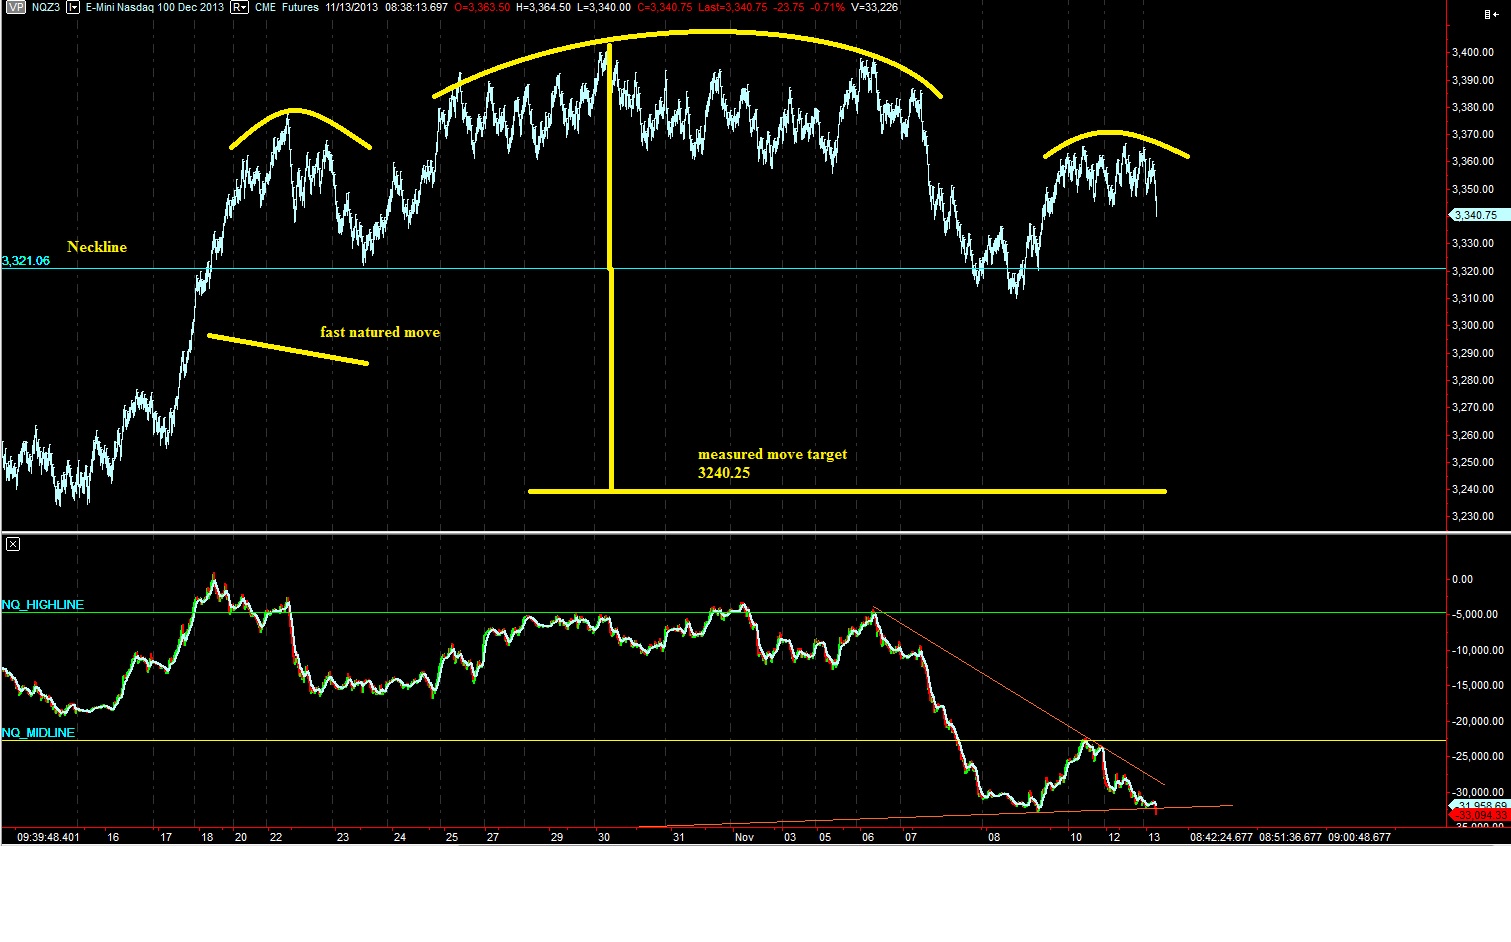
Price is slippery below due to the thin profile structure we are working inside of.  It would not surprise me to see trade back down to last Wednesday morning’s trade, before the surge in prices.  Should this occur, I will be using the low volume node at 3360 as support to lean on.  Should we see price accepted below this level it would suggest a major sentiment shift away from all of last week’s action.

Our early clue to whether bulls can reassert intermediate term trend force will be the overnight low volume node at 3383.75.  Sellers hold the short term and overnight trend control.  Stay tuned to the midday report for insight into day control.

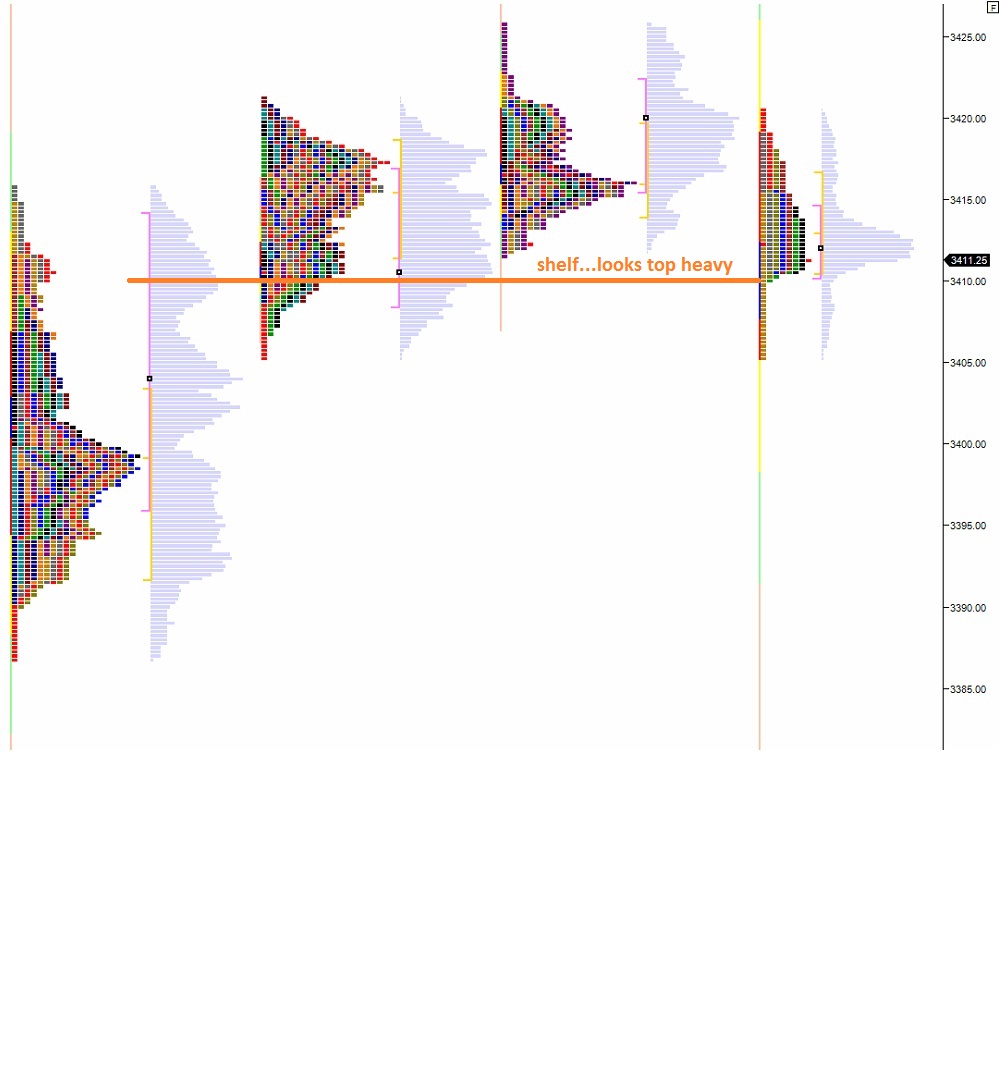
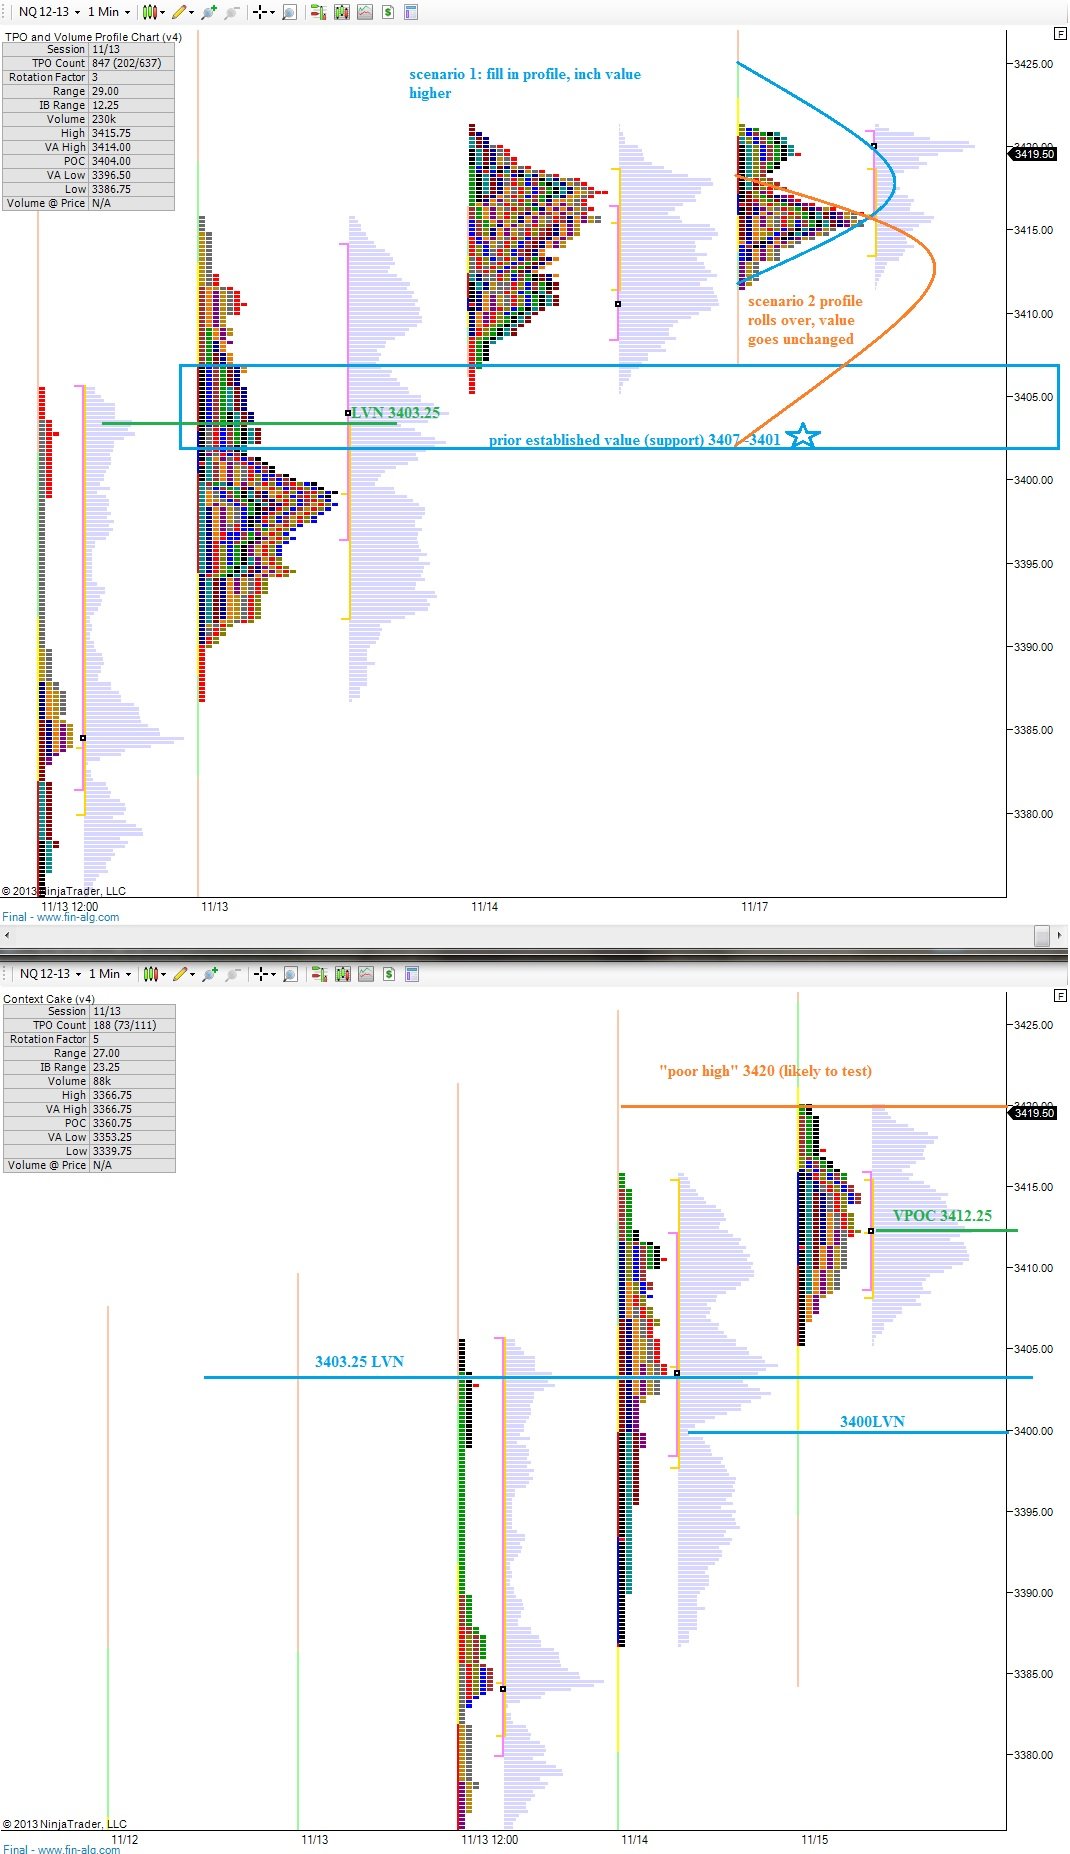
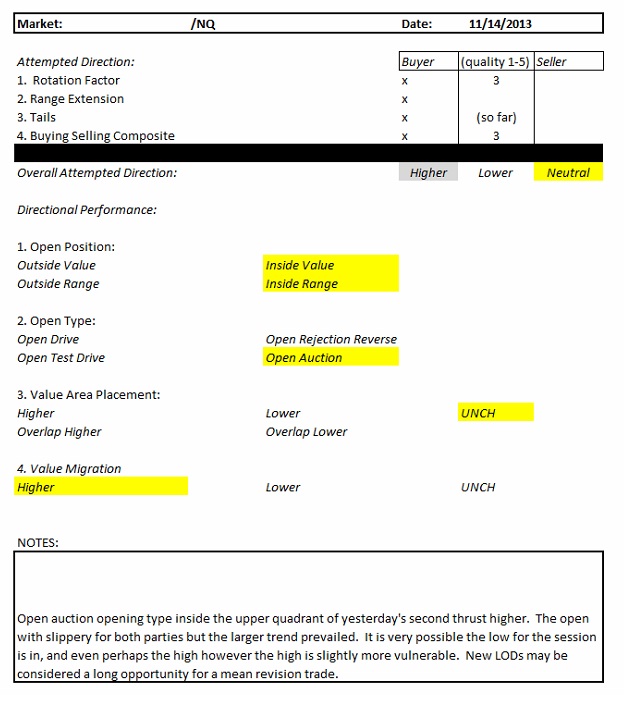
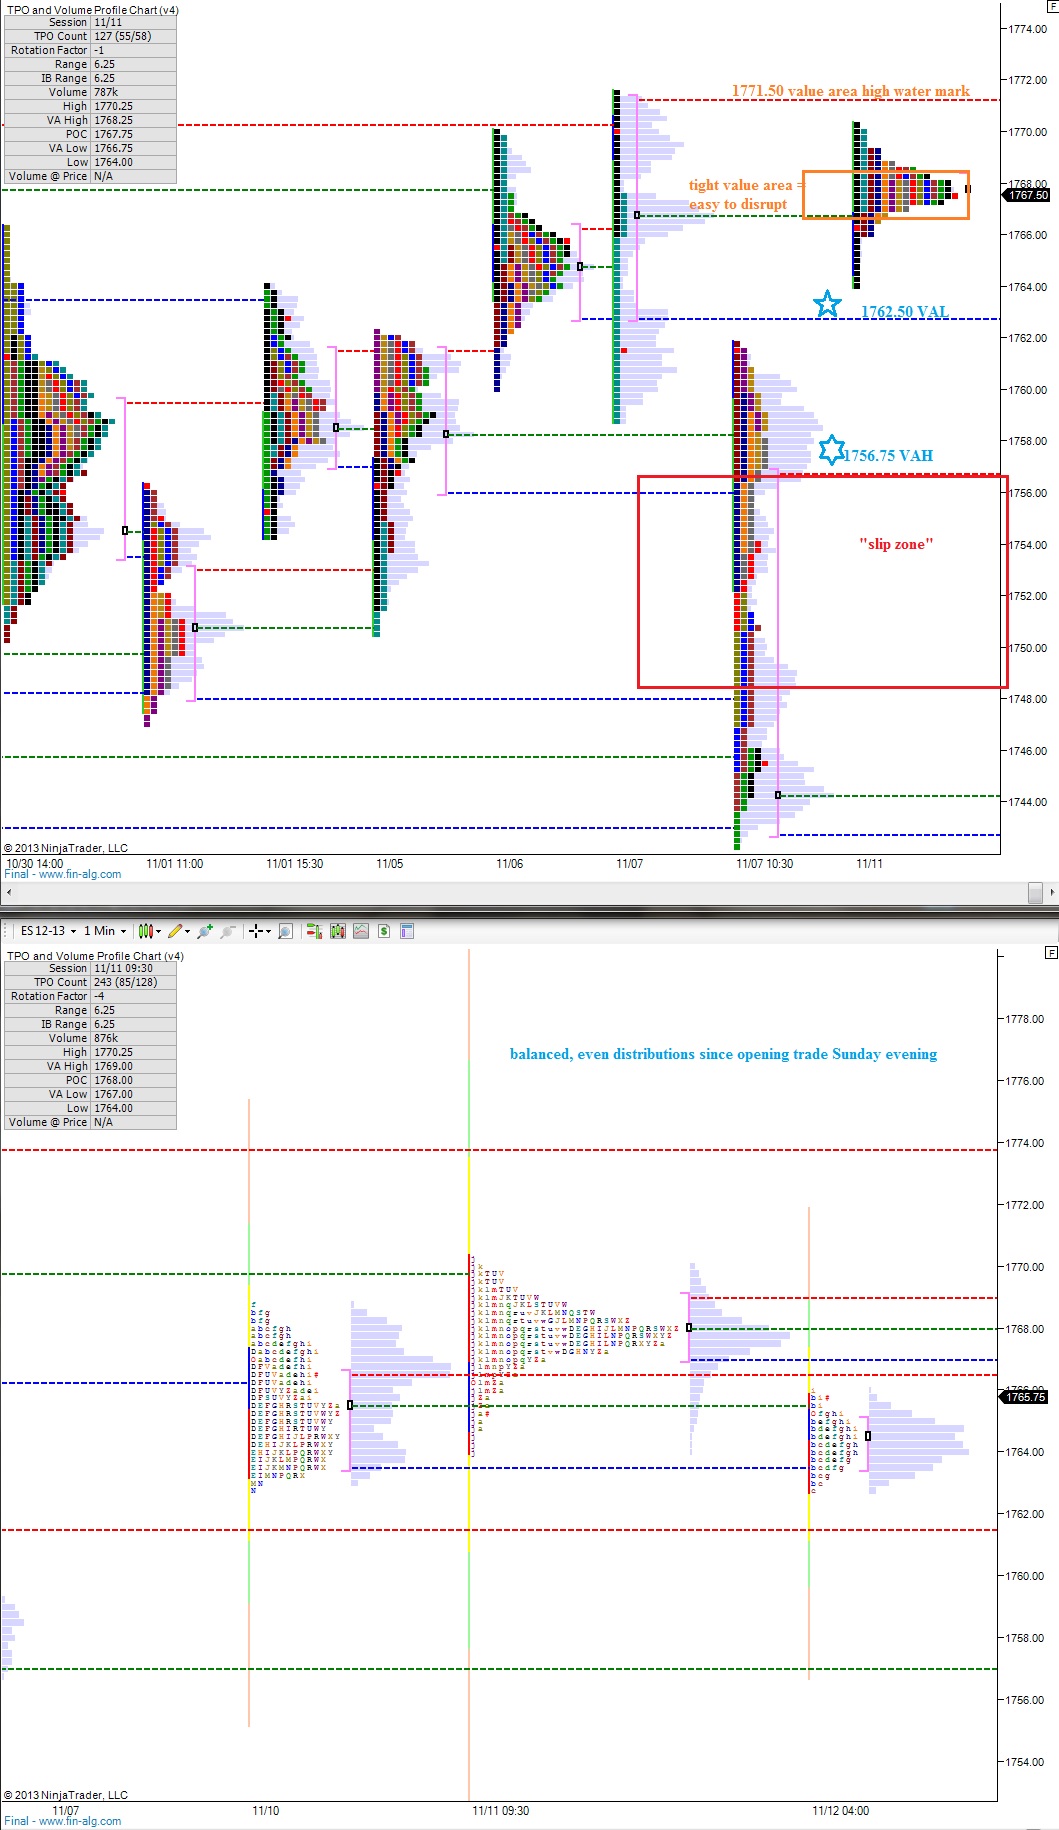
I have highlighted these levels, as well as a few scenarios on the following market profile charts:

NQ_MarketProfile_11192013


Comments »

Keeping The Balance

Overnight was fairly quiet in the Composite futures where the main feature was a rotation higher in the early hours, around 4 am.  The pulse higher was effective in erasing a slow and balanced drift lower, but it also put the market into overbought territory on the very short term.  Early on, perhaps even premarket, my expectation is for sellers to work price lower a bit before we see an attempt at another rotation higher.

I have envisioned two scenarios for today, both which expect value to be built upon our existing and fragmented profile structure.  Should we press beyond these envisioned profiles and accept price beyond their range that would be an early cue this week that sentiment has shifted.

You can see my vision along with levels to monitor on the following market profile charts:

NQ_MarketProfile_11182013

Comments »

Friday Cues

The overnight markets caught a rotation higher and are currently showing balanced trade.  I have highlighted what I consider likely scenarios for today’s session in the NASDAQ on the right-hand market profile chart below.

I use the 24 hour profile to envision trade and get an idea of the overall structure of the markets.  With electronic trading occurring nearly 24 hours per day, it makes sense to capture this data and give it weight.

On the left-hand chart I highlight key price levels and zones where an event occurred during regular trading hours.  These events are caused by other time frame (OTF)  traders who enter the market.  The other time frame is not operating on a day-trade time frame, but instead a longer term.  Should their actions be negated by an opposing other time frame, it would suggest sentiment has shifted.

I have primarily highlighted the work accomplished by OTF buyers on today’s market profile and will monitor these levels/zones throughout the session to determine how the market is feeling into the weekend.

NQ_MarketProfile_11152013

Comments »

Exploring Temporary Phenomena

Yesterday’s profile was interesting to watch develop because if one had not clearly identified the opening drive-type action from the buyers, they may have hypothesized the action was only a temporary phenomenon known as a short squeeze.  Value was slowly migrating lower all week and we came into the morning with a sharp gap lower which suggested something overnight had changed the market’s dynamic.  When the second leg higher erupted at high noon, it signaled a fresh batch of initiating buyers had stepped in and put fresh money to work.

In short, a squeeze may have been the spark, but an authentic accumulation occurred throughout the rest of the day.

Trend days are considered risk-free entry point in Market Profile theory which suggests that buying any time during a trend day will allow you to exit at higher prices, eventually.  The “eventually” is one of the greatest qualities of market profile I have come to learn.  They are not a very effective timing tool.  Instead, they are fantastic for framing a day, estimating range, and locating key event points in the tape.  Timing is best achieved with the bar charts.

I’m going to keep our attention on the /NQ because I am actively trading it and most of my stocks are nestled in its electronic bosoms.

Weakness crept into the overnight session, whether it was profit taking or short sellers is not material, it was sell flow.  The action was able to recapture the upper quadrant of the second leg higher in the index, which is the area I envision us spending our day.  Best case scenario for the longs is a consolidation along the upper quadrant of the trend distribution.

Should the selling pick up and press us below 3382.75, this would suggest a significant sentiment shift, and would merit caution before initiating any new long exposure.

I have highlighted this level, as well as drawn out a few scenarios on the following market profile charts:

NQ_MarketProfile_11142013

Comments »

Turning Our Attention To The Head

Two big rotations lower overnight have taken prices much lower in both the NASDAQ composite and the S&P futures.  Today’s market profile analysis will focus on the /NQ, the electronic mini futures contract which tracks the NASDAQ composite.

The reason for turning focus away from the S&P is because I perceive the current structure of the NASDAQ important here.

First, observe the following bar chart, dating back to 10/16, we are close to printing a head and shoulders topping pattern.  Price is in the top window pane:

NQ_1113_HnS

Trade has been bracketed since opening Sunday evening and we should monitor the bracket extremes to determine if the market is coming out of balance.  Much like the behavior at the edge of a low volume cave, price can penetrate a bracket extreme without breaking the level.

Looking at the overnight action, we can clearly see sellers establishing control overnight which has pressed us out of yesterday’s value area and range.  This tells us something overnight changed the perception of the market.  The risk today is elevated, as is the reward on an intraday basis.

It will be important to monitor the open type.  Early on my expectation is for buyers to react to these lower prices.  However, we are in “pro gap” territory currently, with price on the S&P trading 10 handles away from yesterday’s close.  This makes filling the gap a more challenging endeavor, one where someone certainly should not just buy the opening print and wait for the gap to fill.

I have highlighted the support levels I will be keying off of today in the NASDAQ as well as a envisioned a few scenarios on the following market profile charts:

NQ_MarketProfile_11132013

Comments »

Open Outside of Value

The indices experienced some selling early the morning and quickly reached oversold levels which are now in the process of working off as the United States wakes up.

Since our Sunday globex open, the S&P futures have been trading mostly flat in a very balanced and evenly distributed manner.  This makes it difficult to envision any specific scenarios for today because all of the distributions are complete.  Therefore we must focus our attention on the bracket extremes to gauge whether the market is coming out of balance and by which parties hand.

We are currently prices to open outside of yesterday’s value, but still within yesterday’s range.  If the sellers can reject our value area from yesterday, we may see acceptance lower which would suggest a change in conditions from this current bull brigade, a subtle shift we should be aware of should it occur.

I have highlighted key price levels on the following market profile charts as well as displayed the very balanced trade occurring on a 24 hour profile view:

ES_MarketProfile_11122013

Comments »

/ES Levels to Watch

The futures opened for trade Sunday evening mostly flat, and spent the overnight session basing sideways in a balanced manner.  The /NQ, our futures contract for tracking the NASDAQ, is currently trading 2 point below Friday’s close of 3361.25.

The sharp rally on Friday was effective at moving price higher and closing near the height of the session, but value failed to migrate to the uppermost distribution on the day.  Instead our VPOC printed at 1756.25, almost 10 handles below the closing print.  Early on this week, it will be interesting to see how this relationship plays out and whether price migrates back to value or conversely value migrates higher.

A key level to monitor while determining whether price will revert back to value is the low volume node at 1757.75.  Low volume nodes represent moments where prices moved rapidly and little volume was traded at a given price.  It suggests strong conviction transactions occurring by a longer-term timeframe trader.  If price were to cut through the low volume mode and then spend time trading below the level, it would suggest a sentiment shift.

Traders will be keenly observing the low price level on the S&P this week as we attempt to determine whether the market is in fact setting up for a performance chase into year end.  If we cannot hold the lows, we may roll over into year end.

1750 is another key level of support  to watch if the market begins heading lower and is one of the last defensive lines for the buyers.

I have highlighted the above price levels as well as two important resistance points on the following volume profile chart:


ES_MarketProfile_11112013

Comments »