Two big rotations lower overnight have taken prices much lower in both the NASDAQ composite and the S&P futures. Today’s market profile analysis will focus on the /NQ, the electronic mini futures contract which tracks the NASDAQ composite.
The reason for turning focus away from the S&P is because I perceive the current structure of the NASDAQ important here.
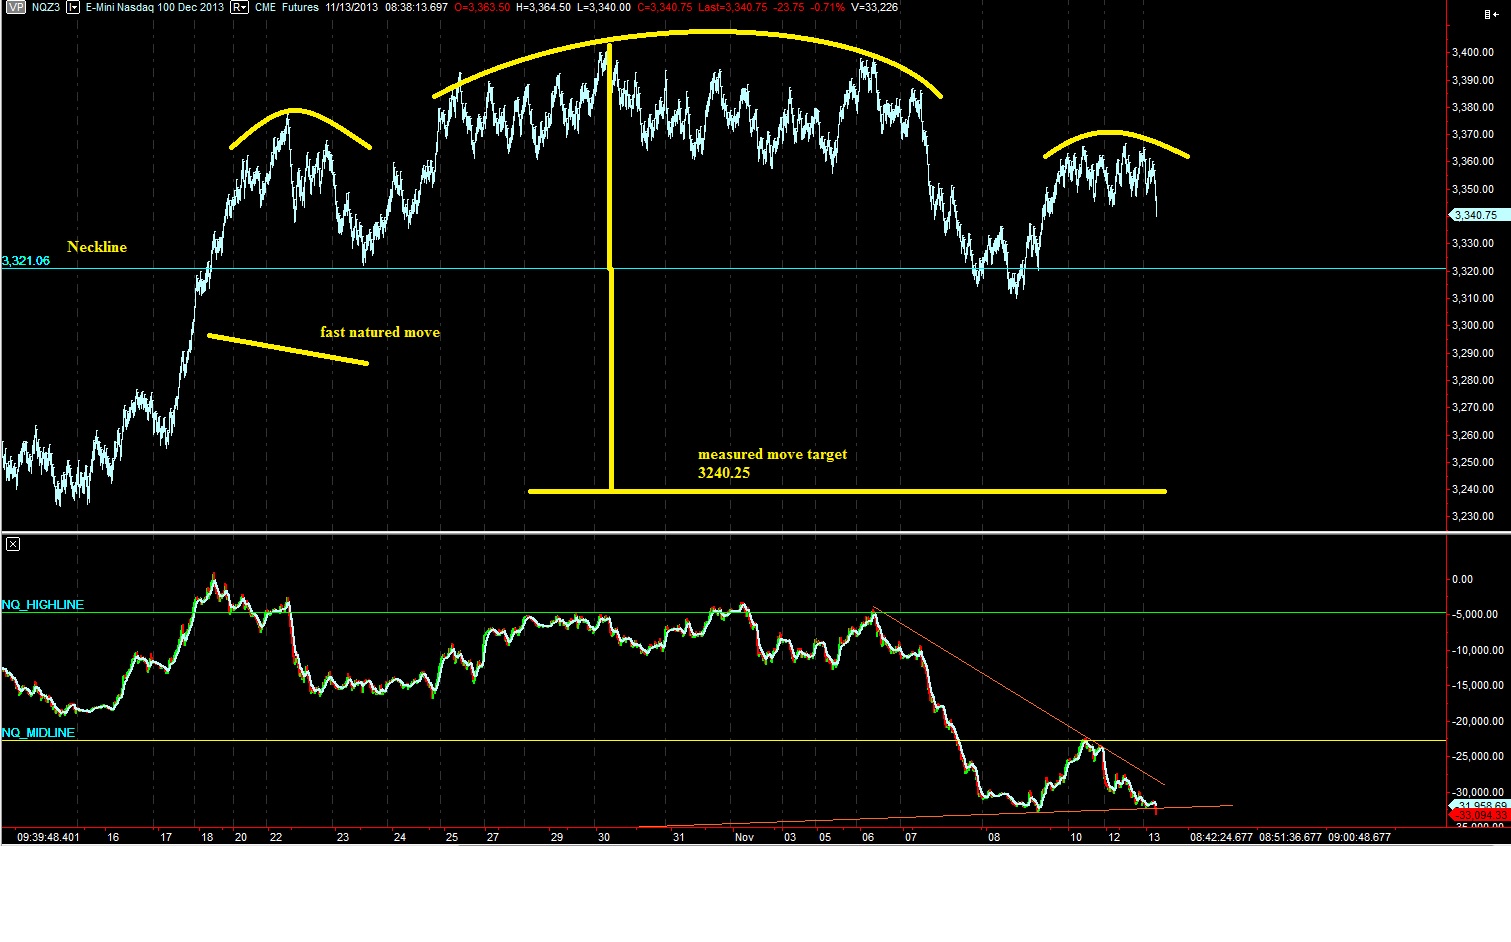
First, observe the following bar chart, dating back to 10/16, we are close to printing a head and shoulders topping pattern. Price is in the top window pane:
Trade has been bracketed since opening Sunday evening and we should monitor the bracket extremes to determine if the market is coming out of balance. Much like the behavior at the edge of a low volume cave, price can penetrate a bracket extreme without breaking the level.
Looking at the overnight action, we can clearly see sellers establishing control overnight which has pressed us out of yesterday’s value area and range. This tells us something overnight changed the perception of the market. The risk today is elevated, as is the reward on an intraday basis.
It will be important to monitor the open type. Early on my expectation is for buyers to react to these lower prices. However, we are in “pro gap” territory currently, with price on the S&P trading 10 handles away from yesterday’s close. This makes filling the gap a more challenging endeavor, one where someone certainly should not just buy the opening print and wait for the gap to fill.
I have highlighted the support levels I will be keying off of today in the NASDAQ as well as a envisioned a few scenarios on the following market profile charts:


Sorry if this is obvious but what is in the bottom of the head and shoulders chart?
Not obvious at all, that is an order flow metric that measures and averages cumulative volume delta. There are aggressive sellers at work. They got put in the squeezer this morning, but haven’t lost the intermediate term structure of this chart yet