Fri Nov 29, 2013 8:26am ESTComments Off on Watch This Deal Fly Off The Shelf
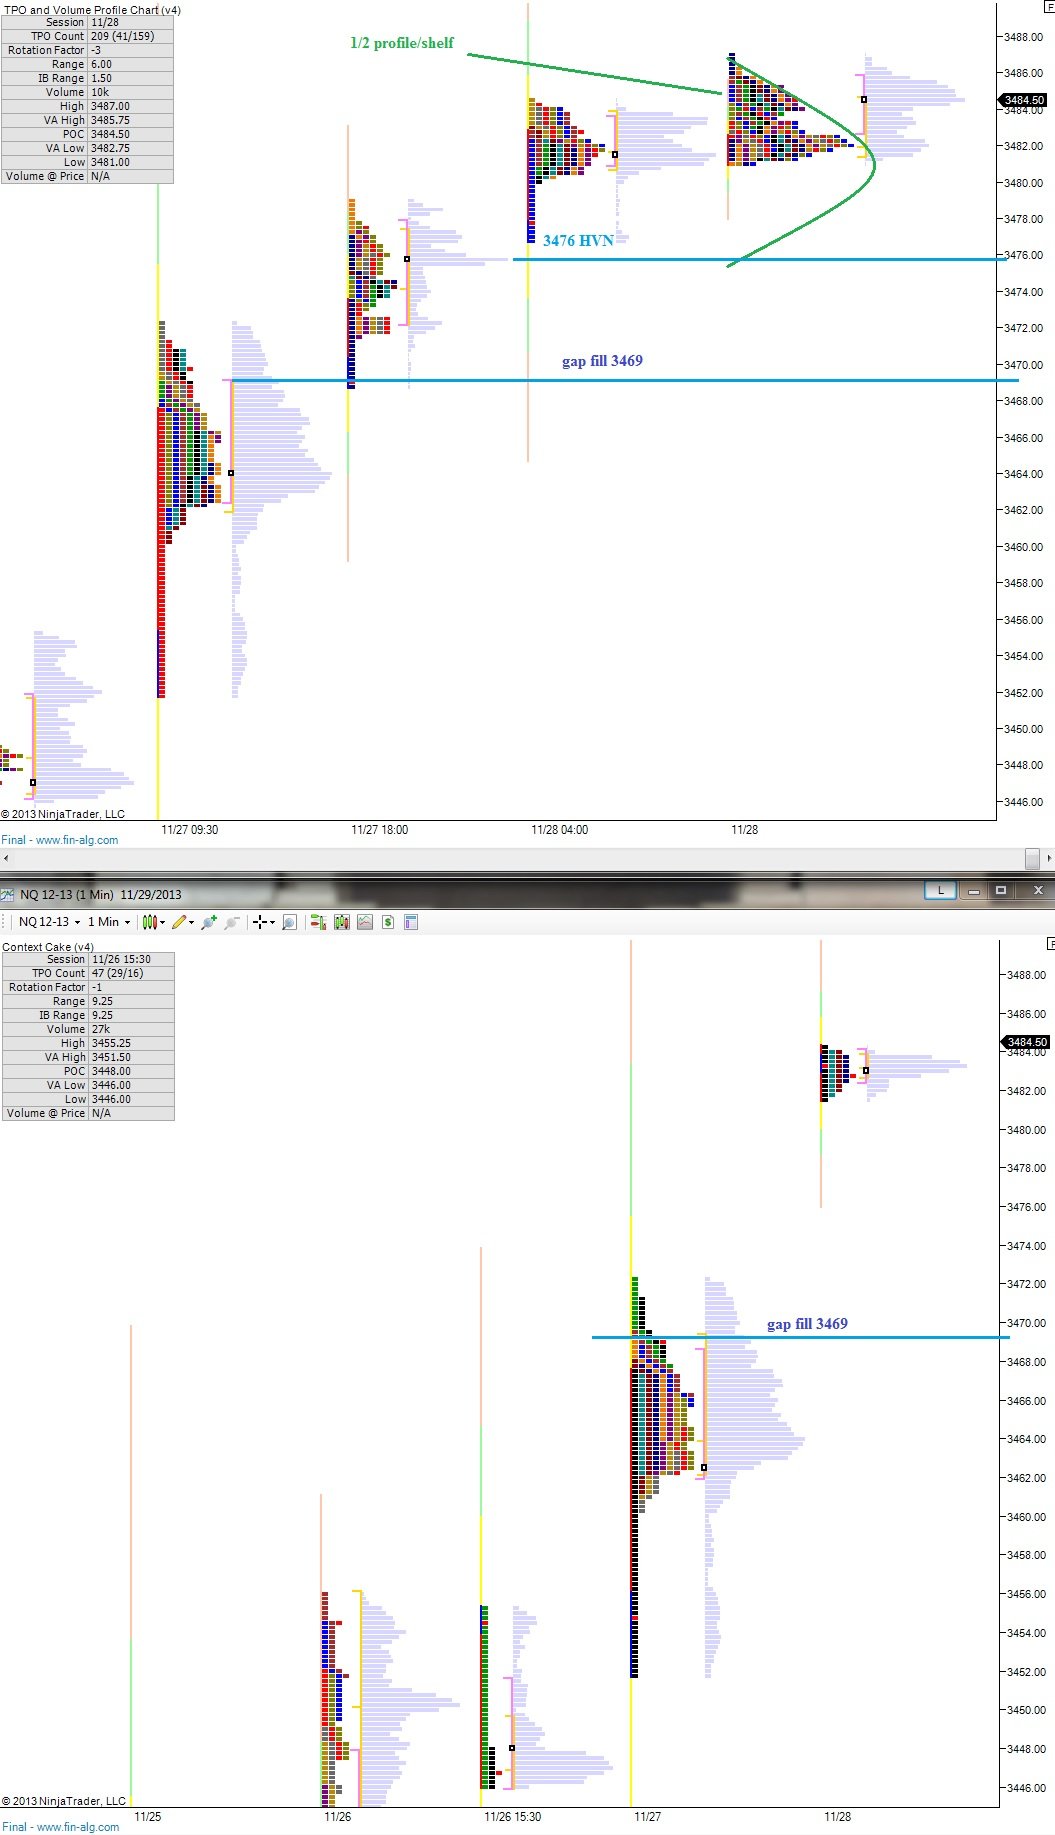
There was a strong appetite for risk over the holiday trade, which saw prices of the NASDAQ outpacing the performance of the S&P. The action slowed a bit over these last 8-10 hours and the resulting profile print has a very familiar, uncompleted, shelf footprint.
By vision for today is a completing of the profile via some back-and-fill trade. However, we are set to gap much higher, which signals the market is well out of balance. If we fail to hold around the high volume node at 3476 it may signal a rejection of the holiday move by the market. If this is the case, we may see a swift gap fill back down to 3469.
Conversely, the shelf at 3476 may not breach in which case price will continue to probe higher in search for sellers.
The shelf is an interesting bit of context to bring into today’s trade. Even the casual observer, hunting black Friday deals can use the price action around the 3481 shelf zone to measure sentiment.
I have highlighted this activity on the following market profile charts:
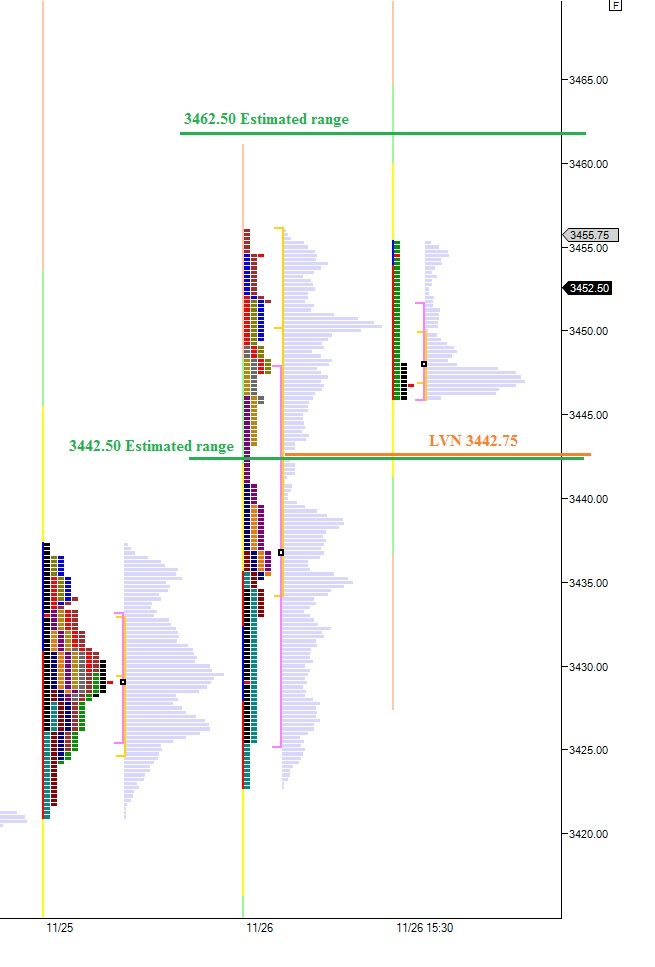
There was a bit of chatter afterhours about the spike lower on the indices shortly before the closing bell. As we drift into a holiday, many will likely dismiss the action and continue preparing a warm home for their families. However, the spike is a useful bit of context, and we can use it to frame some expectations for the day.
The spike lacked time. The selling began so late in the day there was no time for us to gauge the momentum of the sellers. Coming into RTH, we are set to open within the range of the spike on both the S&P and the NASDAQ and our analysis will focus on the Nazzy.
An opening within the spike indicates the market is balancing. The other two scenarios are an open outside the range of the spike either lower or higher. An open above the spike range indicates a complete rejection of the move and invalidates it entirely. An opening below the spike indicates the market accepted the move and is still out of balance and we are likely to continue exploring lower until we reach balance.
Returning to our situation, opening within the spike, our expectation is for two-way trade to ensue as the market balances out. We can use the range of the spike to estimate today’s daily range. This will be incredibly important on a light holiday session where less is certainly more. If we get a solid idea that one range extreme will hold, we have a target in mind for the auction.
I have used the spike to envision a scenario on the following market profile chart. Remember not to lose sight of the big picture, where bulls have rallied strong all year long and we are heading into the weekend already, ahead of mutual fund Monday.
We’ve had good fun poking the stupidity of Morgan Stanley in their downgrade of AMBA this month. We banked some nice coin along the way. The recent leg up in our aging index rally has been mostly to the benefit of old men and their mega cap stocks. The snoozers, if you will. We participated where appropriate, riding LO and PPC, but to be honest I could have held less crack rock and more bourbon and cigars, the preferred vice of old men.
But today we saw the speculative juices begin to sizzle. Today we had WUBA pulling out the tits, Emily Ratajkowski style. Today was for the brazen and the bold, with social media saying, “not.just.yet my friend.” So my portfolio finally caught a decent boost.
I think there is more in store and I implore iBankCoin readers to get in line at the feeders: names like GRPN, Z, FB, TWTR, and TRIP. Pay special attention to TRIP as it appears poised to rip.
I am 95% long and low on cash. I had to sell PPC today to buy Zillow. I have so much money tied up in LEDs right now and they are not doing a thing, except for bleeding me modestly. This industry is ice cold, yet I love it. What is an intermediate term speculator to do?
We caught the Apple breakout yesterday via 12631 service.
Top picks into the turkey: GOGO, YELP, and Z.
I have huge positions in CREE and BALT, yet I do not mention them as top picks. Hmm…they need to DO SOMETHING.
We hear the word correction often in the stock market, and as prices become elevated we here more participants expressing their reluctance to increase exposure before a correction occurs. It is important to keep in mind however that corrections are not only price going down.
There are time corrections. These are the juicy consolidation patterns we often hunt. We see price basing out of several periods and we get an established zone to trade within. We experienced a rare form of correction yesterday when the market profile printed a normal day.
Although the NASDAQ traded higher than last week’s closing prices, when you peer into the structure of the day session you can see the correction taking place. We had a large gap higher to start the week, and when the RTH bell rang we saw a long initial balance form when reactive sellers began taking profits. The first hour of trade was dynamic selling. This was a form of correction. We did not reenter yesterday’s value, though. Instead, fresh initiating buys came in and back-and-forth auction ensued.
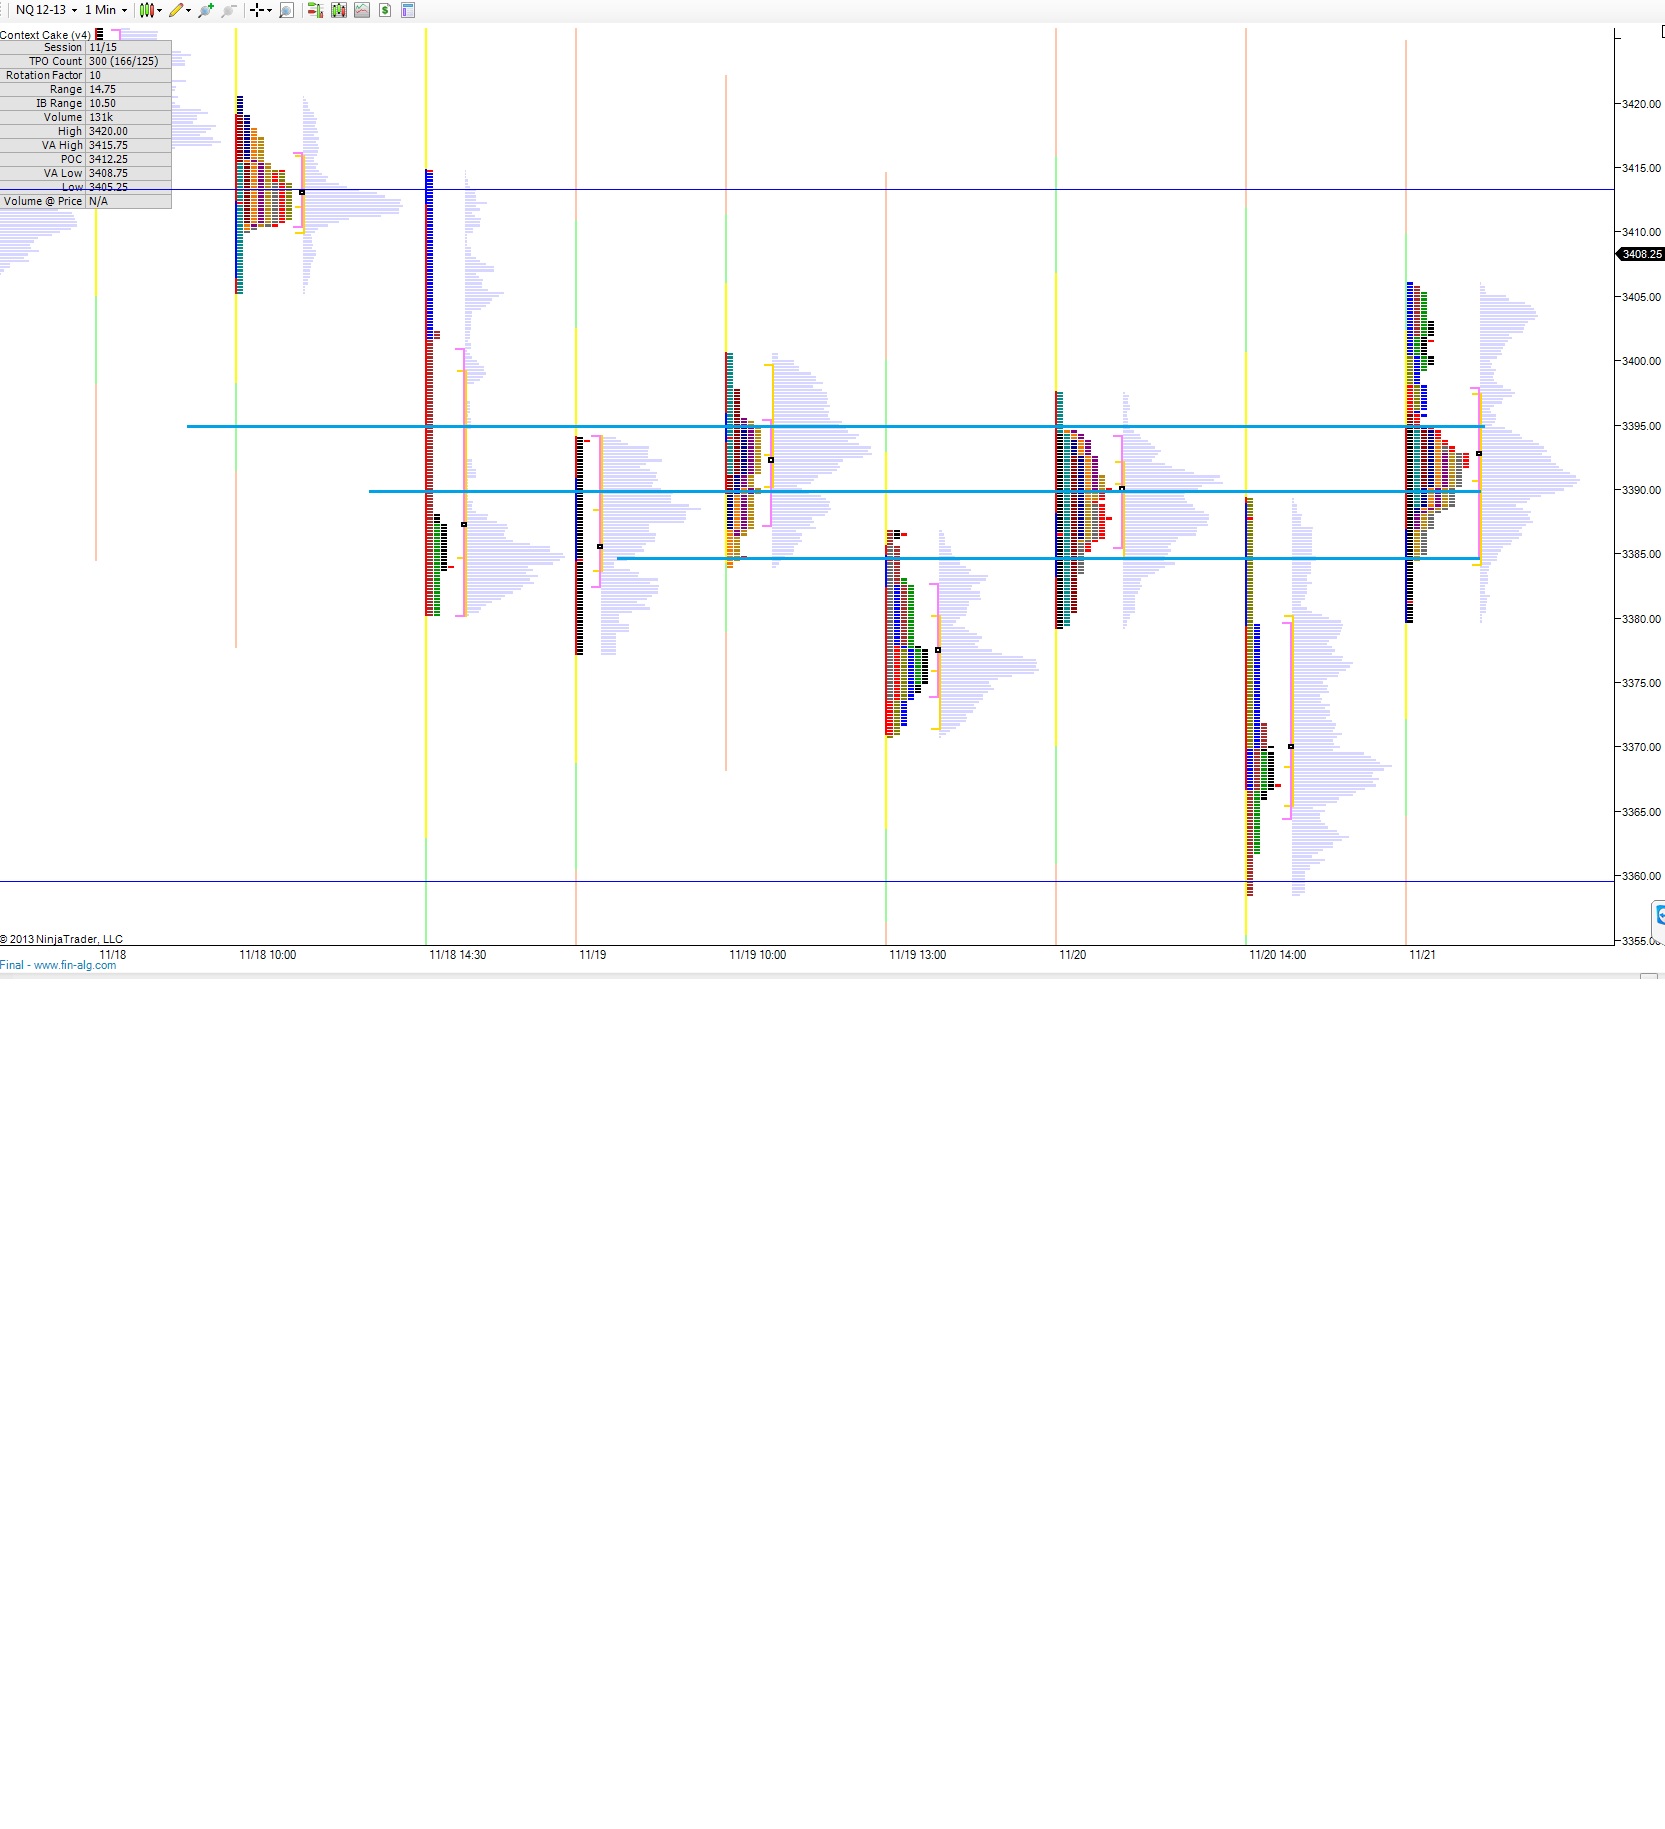
Overnight the back-and-forth continued and on the bar chart we can see the familiar consolidation pattern we know and love occurring since trade opened Sunday. We are correcting, even though the prices on the teevee may suggest otherwise. It is important to monitor the consolidation, and which party can successfully drive price away from it. You can see the pattern here:
I have split open the RTH profile on the following chart to more easily display the normal day and I have also listed key price levels:
It turns out the NASDAQ printed what is called a normal day in market profile theory and the fun thing about normal days is they are anything but. In fact, they are rather rare.
And I must say I do not particularly like normal days, at least not up here at swing highs, because they tend to occur at or near inflection points. A normal day is described as having a very wide initial balance (first hour of trade) which is not breached for the remainder of the session. It suggests indecision, intraday, mostly signaling directional conviction is low.
That context makes sense if think about gapping higher, in a hot (too hot?) bull trend, into a short holiday week. Short sellers do not want to get steamrolled in the thin trade, buyers are hesitant to initiate additional exposure at these elevated levels, and current longs are likely mulling taking profits.
Add to that the narrow pockets of market momentum and you have a solid recipe for indecision.
I have my book about 90% long at this indecisive juncture. AMBA finally went to work, crushing the hopes and dreams of Morgan Stanley analysis hoping to make a name in the technology space. I like to think this guy who downgraded AMBA will read the Raul blog, so I have a special message for him: this chipset powers the GoPro, it is on the X-mas list of every adventurer. Short interest, albeit modest, will start to get icy hands as we approach December 5th earnings. Then they will start making mistakes.
The chicken trade adhered to the November seasonality statistics, naturally, unlike the unnatural meat produced in PPCs new streamlined robot facilities. December brings a tad bit more seasonality mojo, and we still have national eat 1-to-3-birds-at-once day Thursday. I took an obligatory 1/3 scale today, but I like my prospects with the net.
I bought AAPL back right near the closing bell. If you recall, I was in this trade a few weeks back and bailed with a little 2 percent gain. It is an easy vehicle for me to lever long exposure up and down, as it consolidates along gently.
I now hold large positions in the following names, listed largest-to-smallest:
GOGO, RVLT, BALT, YELP, and CREE
These are all full size positions. As you may imagine, this type of book requires attentiveness. It has the capability of lopping 10% off my person rather effortlessly.
My ¾ size positions are as follows, listed again largest-to-smallest:
AMBA, AAPL, PPC, LO, and TSLA
Note: AMBA was by far my largest position prior to taking a scale near today’s high. Tesla and their innovative CEO Elon Musk are in the house of pain. Much like any successful individual, the media will frame Elon with a skeptical eye. Innovators hunt profit and self-gain after all, which is inherently evil. The issue most closely watched at TSLA is the battery technology. If it is to usher in the era of zero emission commuting, it needs to hold up to rigorous scrutiny. If Telsa intends to roll out a model for the middle class, they need sound battery technology established. The chart is just basing out, below my favorite moving averages, suggesting acceptance of these lower prices. What likely comes next is a new exploration lower by price. This will scare most of you. But I will be casually observing the action, minding the drawdown to my books, and meticulously selecting an opportunity to ratchet up exposure because I love me some sweet baby Elon.
I have dog and pony positions in the following stocks. These positions are practically placeholders and some are relics from prior trades:
F, FXY, ONVO, TWTR, MJNA, and O
I thought I would turn a clever trick in MJNA. Now I am -40% on this stupid, STUPID, holding. It will enjoy a fake pump service or go to zero otherwise I will continue to hold this dumbness.
ONVO needs to die for a while. It trades poorly. I will keep my toe in the water to keep my eyes on the name.
TWTR is another name I will hold until zero. I use twitter more than any other social media service in the world, why wouldn’t I own it? One day I will have huge size, but right now there simply is not much to base my risk on. Therefore I wait.
This post has gone on far too long. These are my holdings and some reasoning behind them. Let’s see how they perform this week.
Last week’s momentum carried over into last night’s globex session where we saw the indices continuing to rise. The push higher occurred mostly during the first hour of trade Sunday evening, after which we balanced out and accepted the prices.
I find myself stating this bit of context often although it is by no means an effective timing tool but, index markets rarely print swing high outside of regular trading hours. Thus we can assume the overnight high is vulnerable.
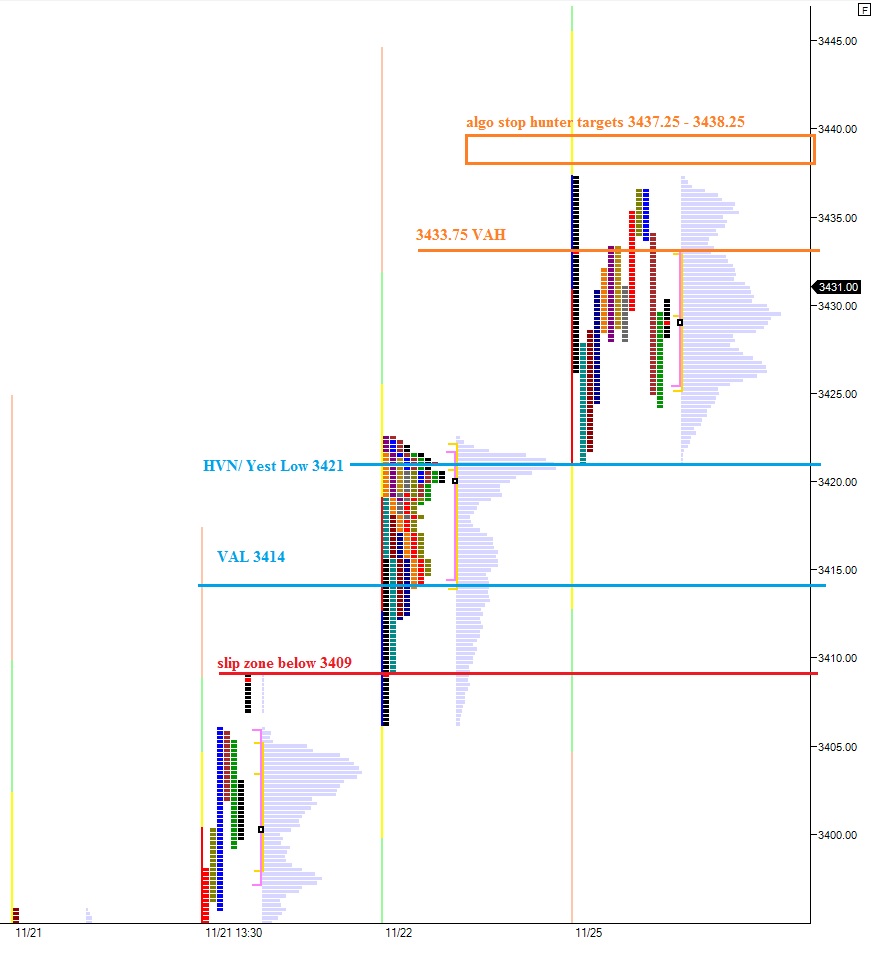
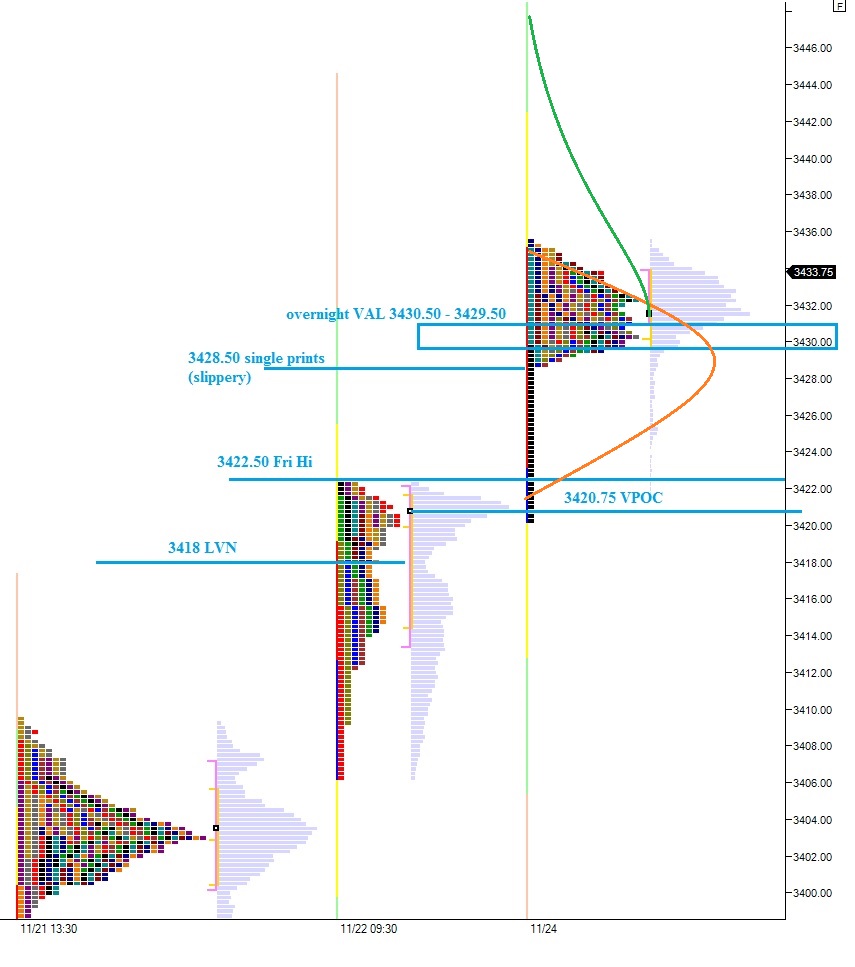
The question this morning is whether the sellers will make an attempt to fill the overnight gap or if we will instead “gap-and-go” which is a distinct possibility given the holiday week context. Turning our attention to the NASDAQ composite, sellers need to first push through the overnight value area low zone from 3430.50 – 3429.50. If sellers can breach this zone and press down to 3428.50 we are well on our way to filling the gap.
Should the sellers succeed, downside targets are 3422.50 (Friday high), 3420.75 (VPOC), and ultimately the low volume node at 3418. This level is of particular interest because it represents the price moment when sentiment suddenly shifted optimistic Friday. Sustaining trade below 3418 may suggest a shift in sentiment.
To the upside, we are working with measured moves. I show a buyer target zone from 3437.50 – 3436.75.
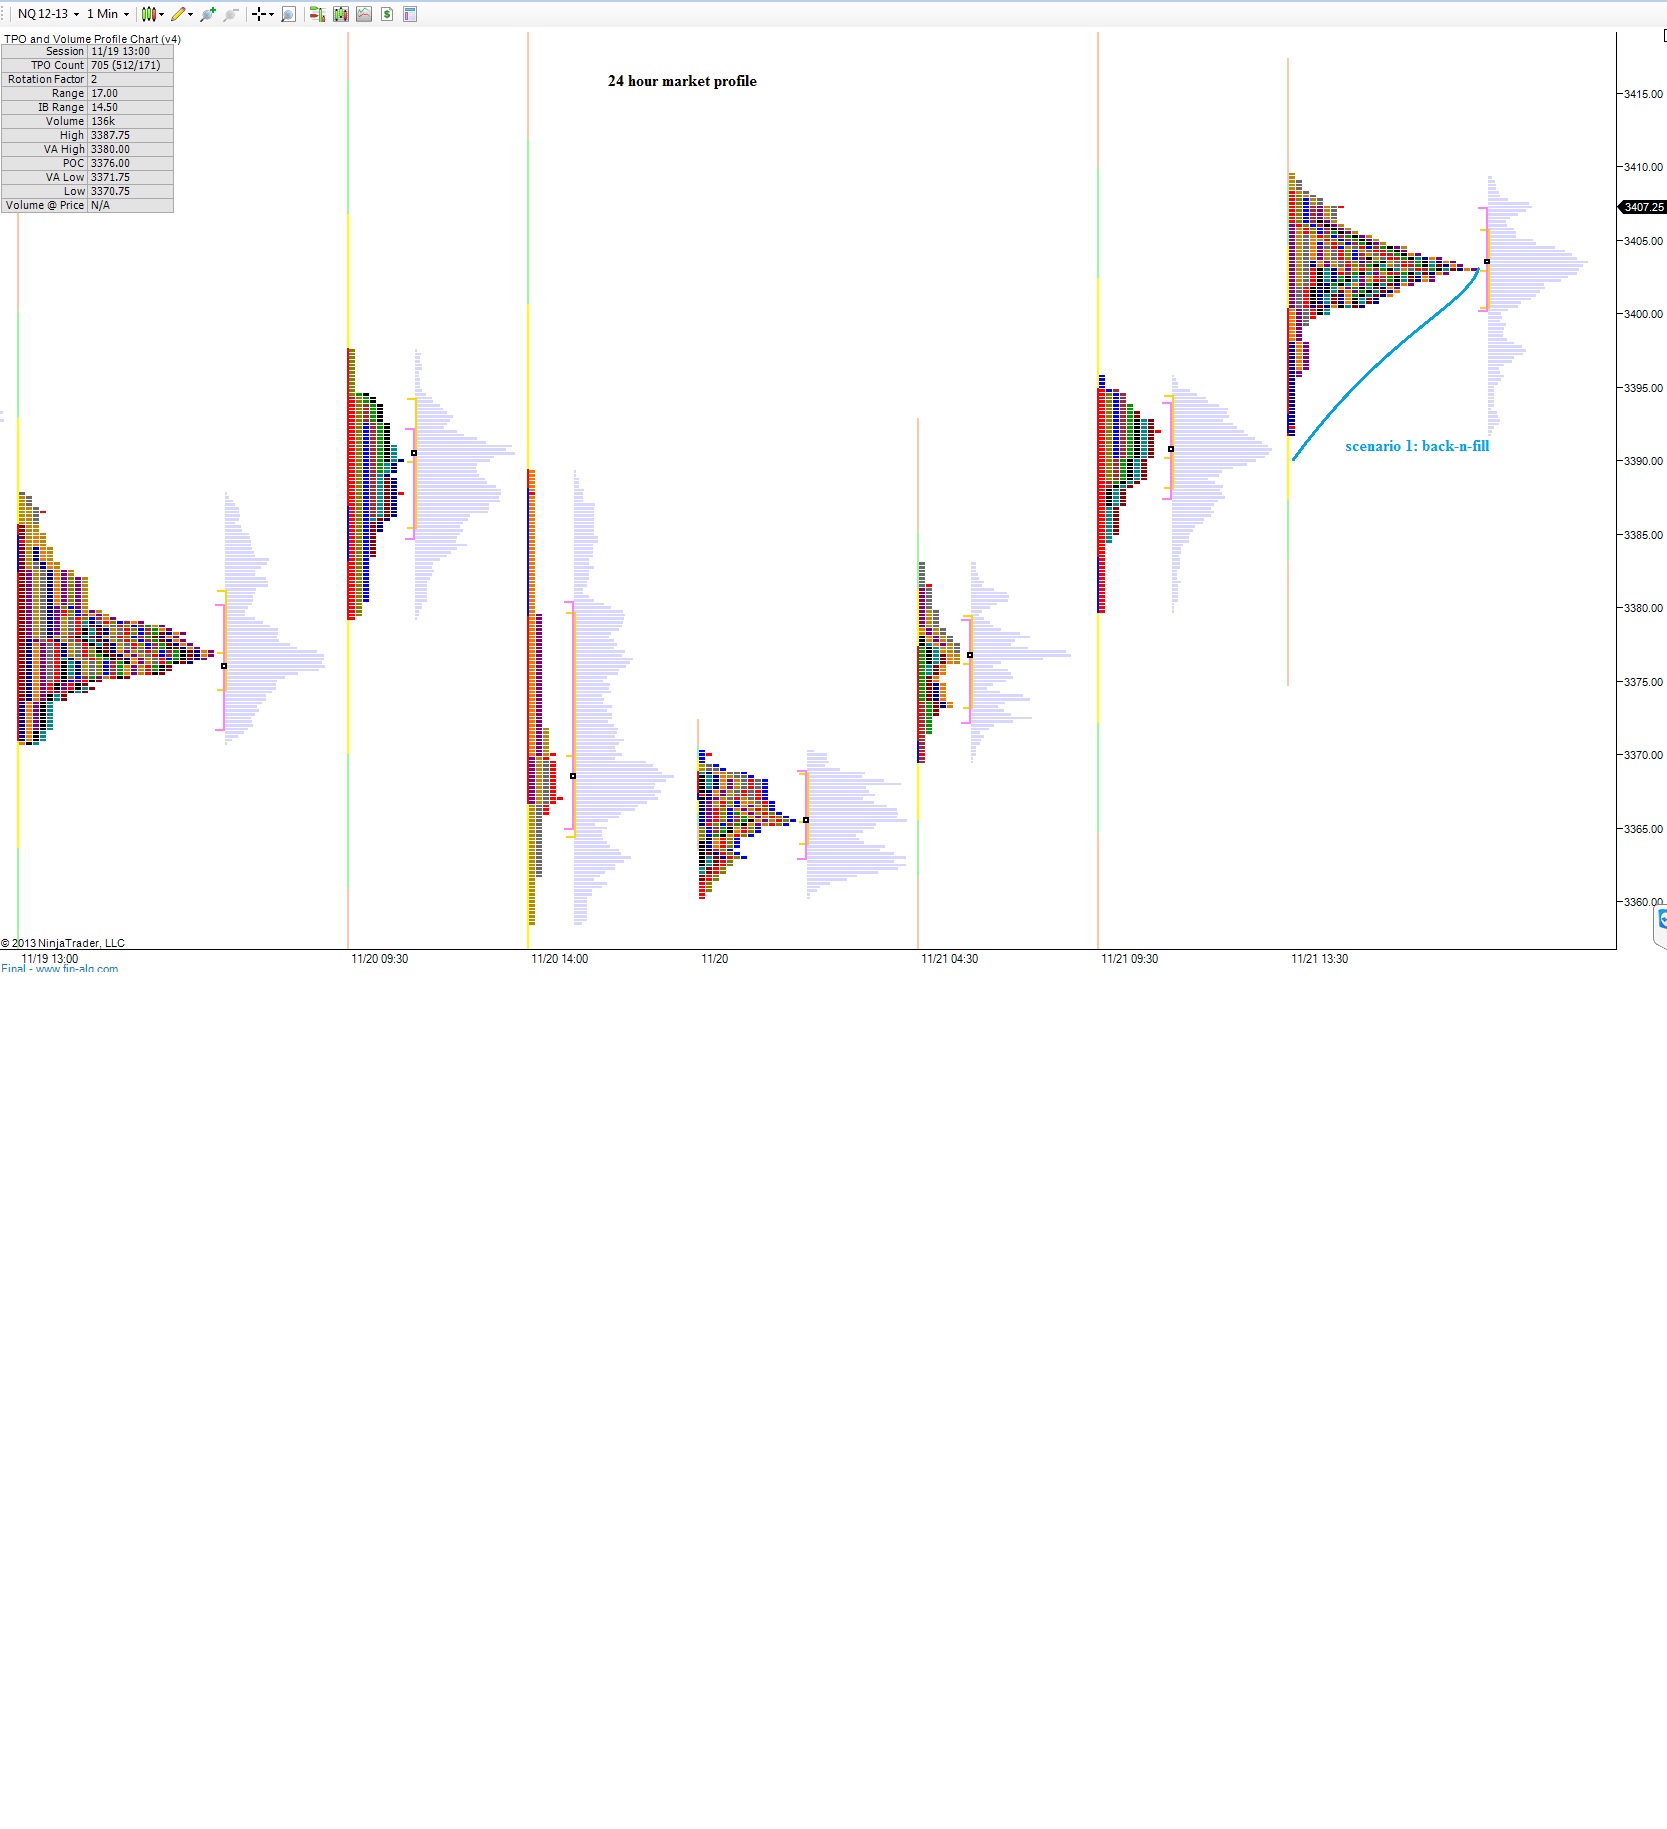
I have highlighted the above levels on the following 24-hour Market Profile chart:
For a good portion of the week, market participants slugged it out at the 3390 price level in NASDAQ futures. We kept printing low volume nodes at the level which is indicative of fast market action. Indeed we saw several swings away from the level good for 5-10 points at a time,
Then yesterday came, and this is something you will see often in market profile work, the market spent hours at 3390 and built a ton of volume. So much volume in fact, 3390 became the volume point of control on yesterday’s profile.
After building the base, the market began migrating higher and held the progress overnight. The sellers were in charge Monday through Wednesday but now buyers are attempting to dictate direction.
I will be watching 3413.25 above to measure buyers’ progress and 3395, 3390, and 3385 to track their defense.
The 24 hour profile suggests we may see some back-and-fill action occurring and we are set to open in a slippery zone so we may see some chop. If instead we see an aggressive drive above or below the aforementioned levels, be cautious for trending action.
The indices caught a bid on the dip overnight and have us set to gap higher this morning. The buyers may need a head start if they are to claim a victory on the day. Thus far this week, the sellers have held solid control and are doing a confident job dictating market direction.
The sellers could even be seen shorting into weakness yesterday, an action that in recent history would result in vicious squeeze and capitulation type action.
I am still keying off of 3390 on the upside and 3360 below on the NASDAQ futures. We breached this low print yesterday during RTH, it became our overnight low, and it market the level where we launched higher last Tuesday. If buyers cannot sustain trade above this level it would suggest the sentiment that propelled the market to recent highs has changed, and is no longer impactful.
Do not have any graphics to present this morning. Watch for sellers to enter at some point this morning to close the overnight gap. If they no show, something may be afoot or they are waiting to see the auction behavior before stepping back in. Rest assured they have gained a bit of confidence this week which in a big part is due to their solid defense at 3390.
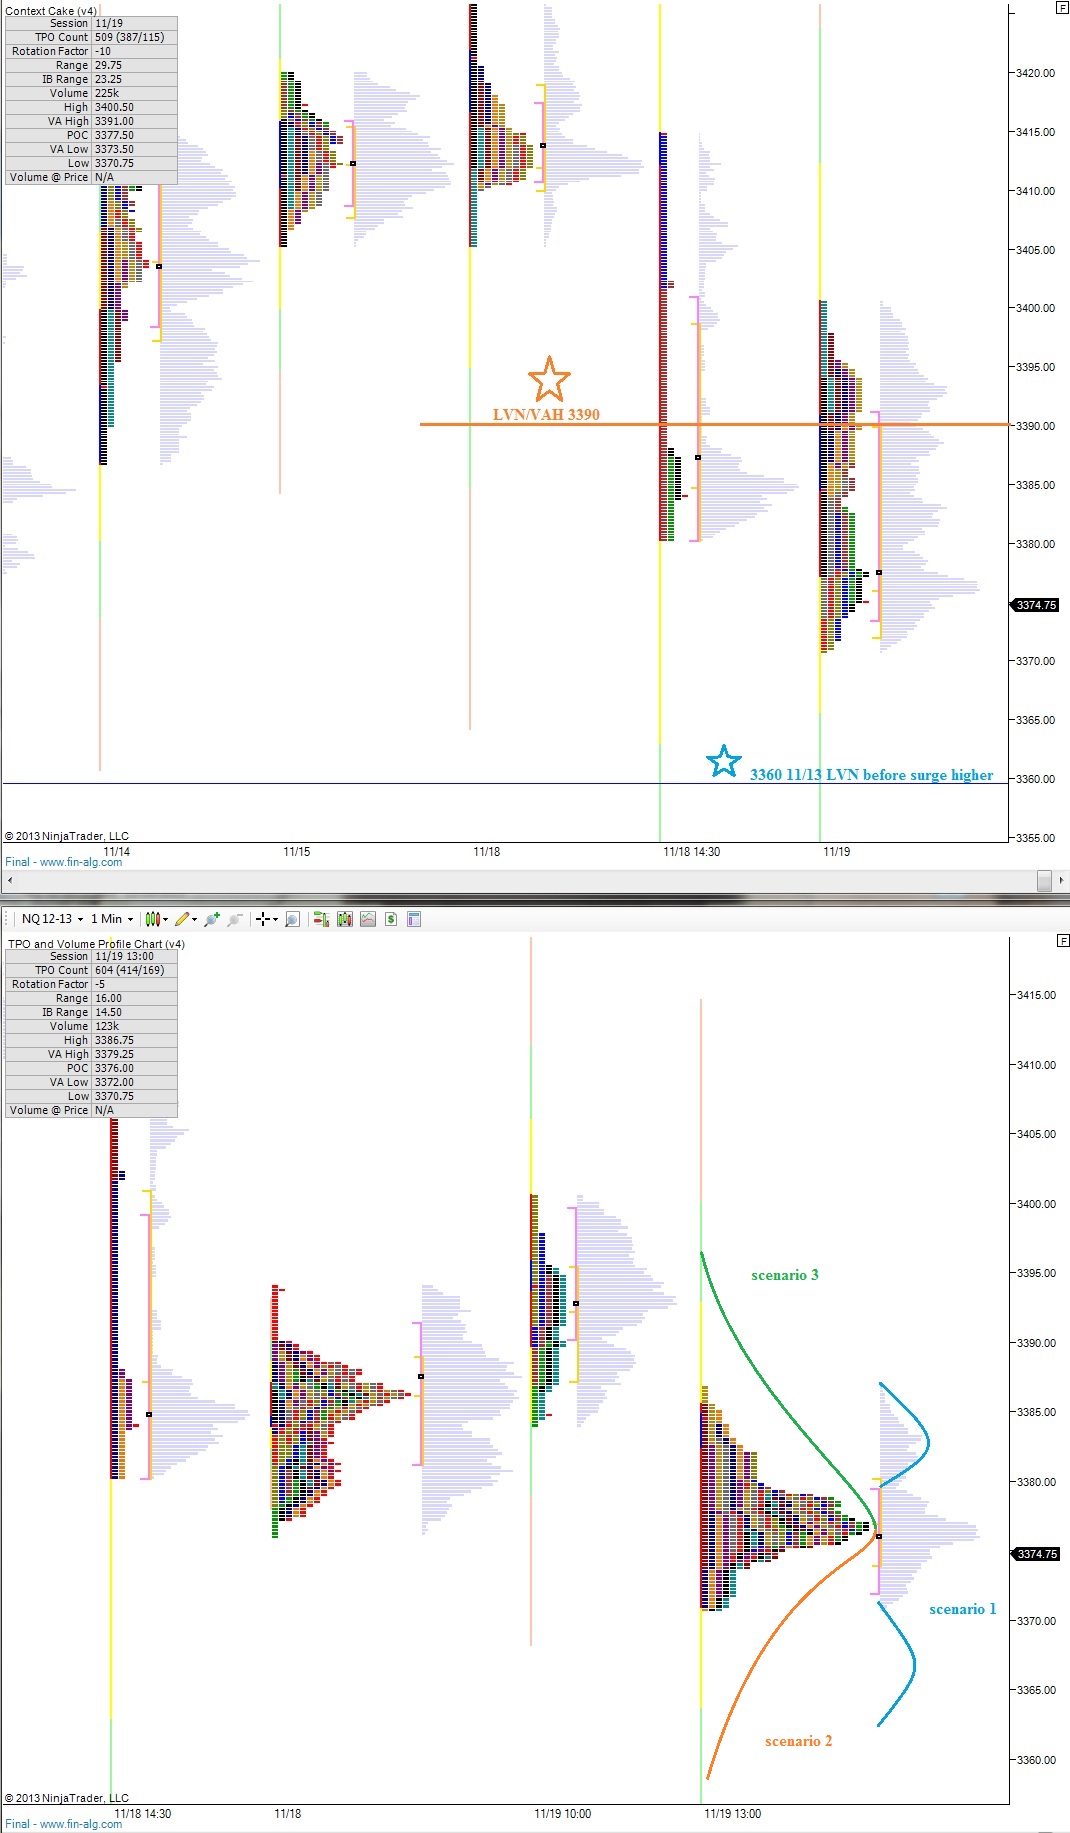
Price in the NASDAQ futures is nearing the zone where we saw the large breakout last week. Last Wednesday, just before ramping higher, the market printed a well-defined low volume cave surrounding 3360. To my eye, if the market accepts price below this level (spends an hour or more below and builds volume-at-price) then the sentiment introduced to the market last week is gone, and we should adjust accordingly.
Keep in mind however, that a mere breach of this level is not your tell. Instead price needs to sustain below for a reasonable duration. A VPOC establishment below the reference point would support the case for lower prices even further.
Up above we have a wonderful confluence of low volume and value area high at 3390. This is the sellers’ stronghold, a level they defended well yesterday after thrusting us lower. Trade above these levels would represent a bull victory as the market attempts to regain balance.
Overnight we were fairly balanced with a bit of sell flow which was faded this morning. In determining whether the bulls can sustain control of this aged trend, I want to see the velocity of the market slow. If we can consolidate sideways a bit slower then yesterday’s violent indecision, then that slowing of the market in and of itself would be constructive.
I have highlighted the above price levels, as well as drawn out a few normal scenarios on the following market profile charts. Remember, normal does not always mean right, and a different type of day development would be another clue: