iBankCoin
Home / Tag Archives: $NDX (page 13)

Tag Archives: $NDX

Every Major Context Piece December Has Produced

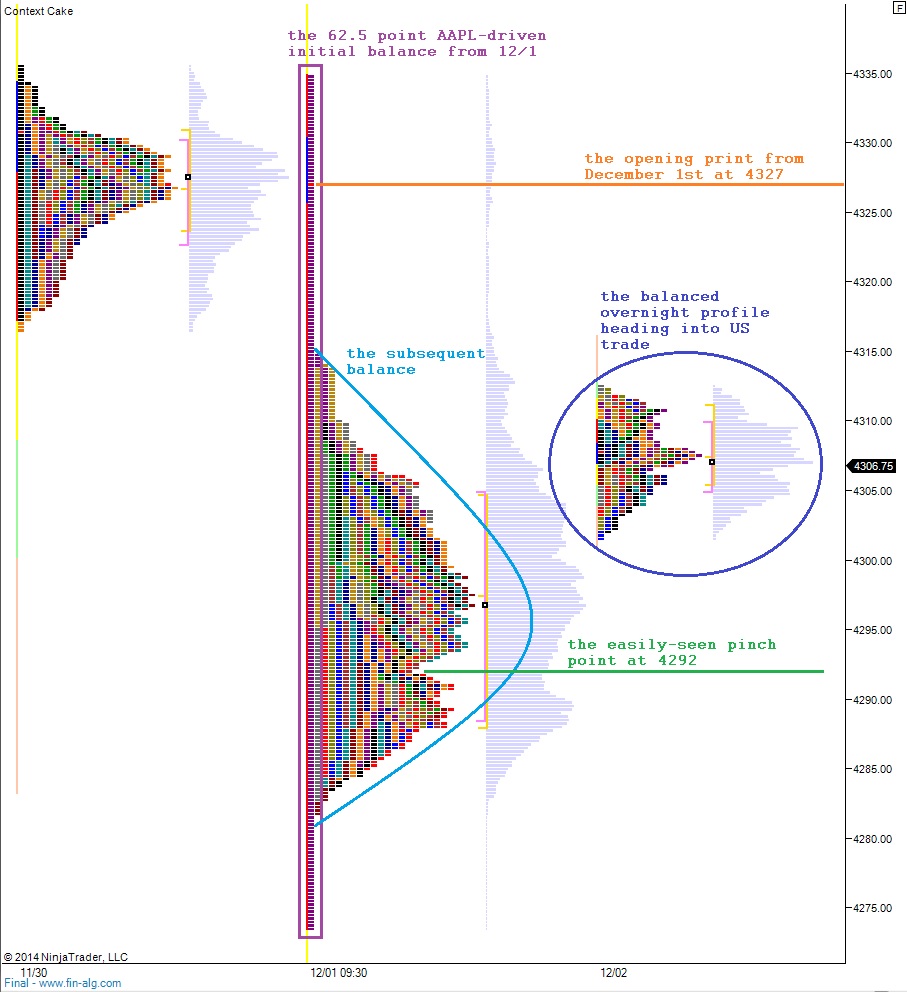
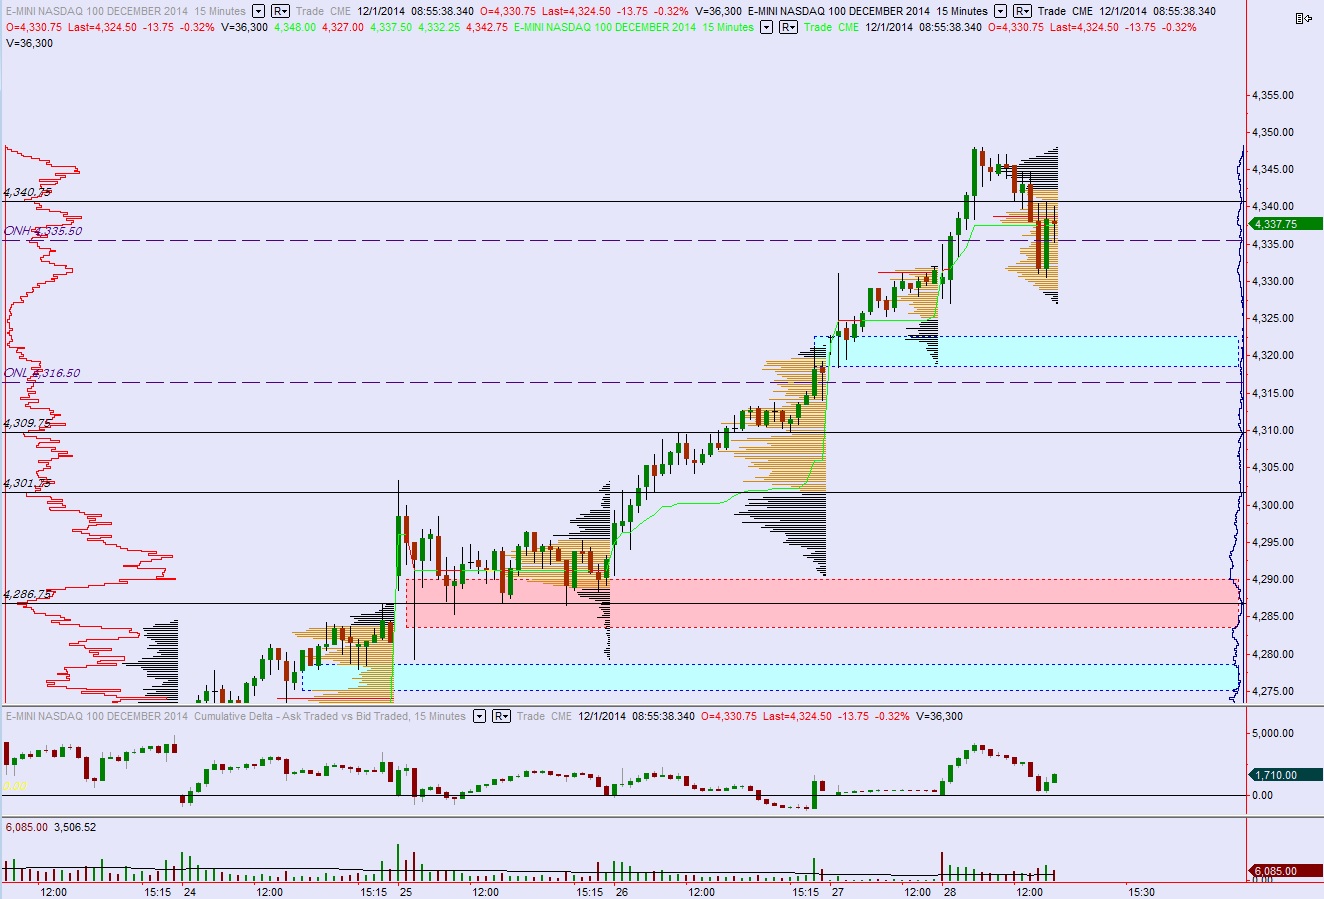
We started the month of December with an ‘event’ of sorts. The first half-hour of trade, also known as the initial balance, was spread far and wide (61.25 points) by an aggressive other time frame participant who predominantly sold the market. We must also give some credit to the buyers who pushed up 7.75 points before the move, the move largely driven by a fast sell in AAPL shares.

In case you are very new to the Nasdaq, Apple Inc. is the largest component of the Nasdaq 100, the underlying index of /NQ_F futures.

However, none of this activity was news driven, which makes it unique. We treat motivated, news driven moves a bit differently from big, participant driven moves.

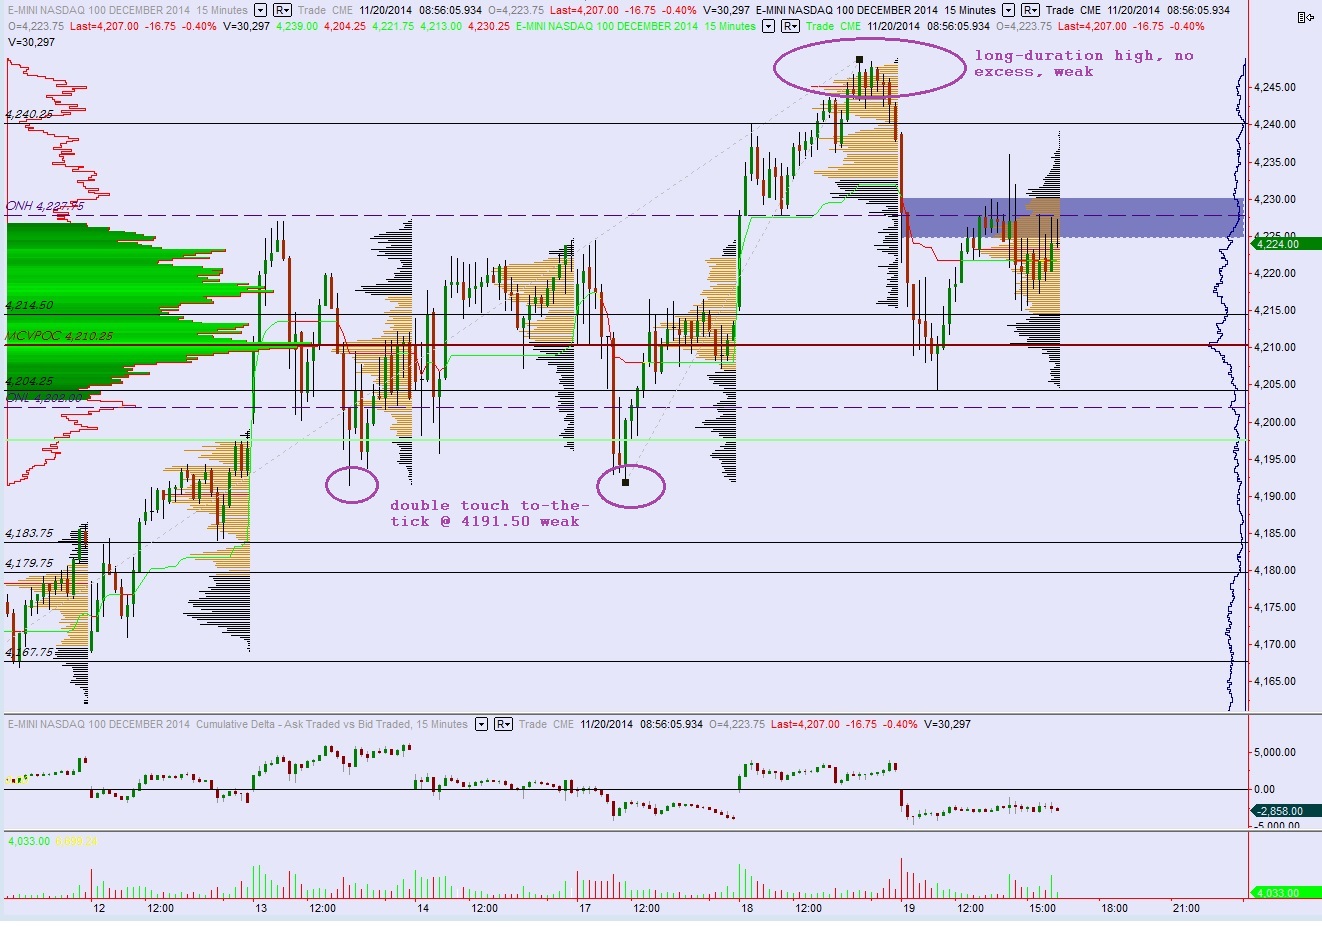
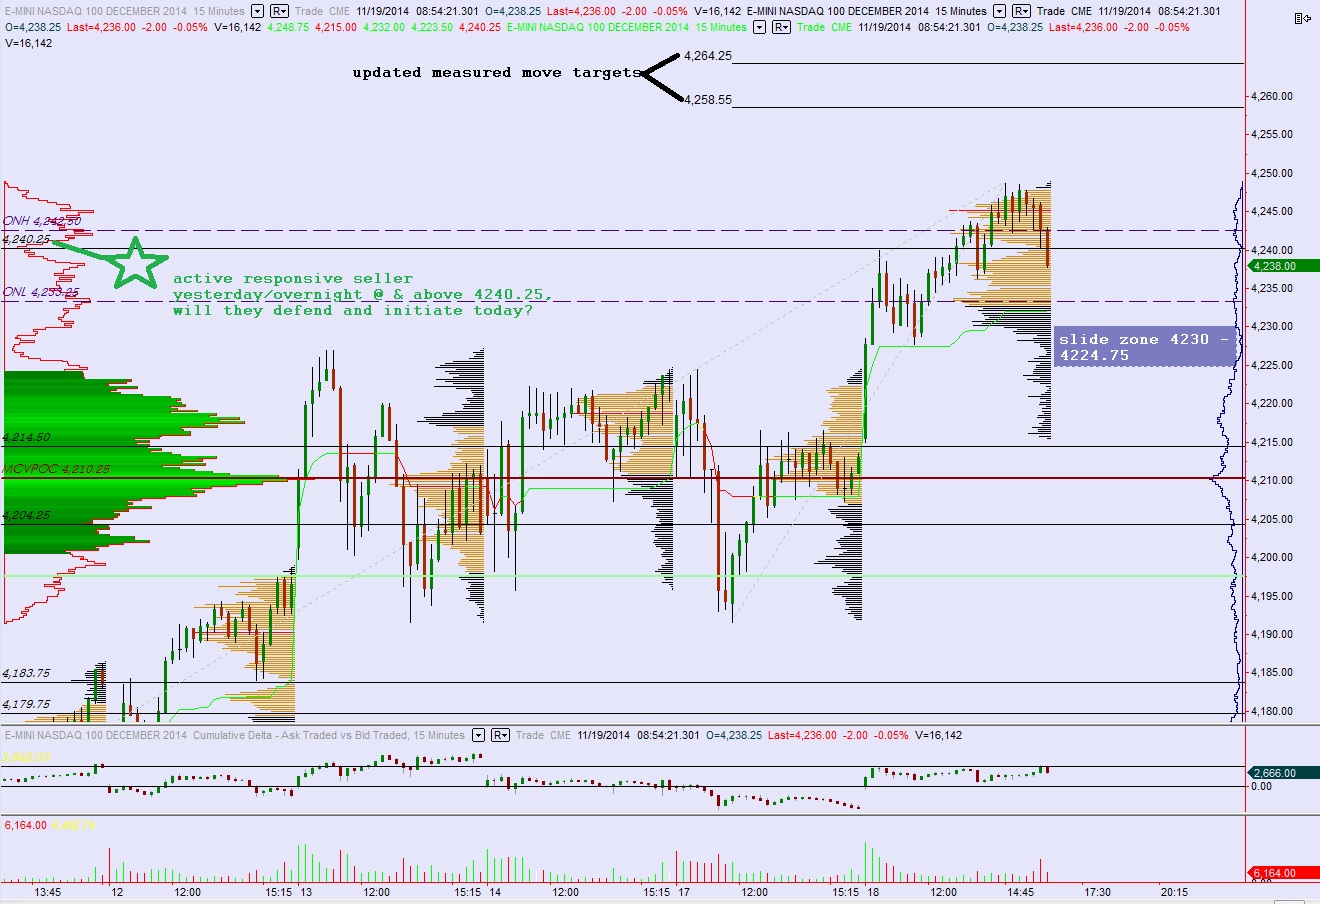
Participant driven moves must be monitored for continuation. Does the responsive seller become initiative? Is the other-time-frame (OTF) still engaging the market? So far no, and maybe.

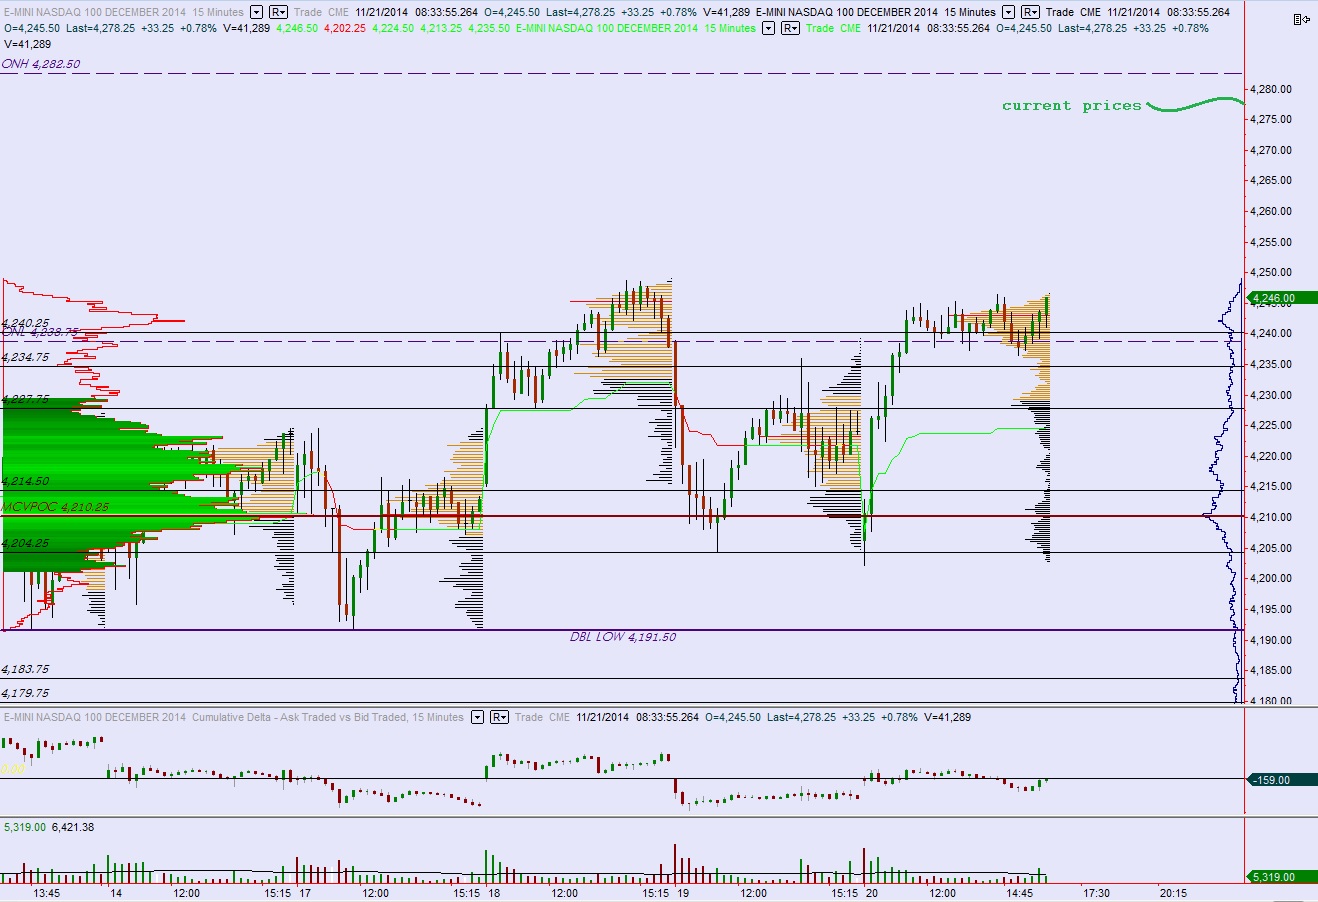
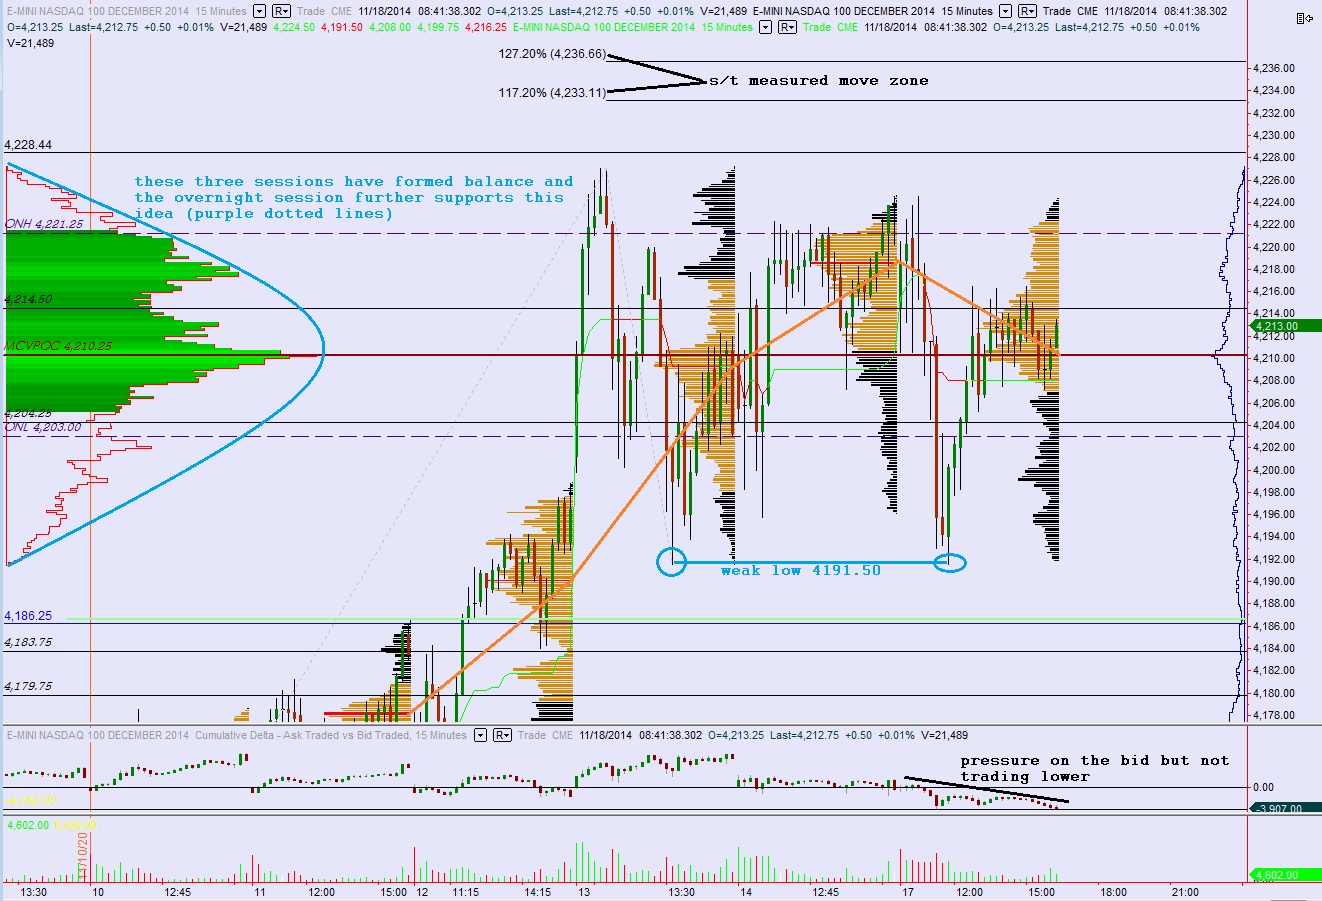
We have traded inside this initial balance since it occurred. And as far as I am concerned, we can shelf the volume profile I normally share which features very granular levels only useful to me and other day traders, and instead put your eyes, the swing traders eyes, on just a few key points.

Listen, we have Fed Beige Book coming out at 2pm today and it is usually not a high impact event. But before then ISM Non-Manufacturing Index is set for release. This number surveys all sorts of odd industries like services, construction, mining, agriculture, forestry, and fishing and hunting. It may be of interest during the great commodity liquidation of 4th quarter 2014. Keep an eye on the price action around 10am eastern.

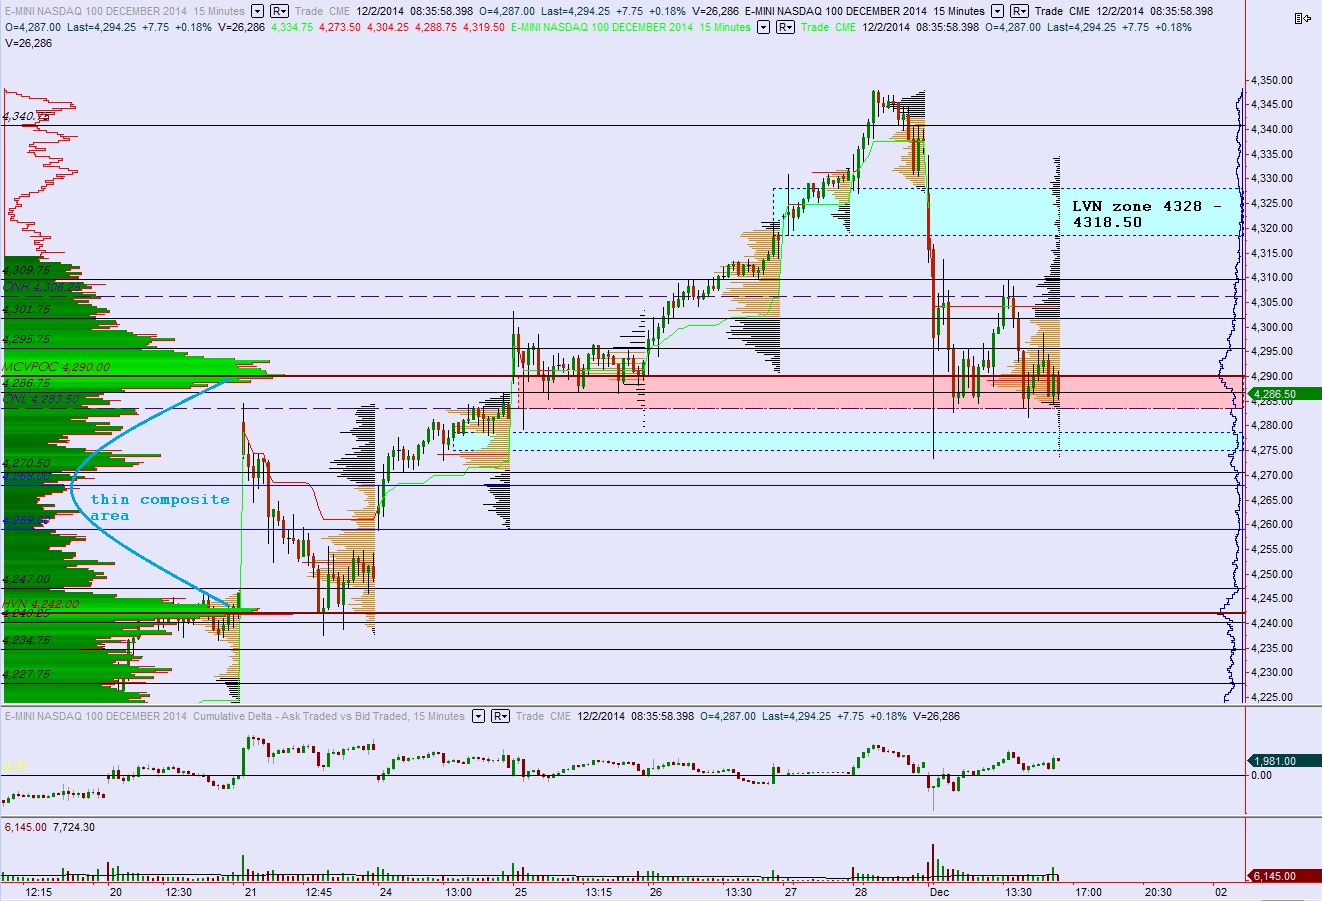
In the meantime, amid all that noise, keep these context levels close to your itchy trigger finger during today’s session:

12032014_NQ_ONprofile

Comments »

Exploring The Nasdaq Relative Strength

The start of a new month tends to carry volume with it and yesterday was no exception. Prices traded lower fast to start the cash session in the Nasdaq after opening right at Friday’s low. The initial drive down behaved much like news had caused a swift other timeframe entry, however it was largely due to a sharp sell in shares of Apple, the largest company in the world.

The market spent the rest of the session confined within the 61.5 point range developed during the first hour of trade and overall led to a weak climate for individual stocks. The heavy churn managed to shift the VPOC of the current micro composite up from 4242 which was a subtle contextual development. Whenever I see a VPOC shift it tells me two things—value has migrated and it’s time to closely observe who it motivates to act most aggressively on the market (buyers or sellers).

The Nasdaq is still trading above an air pocket which separates us from the mutli-day balance formed from 11/13-11/20 unlike the S&P which is already down in its pocket. Buyers need to sustain prices above 4268 to hold off the process of exploring and negotiating the pocket open just below current prices on the Nasadq.

The overnight action was up and contained within the balance formed yesterday. Buyers were most active thus my expectation is for the open to feature a push lower to test the overnight inventory. Sellers will look to target the MCVPOC at 4290. If buyers are not found in this region then I expect us to continue lower to test the overnight low 4283.50 then Monday’s low 4273.50.

Swing traders will be eager to see if the speed in the marketplace continues which may lead them to raise cash of even seek out short positions.

I have highlighted the important levels I will be trading from on the following volume profile chart:

12022014_NQ_VP

Comments »

Business as Usual on The Nasdaq

Despite the volatility in the commodity futures markets, the action in the Nasdaq has mostly ‘normal’. I use the term normal loosely to define the amount of volume transacted and the overall range of the session which both fall well within the 1st standard deviation of a data set dating back to January 2012.

Also, the profile print suggests balance. You can see the action formed a well-distributed bell curve:

12012014_NQ_ONprofile

Keep in mind we have ISM manufacturing stats at 10am today then an otherwise quiet economic calendar until Wednesday.

Looking at the higher timeframe as we start the week, we can see the first real sign of excess show up on the Nasdaq since the doji on 11/25/2014. As we enter a new month of trade with the potential for new cash flows, it will be interesting to see how this candle is treated to start the week. I have noted very little else on this daily chart, just the major air pockets below current prices:

12012014_NQ_Daily

Below I have note the key price levels I will be observing today. Note how prices overnight exceeded the lows of Thanksgiving day. The market appears to want to properly auction these prices. If we decidedly break below 4309.75 then it likely opens us up to continued tests lower. Otherwise, I expect chop and balance. Please see below:

12012014_NQ_VP

Comments »

The Turkey Trot

Prices on the Nasdaq have drifted higher during the holiday session in a holiday manner. Under the influence of low volume and perhaps tryptophan the market has gained nearly 40 points to the upside since Wednesday’s close.

When trading at swing highs, there are not many reference points nor is volume profile analysis as effective for noting key inflection points in the market. However, as the market trades higher searching for sellers, we can not the key price level footprints left in its wake.

I have noted the key support levels and air pockets which may offer fast trades on the following volume profile chart:

11282014_NQ_VP

Comments »

Know About These Air Pockets

A slew of economic data pertaining to Durable Goods and Personal Income and Initial Jobless Claims was released at 8:30 am and the mixed data ushered a bit of selling into the globex premarket. Looking ahead we have Chicago purchasing manager at 9:45 am, U of M Confidence at 9:55am, and New/Pending Home sales at 10am. Energy traders will also be keen on the 10:30am oil and gas inventory numbers and the 12noon EIA Natural Gas storage numbers.

Nasdaq volumes are still running at a fairly normal rate, just on the low end of normal. However the range compressed overnight to only 13.50 points which is below normal as we head into the final day of trade before Thanksgiving.

Overnight markets managed to make new swing highs on verses the RTH session yesterday and overall maintained trade in the upper half of Tuesday’s range. This is holiday grind-type trading at its finest.

There are a two volume pockets that have formed while we drifted higher out of balance. They will likely come into play at some point soon. The pink one might see some action today. When they do trade they will offer a quick opportunity to earn a few points. I have noted these levels and other key levels I will be observing on the following volume profile chart:

11262014_NQ_VP

Comments »

Holiday Mode

The Nasdaq continues to make new highs this morning as volumes begin to dry up. The overnight range is in the realm of normal but still exhibiting a slightly compressed range. GDP data came in stronger than expected at 8:30 am and the initial reaction was buying. Keep in mind we also have Consumer Confidence data set for release at 10am today.

My initial outlook on the week was that the extended Nasdaq had done a good job finding sellers on Friday with the big gap higher and subsequent selloff. However, the market is again drifting higher in search of a fair sell point. Yesterday prices managed to exceed Friday’s high and push value higher on a session that featured many pockets of momentum under the surface.

The low volume environment is showing evidence of favoring buyers and traders are likely to benefit more from targeting opportune individual charts than trading the index itself. However, I have highlighted the key context levels I will be observing today on the following volume profile chart:

11252014_NQ_VP

Comments »

China Drops an OPEX Surprise

Today is option expiration day for many stock options, and although we live in the age of weekly expiration dated options, the original third Friday expiration carries a bit more weight. Just before 6am we received unexpected news from the East where the Chinese Central Bank cut deposit rates by 40 basis points. This news fueled a rally in the Nasdaq globex session which is currently printing a range in excess of the 1st standard deviation of normal on volume to the same degree. In short, this is an outlier overnight session verse 68.8% of overnight sessions over the last five years.

The price action has us set to gap to new swing highs on the index suggesting the market will be out of balance come opening bell. This can lead to big moves. Leading into today was yesterday’s session which had the look of a short trap. Prices went gap lower and took out Wednesday’s low only to sharply reverse early on and squeeze shorts. The overall look of the profile suggests a short-squeeze event occurred leading into today.

Auction theory is not quite as effective at new highs, however I have listed the support levels I will be observing on the following volume profile chart:

11222014_NQ_VP

Comments »

Surrounded By Weakness

Prices moved lower in the Nasdaq overnight and as we approach US trade the market is hovering inside the lower quadrant of yesterday’s range. At 8:30am traders learned about the CPI and Jobs situation in the United States, and all numbers but one were better than expected. Initial Jobless Claims came in a bit higher than expected. After the open we have Markit PMI at 9:45am and both Existing Home Sales and Philadelphia Fed at 10am.

The futures broke loose to the downside just after 3am and since then the overnight profile has taken on a b-shape suggesting the initial wave might have been of the long liquidation variety.  It also exposes a slip-zone up to 4217.50. You can see the overnight profile below: 11212014_NQ_ONMP

At our current prices, the weak low at 4207 is now in range. This is a piece of context that formed on Monday when the market printed a double bottom on this tick. That is a poor low and carries an expectation of resolution. The swing high also looks weak but is nearly out of range statistically. The net result is a neutral stance which leads me to expect choppy trade. This is unless we see a strong driver off the open like we saw the past two days. I have highlighted the key price levels I will be observing as well as the weak high/low observations on the following volume profile chart:

11212014_NQ_VP

Comments »

Active Seller Identified Ahead of FOMC

Nasdaq futures traded a below normal range and volume overnight as the market heads into the halfway mark of a week featuring an economic data backload. At 8:30 am US Building Permits and Housing Starts numbers were released but show little impact on index prices. Instead it appears the market is more interested in the 2pm FOMC minutes and perhaps Thursday premarket when CPI data will be released.

My typical expectation on an FOMC day is an active open featuring 1-2 prominent rotations before the session turns into a grind ahead of the announcement. Yesterday’s strength was interesting early on because the open had a drive-like aspect to it that occasionally portends trend days. It was enough buyer conviction to keep me from putting any shorts on intra day and an interesting piece of context to carry through the session and into today. Buyers did manage to range extend higher and upon doing so discovered responsive selling. The high end of yesterday’s profile looks like absorption. The VPOC shifted to the high end of the profile and we pressed lower right into the bell.

The short term dividing point between the responsive seller and buyers is a low volume node at 4240.25. Even overnight, when prices briefly popped above this level, sellers were active. I have noted this level, all other key price levels, and an LVN slide zone on the following volume profile chart:

11202014_NQ_VP

Comments »

Now We Wait

The Nasdaq has come into balance. Overnight prices traded a good portion of the balance zone, testing upper and lower value, and ultimately are trading near the midpoint as we head into Tuesday’s trade. Markets started moving around 4:30am when the UK released mixed-to-worse-than-expected Consumer Price data. The biggest rotations have been to the sell side but overall the session is neutral.

Any move away from our three-day value zone is now suspect with the approaching FOMC minutes tomorrow afternoon. The market is always trying to do something, even when it waits, and according to my contextual read it is trying to trade lower. However, it is not doing a very good job. Sellers pressed on the bid for most of yesterday’s session yet prices sustained above value. There is a poor low in place now [a double low vulnerable to breakage] and value drifted lower [VPOC] verses Friday.

Trying to go lower, waiting for new information, thus not doing a very good job trading lower is the short of it.

I have highlighted these observations as well as key price levels on the following volume profile chart:

11192014_NQ_VP

Comments »