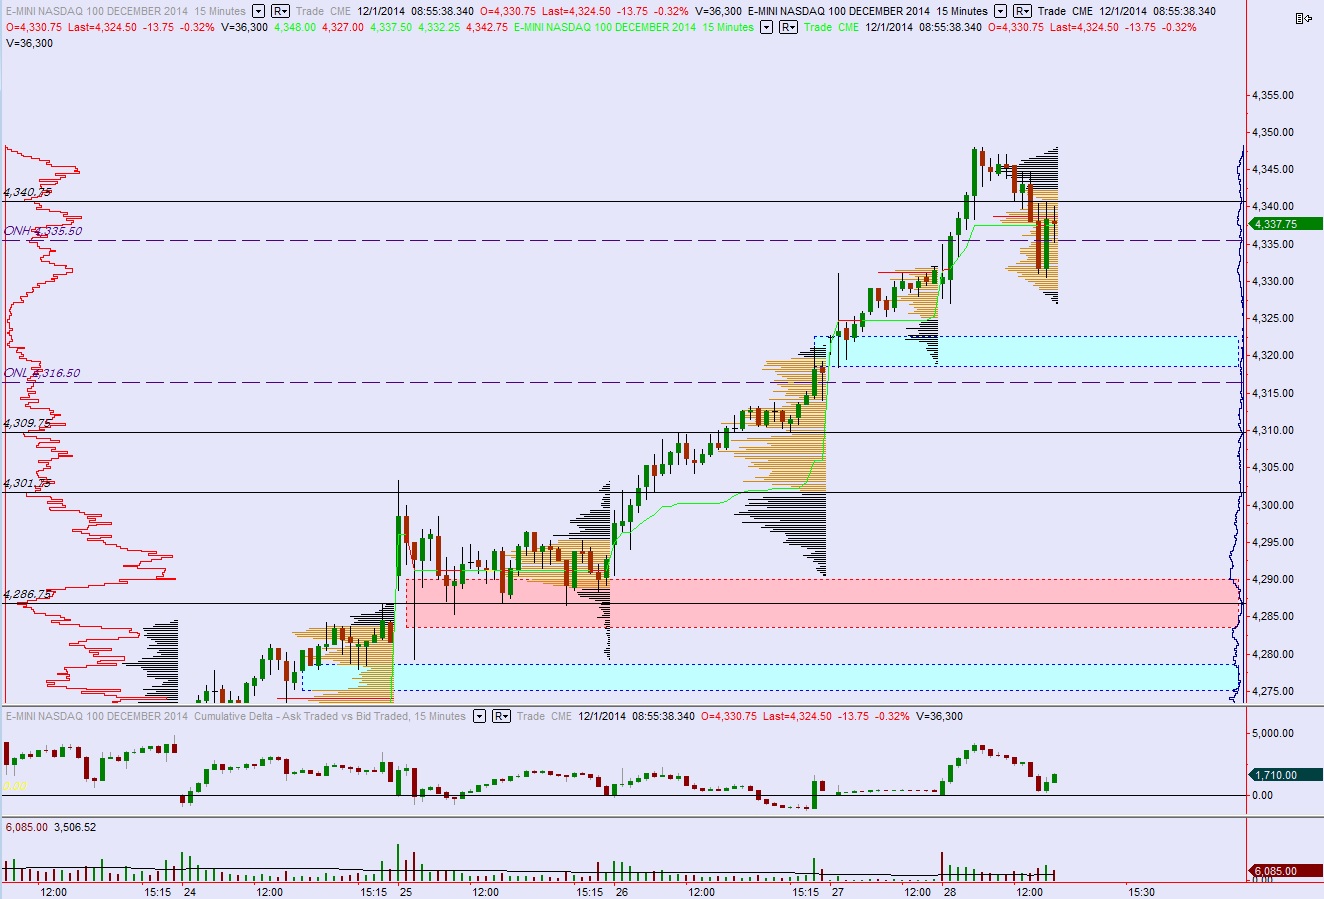
Despite the volatility in the commodity futures markets, the action in the Nasdaq has mostly ‘normal’. I use the term normal loosely to define the amount of volume transacted and the overall range of the session which both fall well within the 1st standard deviation of a data set dating back to January 2012.
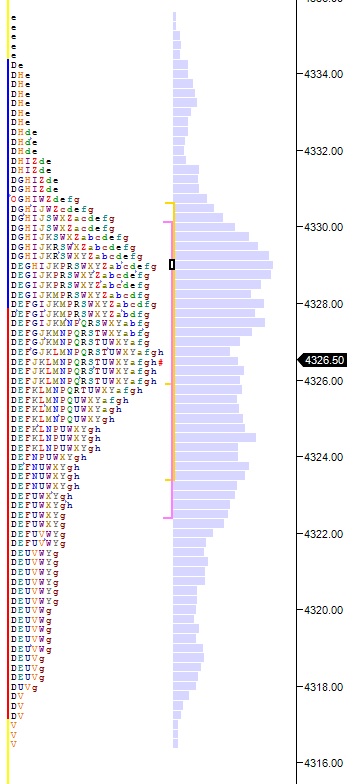
Also, the profile print suggests balance. You can see the action formed a well-distributed bell curve:
Keep in mind we have ISM manufacturing stats at 10am today then an otherwise quiet economic calendar until Wednesday.
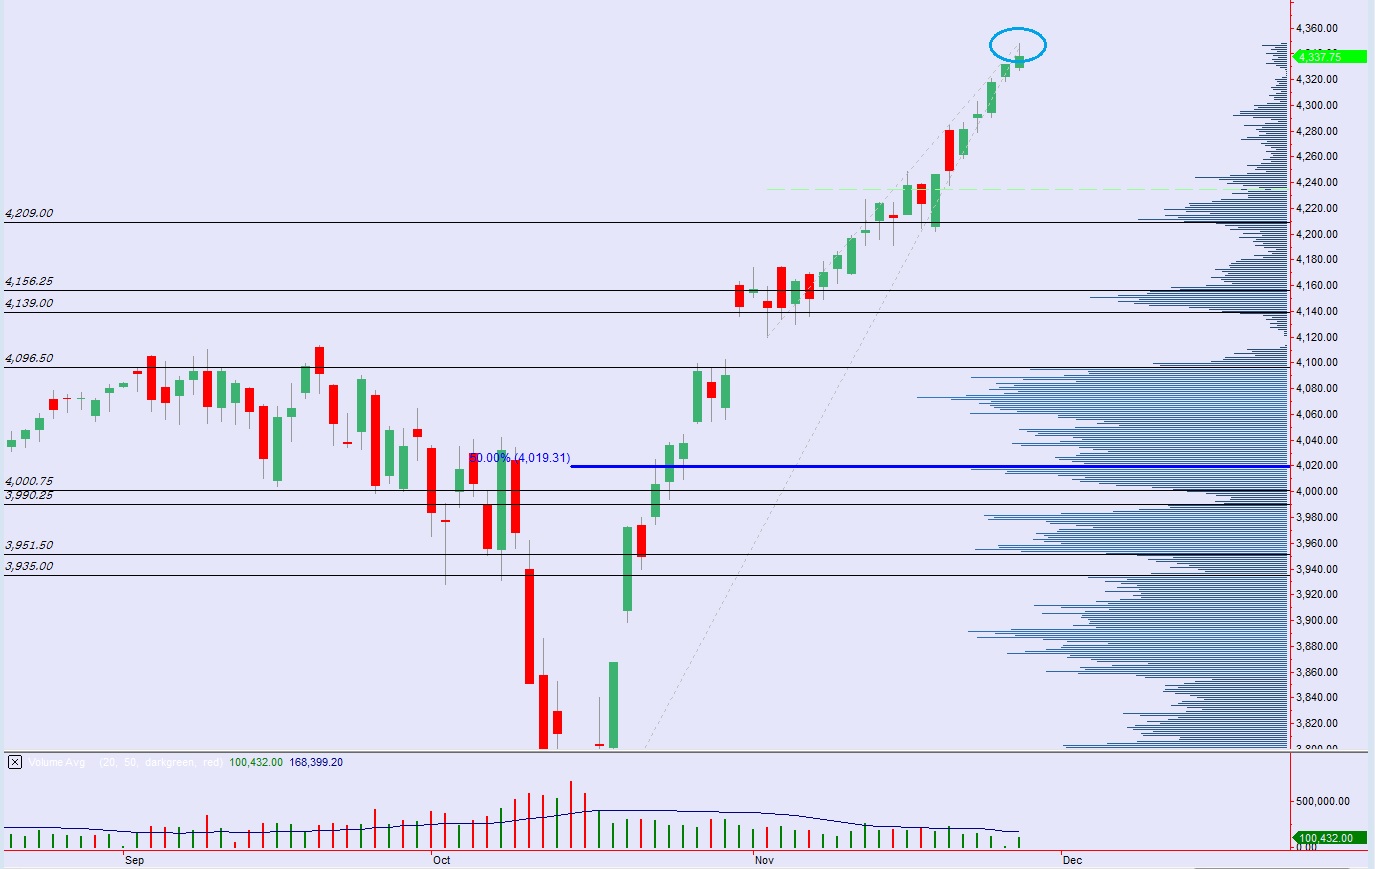
Looking at the higher timeframe as we start the week, we can see the first real sign of excess show up on the Nasdaq since the doji on 11/25/2014. As we enter a new month of trade with the potential for new cash flows, it will be interesting to see how this candle is treated to start the week. I have noted very little else on this daily chart, just the major air pockets below current prices:
Below I have note the key price levels I will be observing today. Note how prices overnight exceeded the lows of Thanksgiving day. The market appears to want to properly auction these prices. If we decidedly break below 4309.75 then it likely opens us up to continued tests lower. Otherwise, I expect chop and balance. Please see below: