Prices on the Nasdaq have drifted higher during the holiday session in a holiday manner. Under the influence of low volume and perhaps tryptophan the market has gained nearly 40 points to the upside since Wednesday’s close.
When trading at swing highs, there are not many reference points nor is volume profile analysis as effective for noting key inflection points in the market. However, as the market trades higher searching for sellers, we can not the key price level footprints left in its wake.
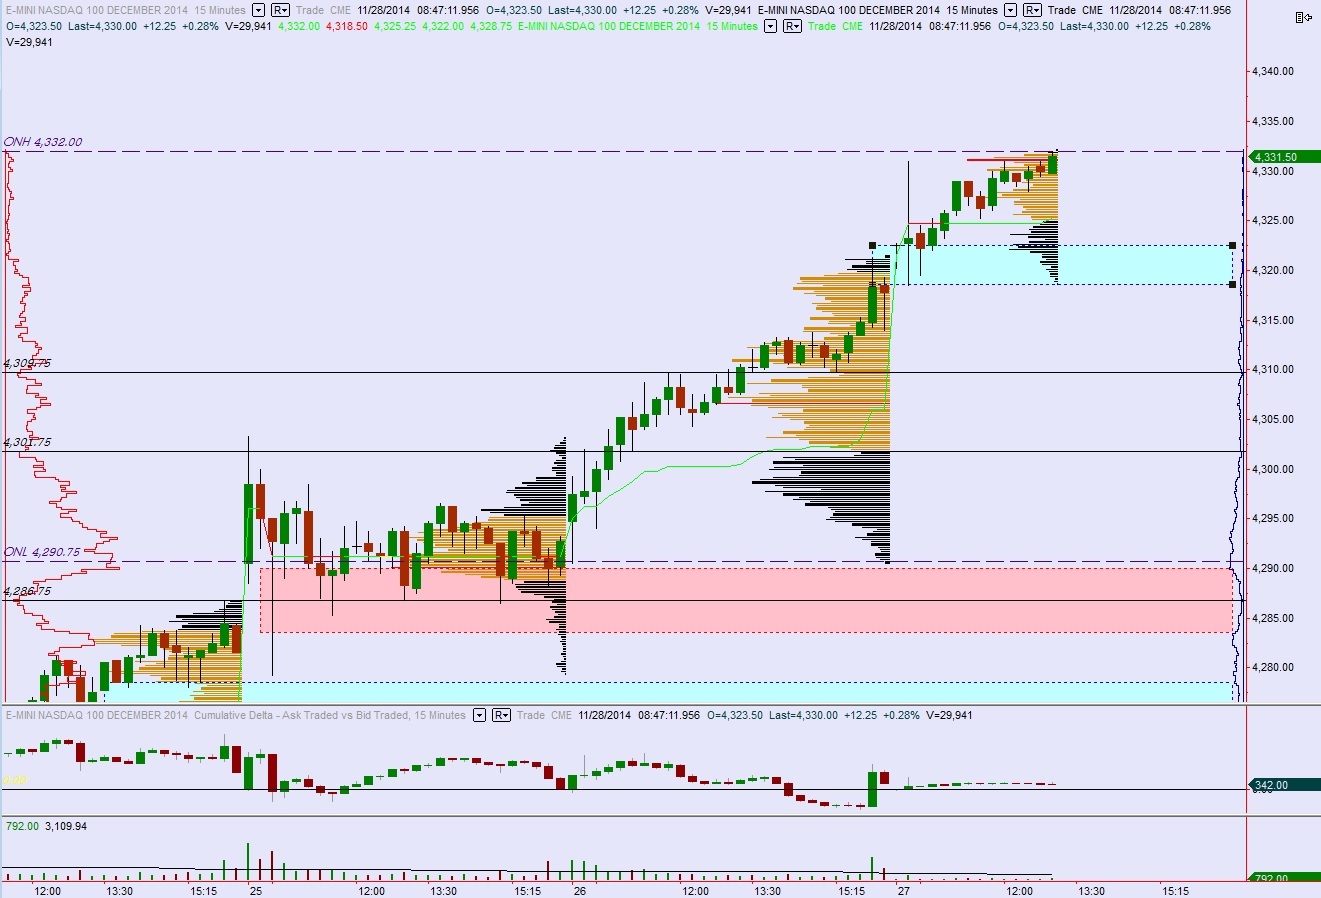
I have noted the key support levels and air pockets which may offer fast trades on the following volume profile chart:


Raul, I don’t understand your charts. Is there a tutorial you can point me in the direction of so that I am able to educate my self and get more out of your analysis? Thanks.
Josh –
He did a week long tutorial a couple or 3 months ago. It’s amazing.
thanks CatM, there are vids but I recommend reading through the volume profile and/or market profile categories listed on the right side of this blog (when accessed via a computer, sometimes the categories section is not shown on mobile phones)
I recommend printing out several days in a row, over a week say, then looking back, becomes a bit more clear when you follow the flow.
indeud
Happy thanksgiving! Missed your earlier post.
same to you pyromonoxide