iBankCoin
Home / Tag Archives: $NDX (page 14)

Tag Archives: $NDX

We Can Plan All We Want, Execution Is What Pays

Thank you for all the positive feedback on the inaugural Weekly Strategy Session. I look forward to building the broad context going forward.

Nasdaq futures trader lower for most of the globex session after Japan reported a weaker-than-expected third quarter GDP data. Buyers stepped up just above Friday’s low and as we approach US trade prices are pairing back more than half the overnight losses.

ECB Central Bank President Draghi is speaking in Brussels as we work through this final half hour of premarket trade. We also have US Industrial Production set to release at 9:15am.

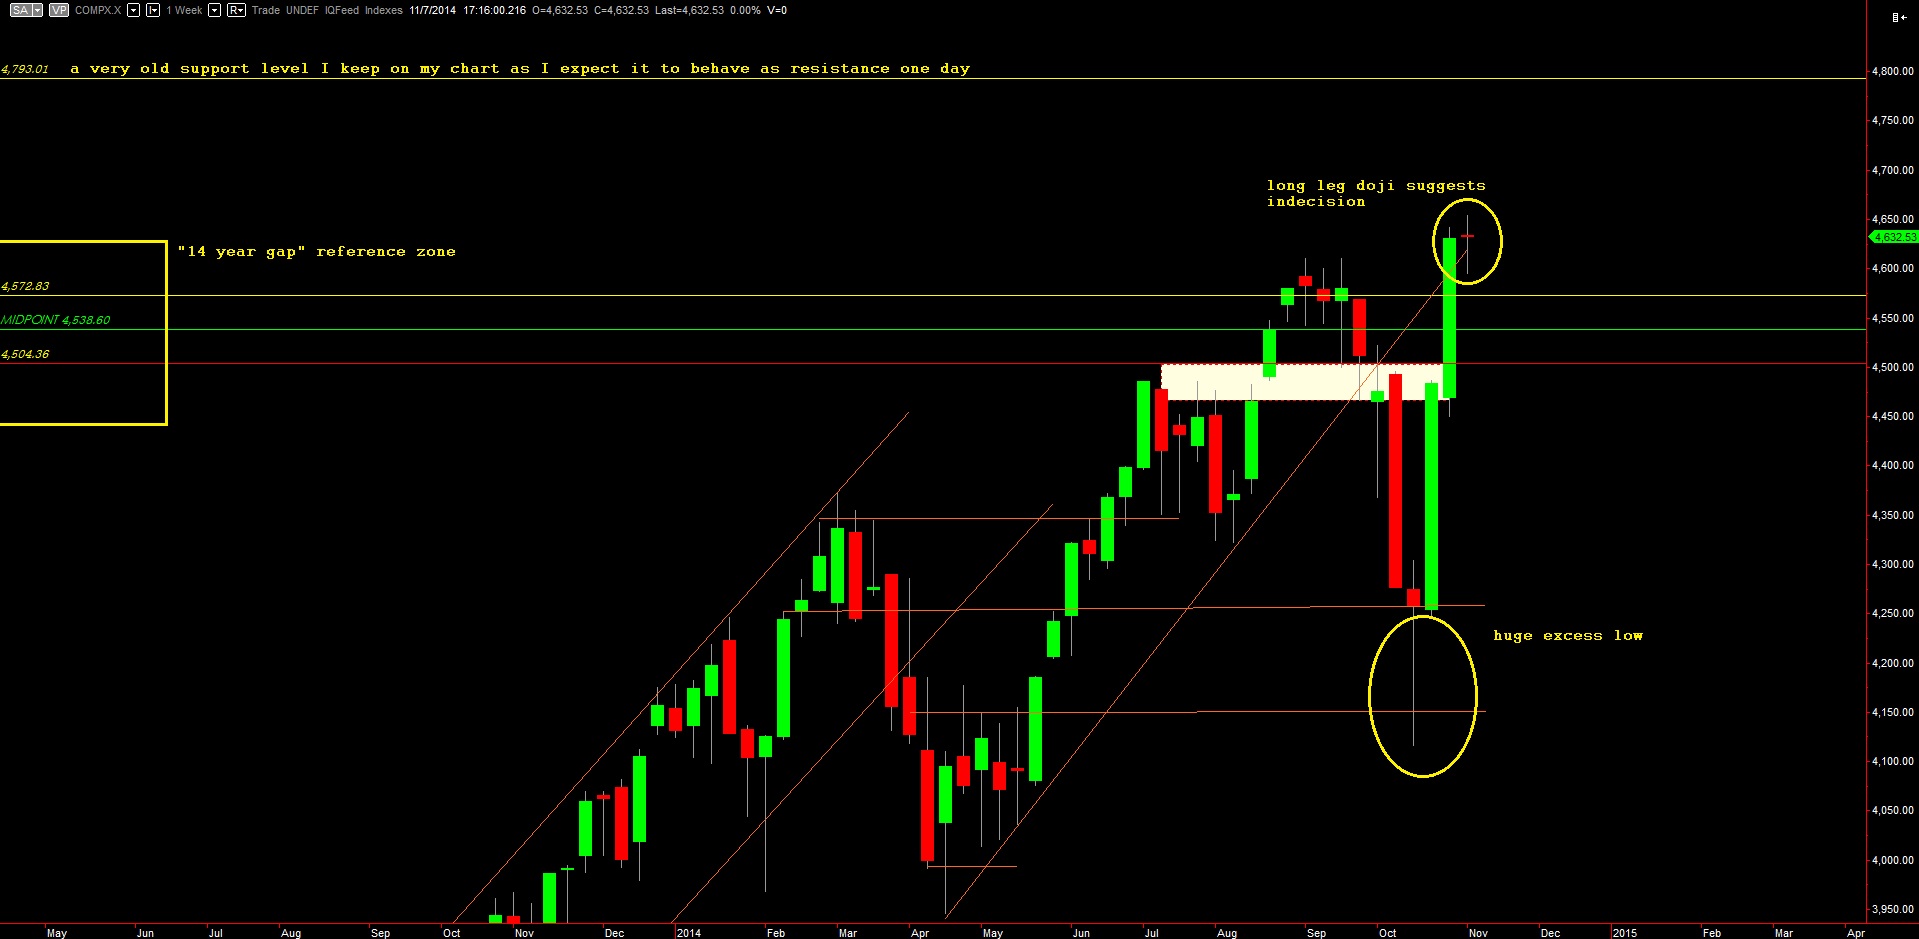
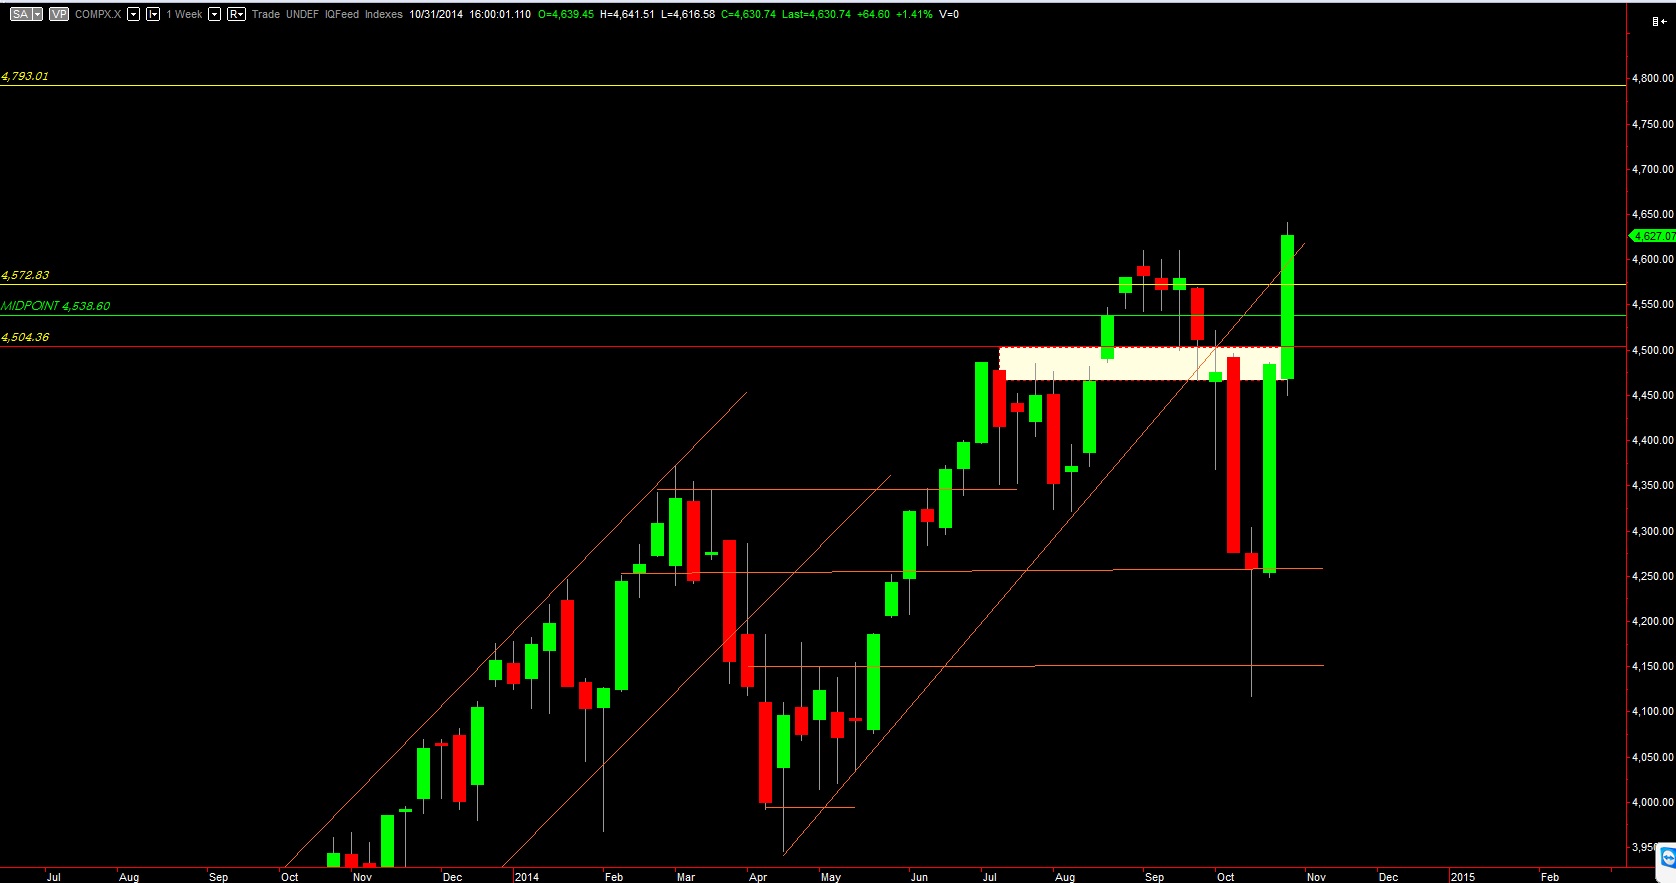
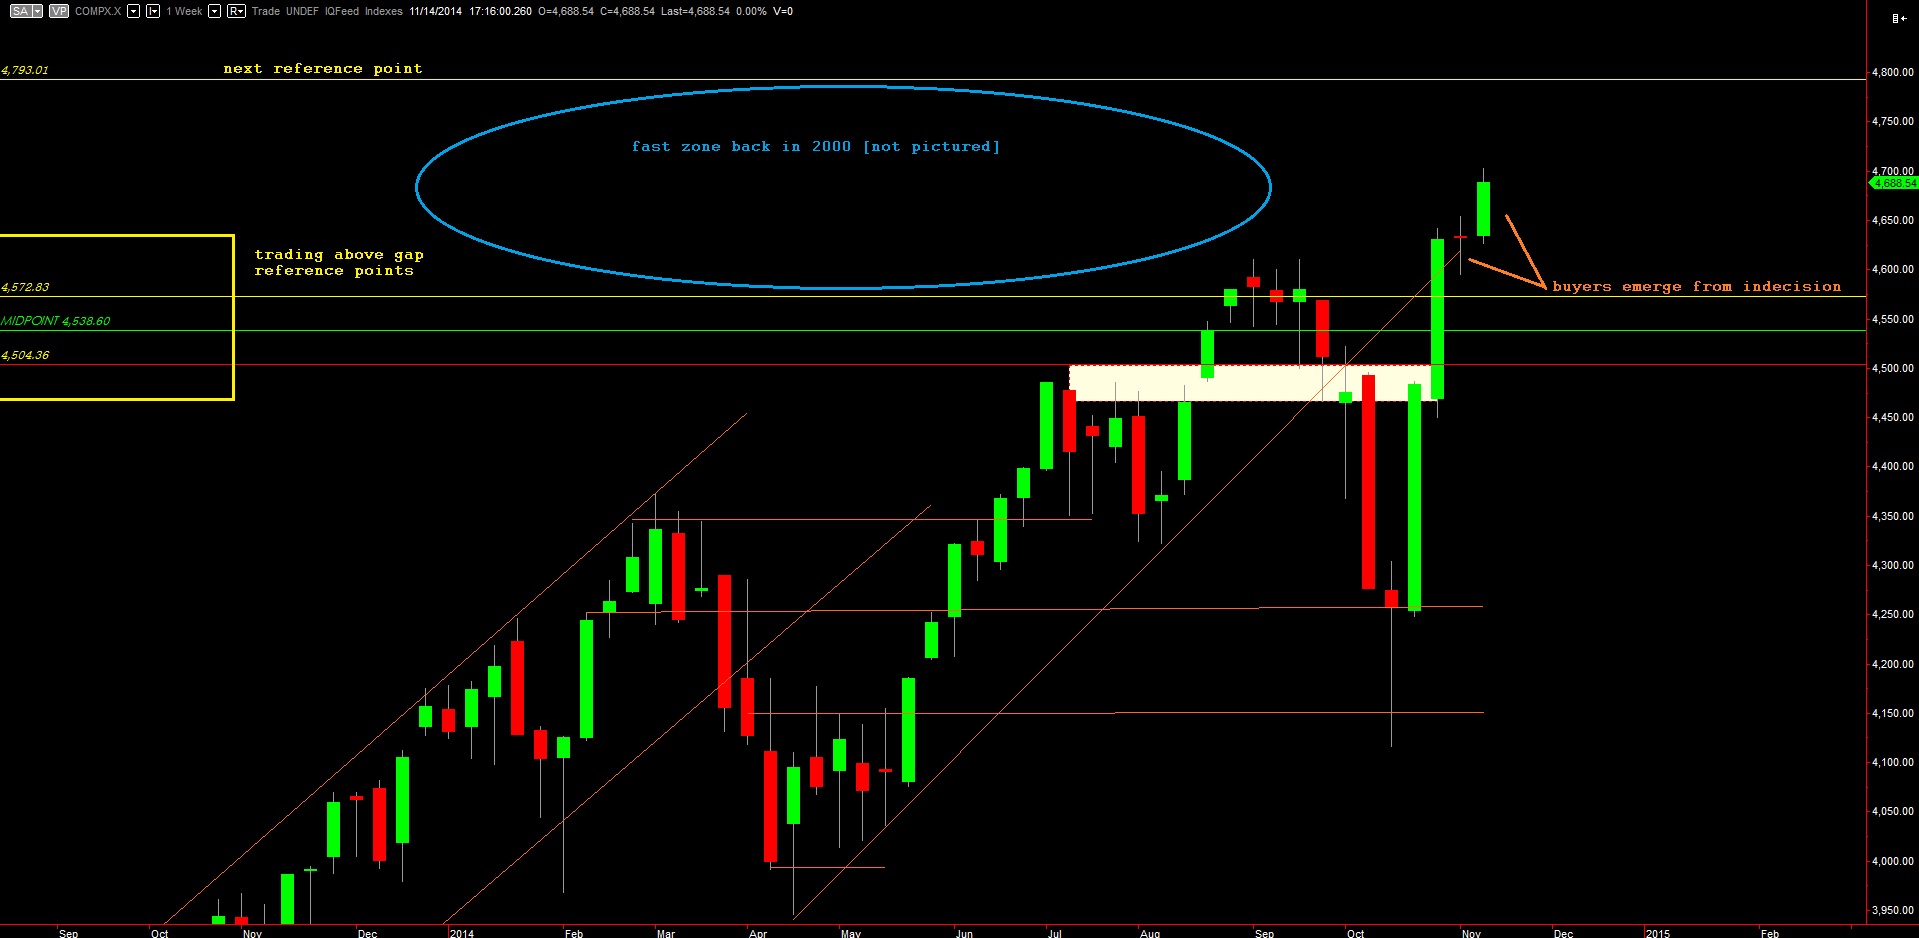
A quick update of the weekly composite chart shows price worked higher last week following the indecision doji candle printed the week prior. We are trading above the now thoroughly auctioned ’14-year gap’ left open back in the year 2000 and are trading in a zone that was fast both upward and downward during the mania of the dot com bubble. See below:

11182014_NQ_Weekly

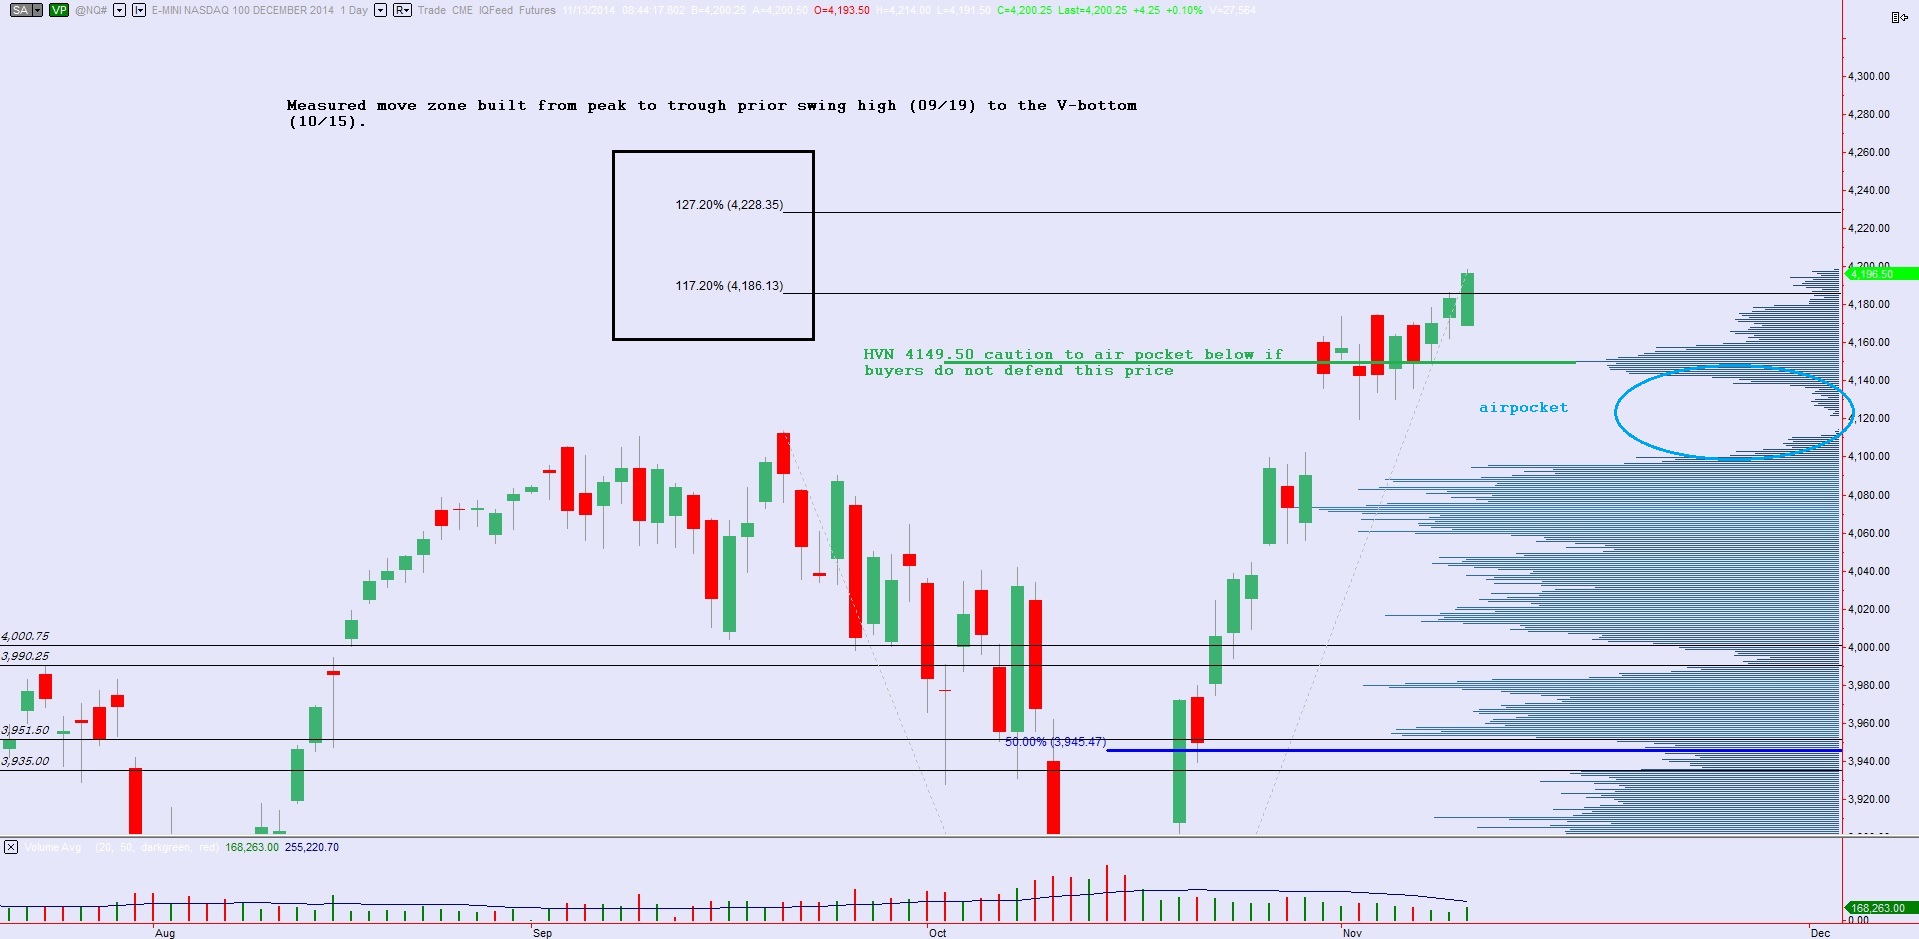
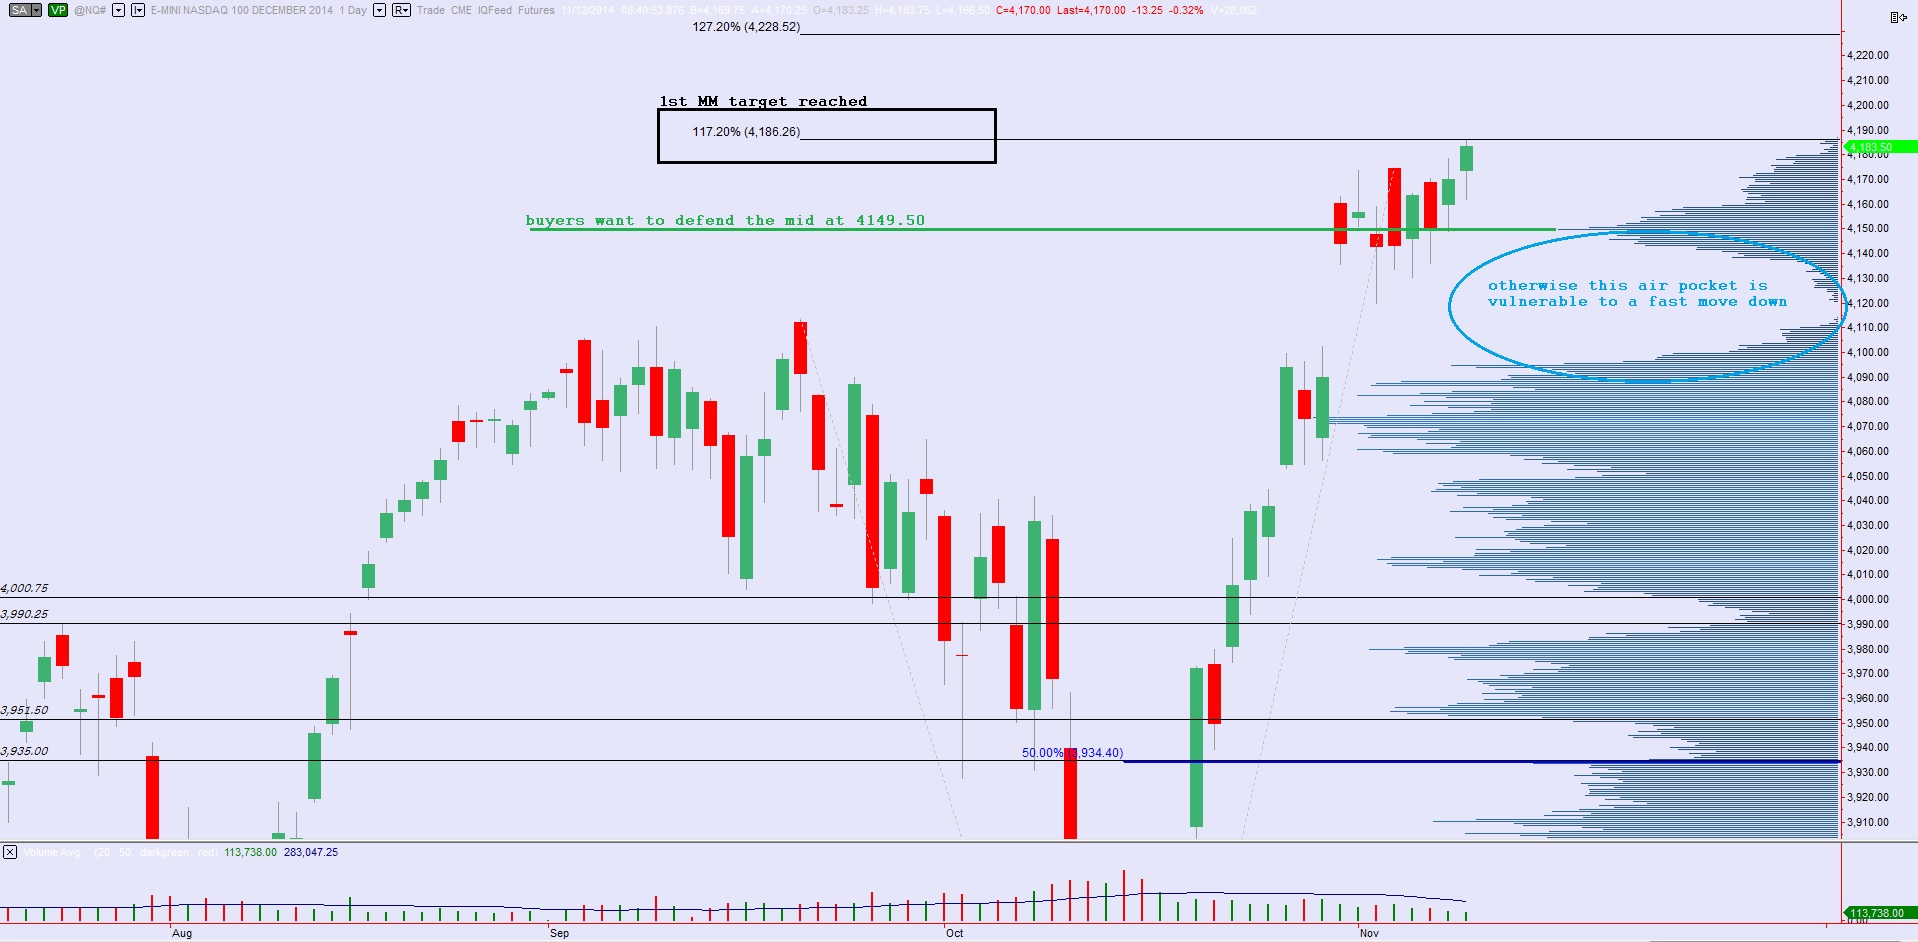
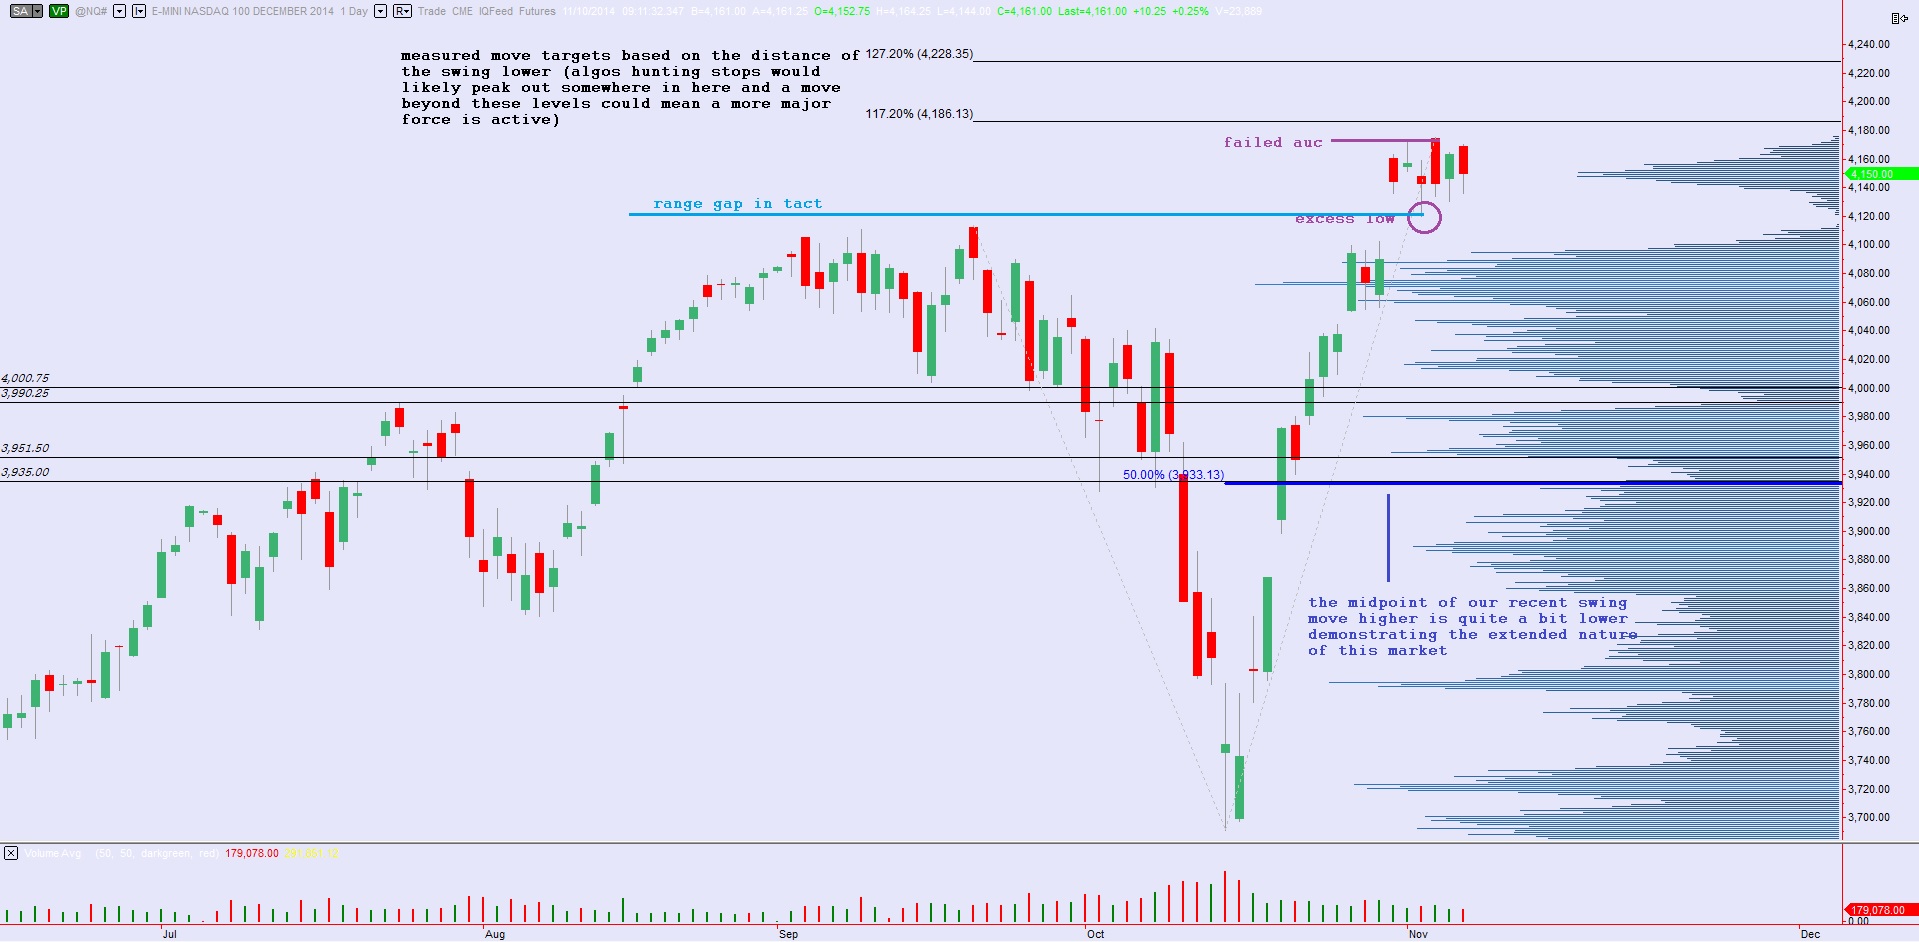
Drilling down to the daily chart we can see just how stretched the market has become. Following a V-shaped recovery in Octobter the market has subsequently grinded higher through the start of November.   We are now trading up at the top end of some broad Fibonacci strokes drawn to assess whether the move higher is primarily driven by stop runs or if in fact it is something much larger. Buyers need to defend above the HVN at 4150 otherwise they run the risk of filling the air pocket 100 Nasdaq points below. I have noted these observations on the following daily Nasdaq future chart:

11182014_NQ_daily

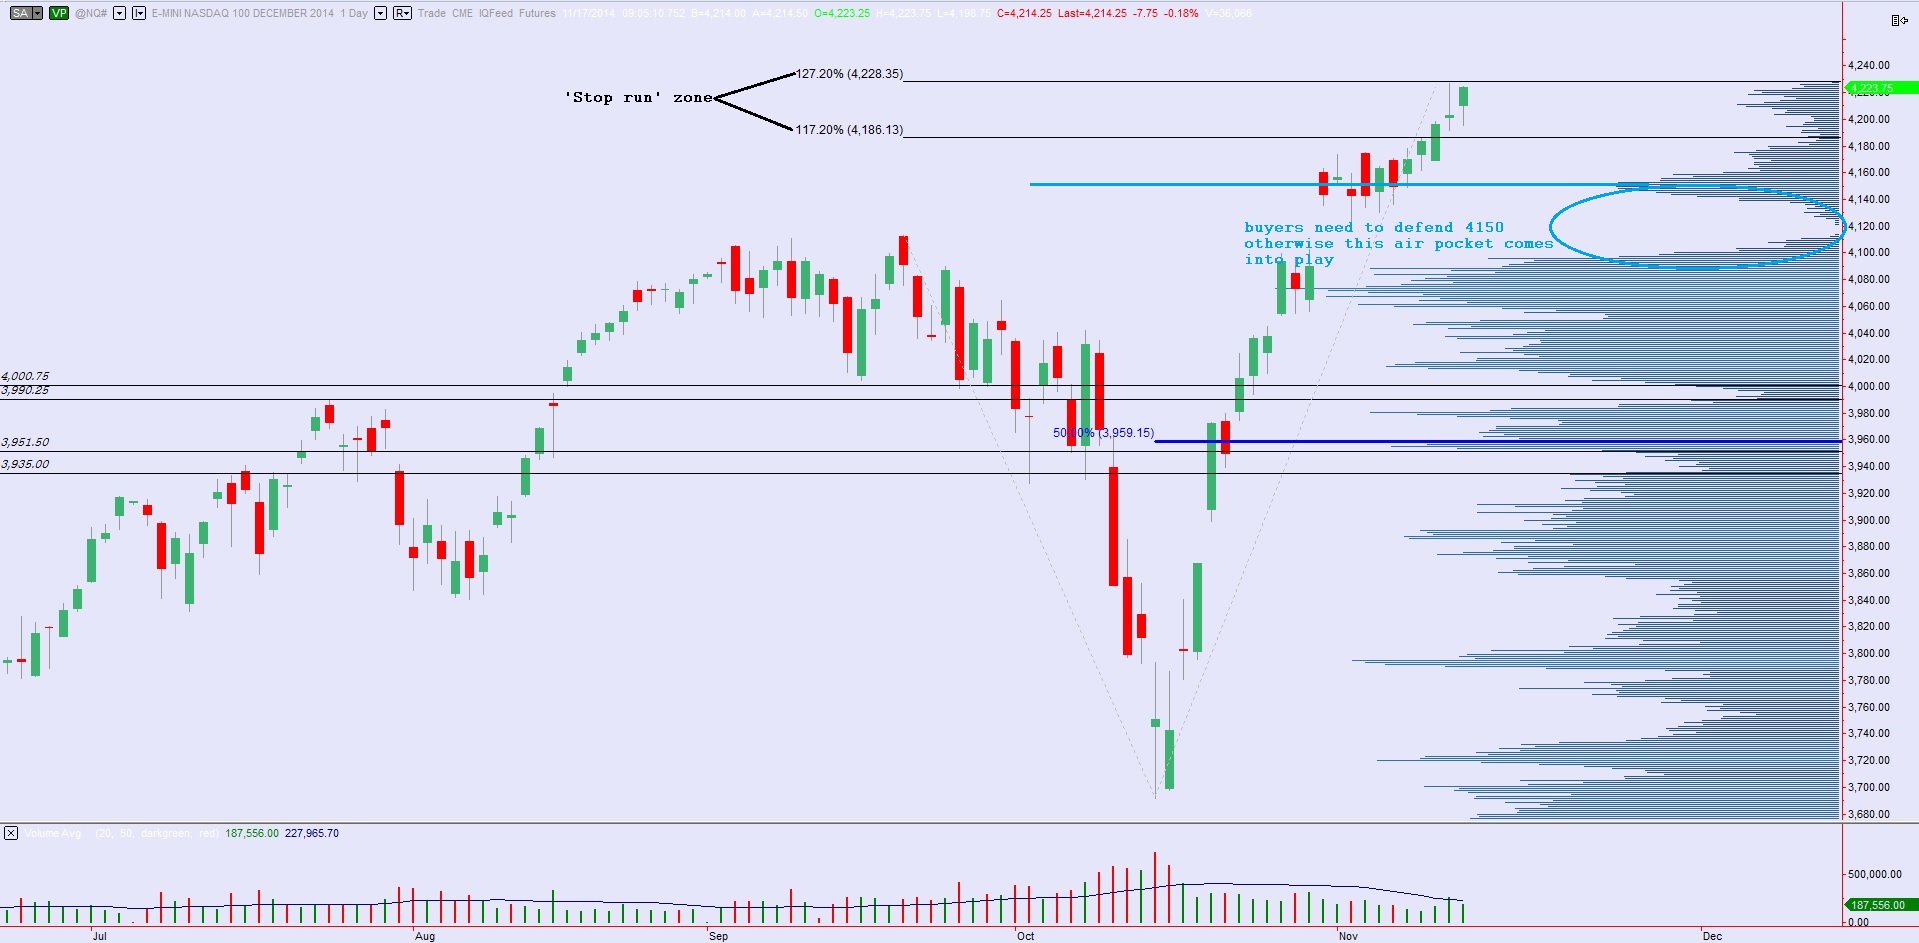
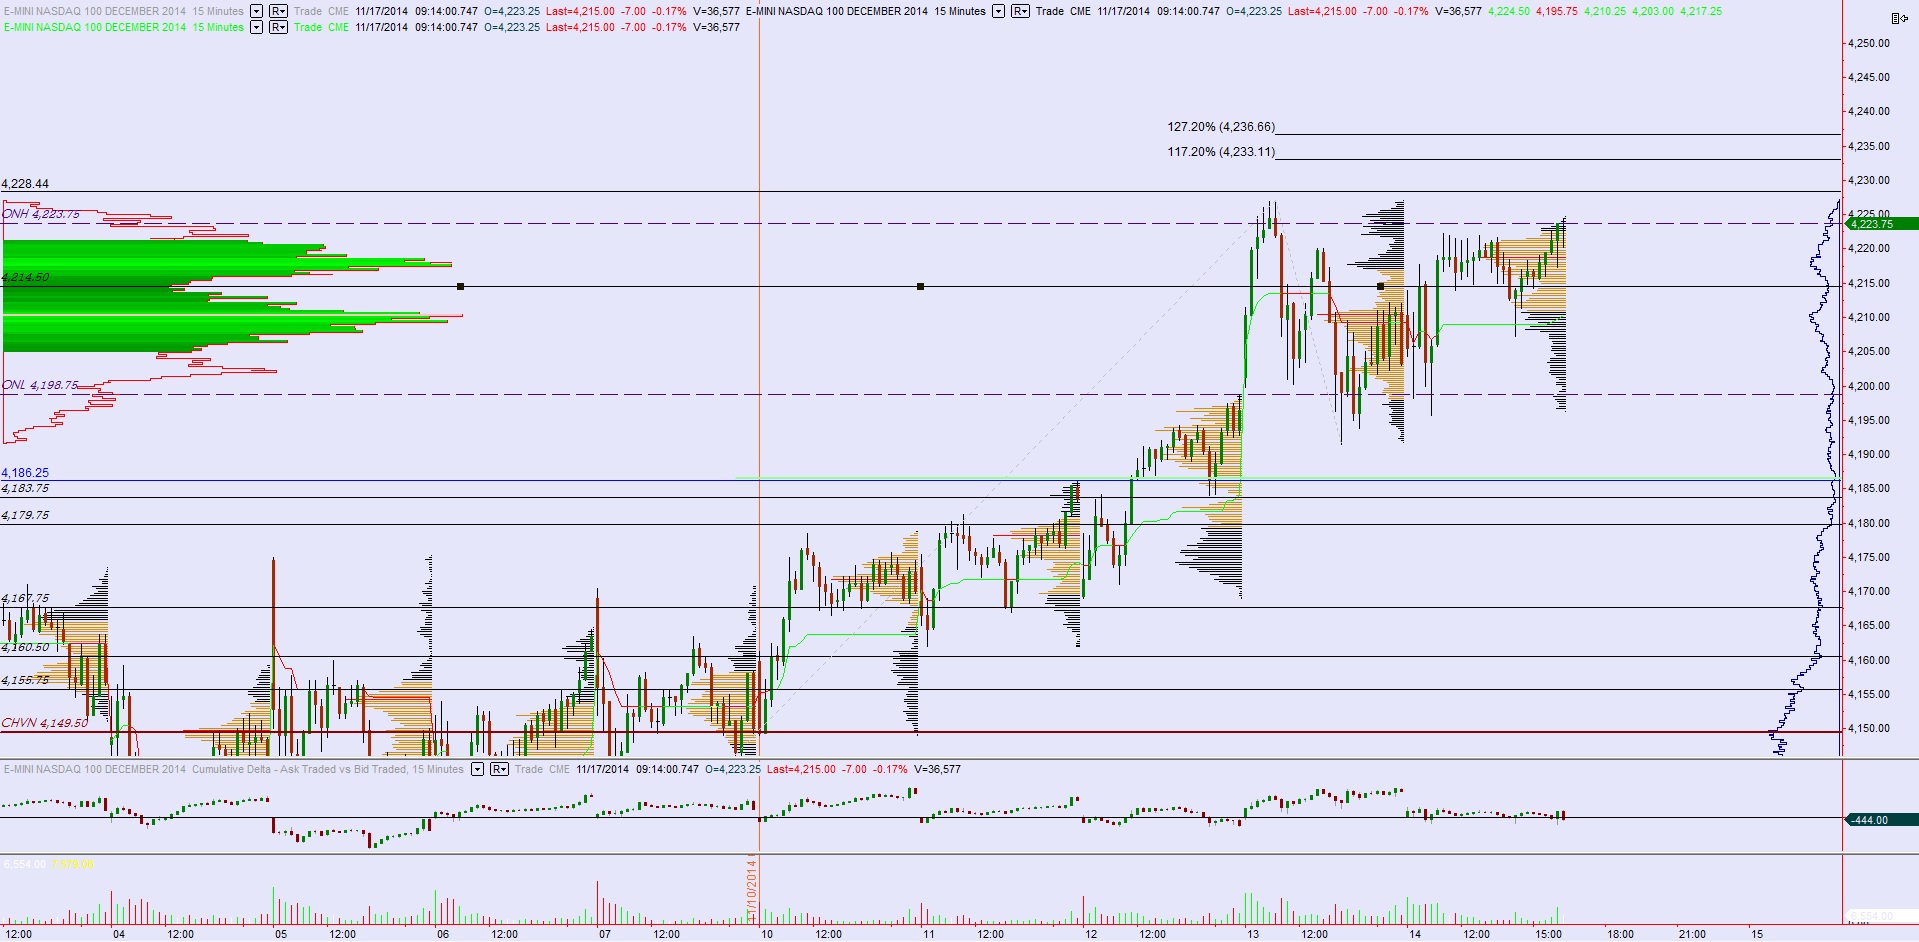
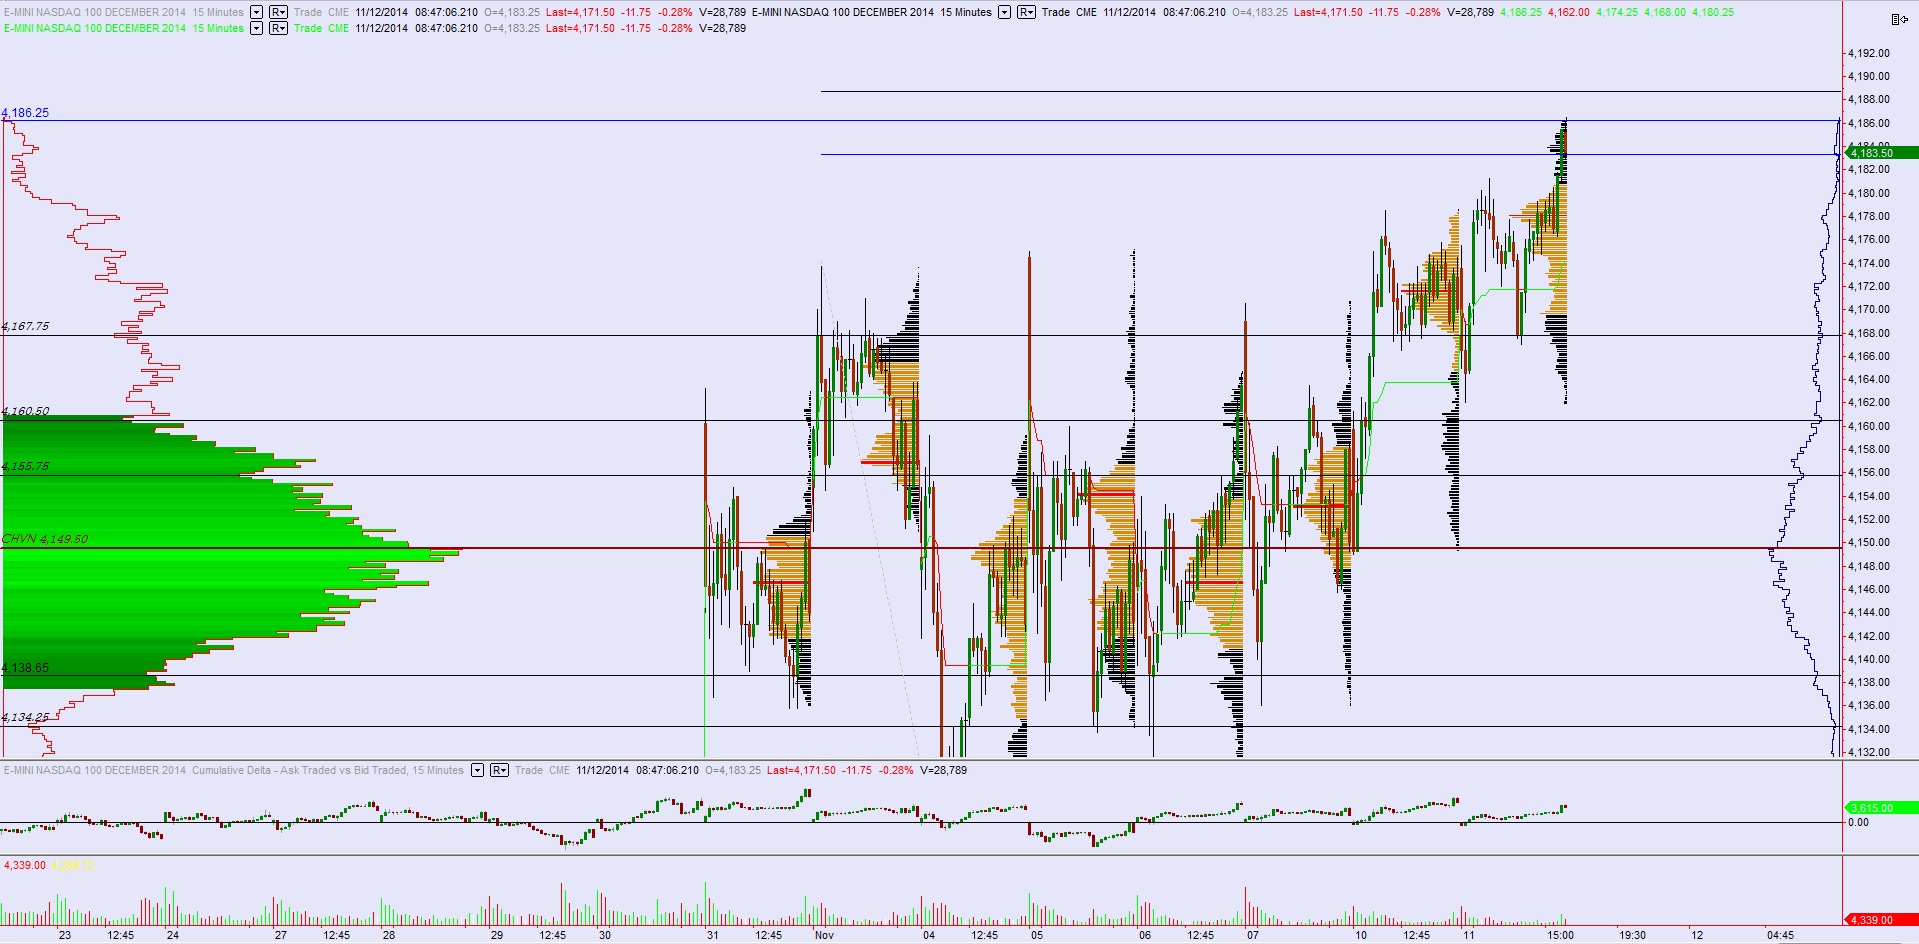
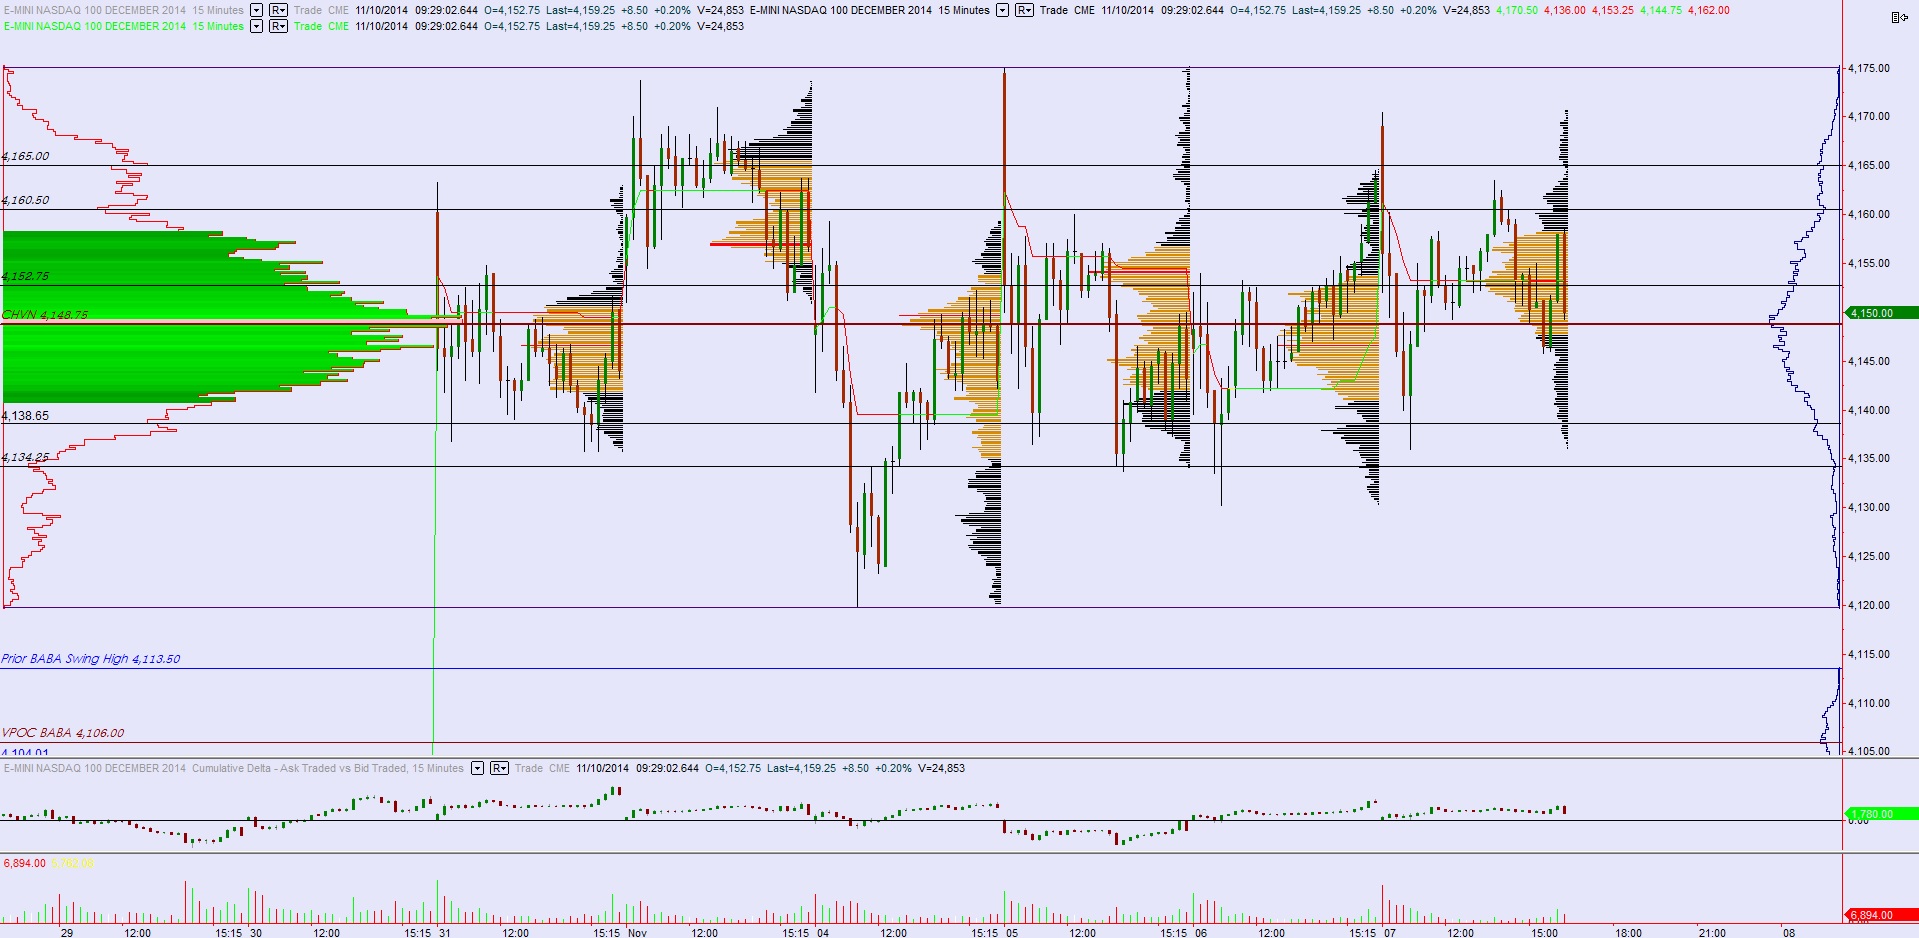
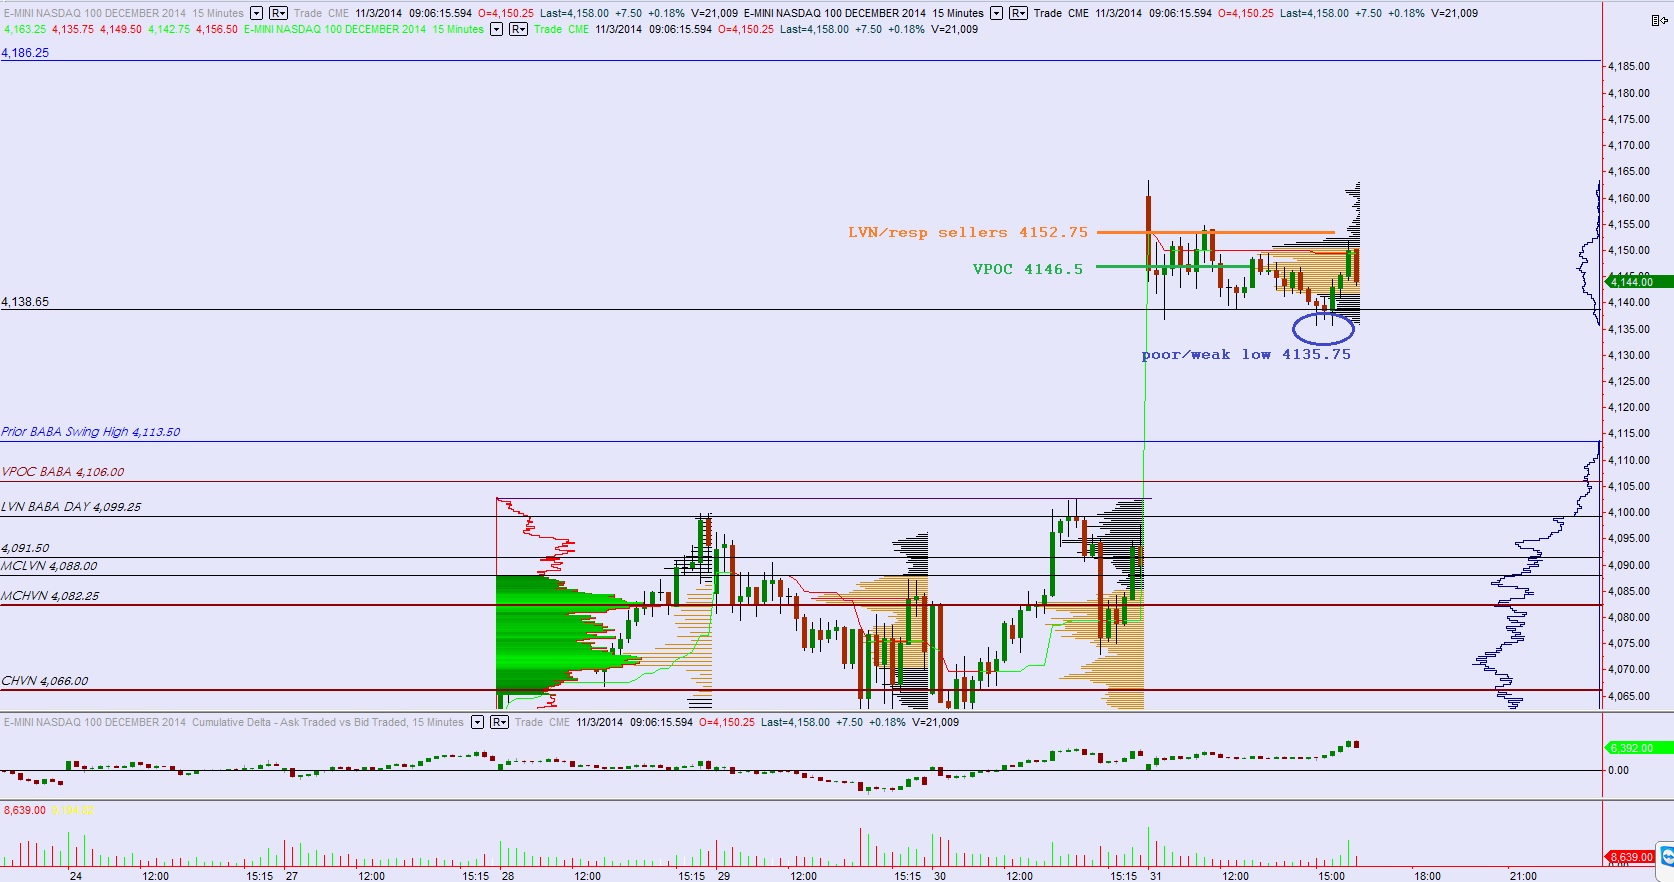
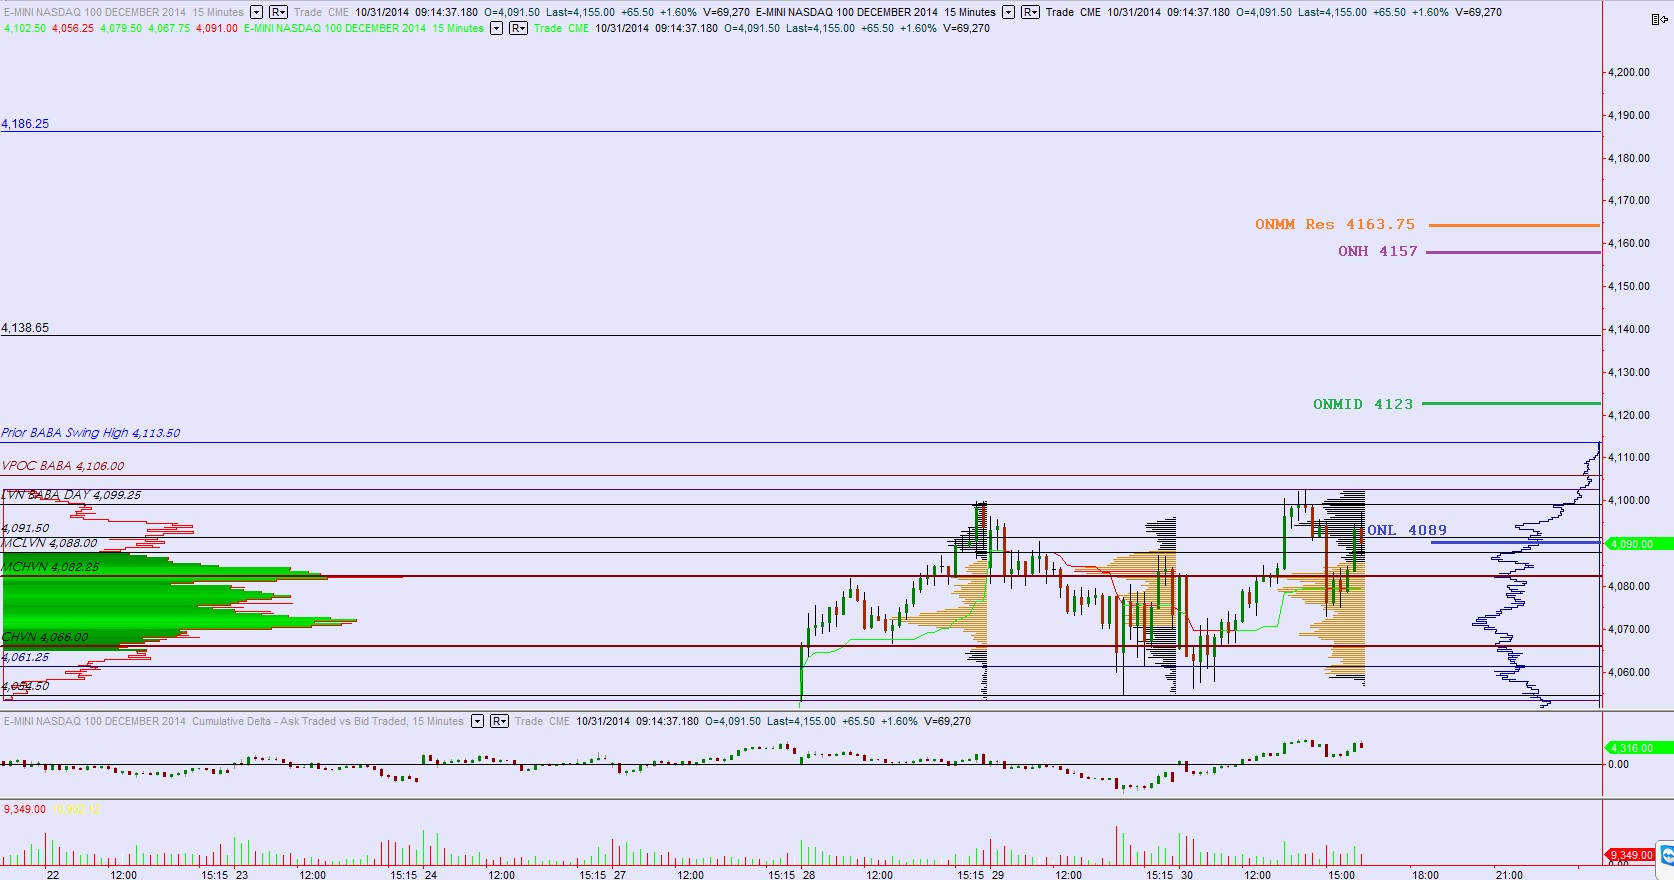
Finally, I have note the key short term levels I will be observing on the following volume profile chart. Note especially the short term LVN pivot at 4214.50 derived from the micro composite on the left.

11182014_NQ_VP

Comments »

Go Go Extendo Market

Extended markets have a knack for continuing in the direction of the move well beyond what would be considered rational.  Mean revision strategies take heat, stubborn traders are slowly forced to liquidate, and eventually prices lurch back when a strong enough opposing force is found.  This is the auction process.  What we have seen this week is four steady days of value progression higher with only a slight sign on excess showing up on Thursday’s tape.  As we close out a week that was focused on retail we are currently trading right in the middle of Thursday’s range and a few points higher from the close.

The market appears to have come into balance overnight and it will be interesting to see how this is treated heading into the weekend.  Unlike the fast v-shape that put us into these last 10 days of grinding trade, we have moved higher on healthy auction activity free of overnight gaps.  We saw some signs of responsive selling yesterday where two waves of selling swept through the market at 11am and 1pm, vital times of day.  Whether that responsive seller is able to turn initiative and press down into Thursday’s range to target the NVPOC at 4190 will be a slight hint.  Even more telling of a market that has found a seller would be prices accepted below the LVN zone around 4183.75.  This is the key short term pivot for bulls.

I have highlighted this level and other key price levels on the following volume profile chart:

111422014_intterm_NQ

Comments »

Show Up Big on Day Three

Nasdaq futures are up overnight with the primary thrust occuing just before midnight.  However as the US has come online prices have steadily declined and given back about half of the overnight progress.  The pullback began around 6am which does not coincide with any economic report or news story but did begin with an overnight failed auction.  Price took out the prior overnight high by a few ticks then quickly reversed.

At 8:30am US initial and Continuing Claims were released and both numbers were a bit higher than consensus expectation.  The initial reaction in the Nasdaq is light selling.

Volumes picked up yesterday and overnight to the highest levels on the week.  Walmart topped earnings forecasts this morning suggesting the US consumer is healthier than analysts expected as we head into the holiday season.

On a daily chart of the Nasdaq futures we can see price has entered a zone where according to measured move analysis there is an expectation of finding sellers.  Measured moves are not as dependable as volume profile and prior price action, however they give a sense of where the market might go to run the stop orders of short sellers.  The globex market is showing signs of effectively finding sellers, however it is more important to see it show up during regular trading hours.  I have noted the above observations and a few more notes on the following daily bar chart:

11132014_daily_NQ

As a general rule, after three days of movement favorable to your bias, it makes sense to take profits.  On the below chart you can see value made a steady three-day progression away from a well-formed intermediate term balance.  This morning might be an opportunity to lock in some stretched stock trades you have, especially if they show signs of pause or reversal.  This will also free capital to initiate fresh risk, if you choose.  I have also noted the very key levels that emerged during yesterday’s session.  Note too how cumulative delta (Ask Traded vs Bid Traded) was unable to remain positive yesterday for the first time since 11/5:

111322014_intterm_NQ

Comments »

Low Volume Stop Run

Nasdaq futures worked lower overnight after yesterday’s action which featured a low volume advance to new highs on the year.  The nature of the move yesterday suggests prices were driven by the shorter timeframe, perhaps a mix of day traders and 2-6 day intermediate term traders, who pressed beyond the highs a bit to run stops.  The question as we head into the tail end of the week is whether buyers can sustain trade above the VPOC of our current balance or if instead we will break through the formation and fill the gap left behind when Japan announced their stimulus package.

A brief spike higher and subsequent fade occurred around 5:30am when the Bank of England released their inflation report, and ahead on the docket for today we have ECB President Draghi speaking at 9am in Rome, and US Wholesale Inventories at 10am.  We are entering the thick of retail earnings today and tomorrow with M, JCP, WMT, and many others set to report their performance over the next two days.

The below daily chart of the Nasdaq shows how prices entered a grinding phase after a strong v-shape bounce.  The slow pace suggests the market accepting higher prices at best and waiting for additional information at the least.  The drift achieved the initial measured move target of 4186.25 to the tick before the close yesterday.  These levels are Fibonacci in nature and serve as guides to whether moves are algorithmically driven stop runs or real progress.  If we see strong selling taking us below our upper HVN at 4149.50 then sellers are opening the opportunity to trade into the air pocket below.  I have noted these observations on the following daily bar chart of the Nasdaq:

11122014_daily_NQ

As cautious as the above statements may seem, the market has several traits supporting the buyers.  Value has migrated higher during the last four sessions, there is no sign of excess on the highs (a wick), and the longer term trend is up.  What buyers lack is strong volume during the advance.  On the below chart I have noted the key price levels I will be observing during today’s session:

111222014_intterm_NQ

Comments »

Three Dimensional Volume

Volume overnight in the Nasdaq futures ran on the low end of normal as prices traded slightly higher on the session.  The economic calendar was fairly quiet with a few data points coming out of Japan.  The Yen trade balance beat expectations while Consumer Confidence is the east was lower than expected.

Most of the discussion surrounding volume centers around time-duration volume and often on a per day basis.  However given the right data, like raw tick data streaming from the IQ Feed servers, you can map other dimensions of volume like at-price and cumulative delta.

Volume at price produces the price levels where our attention might yield an area of interest to gauge sentiment and trade from.  Cumulative delta can show us who is more motivated to take action in the tape.

Yesterday the market gap slightly lower found responsive buyers.  These buyers were responsive to the open, but initiative in nature on the intermediate term.  They initiated risk away from the VPOC of the then 6-day (now 7-days mature) volume profile.  The resulting print pushed value to new highs.

This might be a bit less clear since doing away with the market profile charts.  However they were a bit redundant and using only the below presented chart frees up precious screen real estate and requires one less chart to monitor.  You might not as clearly see it as before, but Monday printed a P-shaped profile suggesting early OTF strength (active intermediate term buyer) which caused a short squeeze.  In the context of a downtrend, these often occur at-or-near a peak.  In the context of an uptrend they are not as effective.  All we know is value migrated higher but is still contained in the intermediate term balance.

The third dimension of volume is delta.  It can be seen in the bottom pane of my chart window and suggests buyers were the more active participants for the entire duration of the session.  That has been the case for six of the seven days of balance up here.  It could mean two things—a large seller is resting on the offer and absorbing all of this demand which creates sideways price action amidst motivated buyers.  Or it could suggest pressure building for another thrust higher.  If we continue to balance and delta cannot flip to negative then we are likely to continue grinding.

I have highlighted the key price levels I will be observing on the following volume profile mashup chart:

111122014_intterm_NQ

Comments »

Fresh Nasdaq Levels and Analysis

Markets move in harmonics and fractals which produce events that are not necessarily repeated but without question have a certain rhyme.  Back in September there was a singular event you could point out on the Nasdaq chart which precluded the multi week trade lower.  Some call it a false move, others a stop run, but in auction theory we call it a failed auction.

The structure can be seen as taking out a prior high or low briefly, testing the waters beyond the reference point, before sharply reversing in the other direction.  It will not always produce the same outcome, however I now have a rule in place that insists I back off until this structure resolves itself.

We happen to have a failed auction print in place on the Nasdaq futures as we come into this week’s trade.  The swing high set during Monday’s trade was briefly breached on Wednesday only to quickly reverse lower.  Both times the new swing high was achieved via a gap higher to new highs which was subsequently faded lower.  The current structure is a bit different from the September event.  Here are the bullet point differences:

  • September’s event was separated by eight sessions of trade and nearly a week and a half of time and volume buildup.  Last week’s was separated by two sessions within the same week.
  • The Alibaba IPO was generating buzz the day the September failed auction took place

Returning our attention to the market, we start with a high timeframe and drill down closer and closer depending on our style of trade.  If you swing trade exclusively you likely only need to drill to the daily chart and perhaps a 15-minute chart for trigger points.

The weekly time frame shows wide indecision last week in a long term bullish market.  We are trading above the “14 year gap” left behind during the year 2000 dot com correction.  The following chart is of the actual Nasdaq composite:

11102014_weekly_NQ

On a daily chart of the front month Nasdaq futures contract (December ’14) we can see prices are trading on an island atop the strong V-shape recovery we recently printed.  An excess low printed and is shown as the long tail on Tuesday’s candle.  The trend over the last 2-3 days is flat while the trend of the last 2-3 weeks is up.  The gap up is still intact suggesting demand for equities remained present during all of last week’s trade.  I have noted a few other observations on the following daily bar chart:

11102014_daily_NQ

The first addition I make when drilling down to the 15-minute volume profile “mash up” chart is drawing a volume profile which encompasses the six sessions of overlapping trade.  This will yield highly potent price levels where we are likely to see market behavior occur.  It also shows the auction health and structure on this time frame.  I have noted these price levels below:
11102014_intterm_NQ

Comments »

Morning Levels

Below are the levels I will be observing as we gap higher into Monday’s range:

11052014_NQ_intterm

Comments »

Back Inside The Auction

Nasdaq futures traded lower overnight in a normal manner.  The largest blocks of order flow were to the sell side and as we approach US trade prices are trading below Monday’s range.  US Trade Balance numbers were lower than expected at 8:30am and received a somewhat muted response—there was a bit of responsive overnight buying shortly after the announcement.  We have Factory Orders set to release at 10am.

Coming into the new month traders had to come to terms with a large gap higher left behind on Friday’s trade.  The Monday trade also went gap up and we spent the entire session unable to close the overnight gap which led to some hesitance to take intraday longs by day traders.  With the market set to open inside of Friday’s range my primary expectation is for buyer to attempt to test higher and close the overnight gap up to 4156.75 before finding responsive sellers who defend the LVN zone from 4161.25 – 4160.75.

I am looking to see how aggressive sellers become and whether they are able to push prices below Friday’s low and if yes whether buyers are found leading to the formation of intermediate term balance or instead accelerate suggesting a sharp reaction of both Friday’s and Monday’s prices.  The upward progress made these last few weeks is stretched and whether the market begins accepting these prices via a slow and sideways balance or instead returns to the fast pace of October will be an important clue to the overall market sentiment.

I have highlighted the key price levels I will be observing on the following volume profile chart:

11042014_intterm_NQ

Comments »

New Month New Risk

Nasdaq futures are flat ahead of US trade after a benign session of trade.  Volume and range are both below the 1st standard deviation of normal which is even more abnormal for the Sunday/Monday globex session.  As we enter a new month of trade the markets are working through earnings and we have a few economic events on the calendar.

Coming up today at 10am is ISM Manufacturing.  Tuesday premarket we will hear US Trade balance and at 10 US Factory orders.  Also after hours Tuesday, BOJ Governor Kuroda speaks in Tokyo and the verbiage will likely be scrutinized after last week’s stimulus news.  Wednesday premarket we have ADP Employment change which has been less consistent than in the past followed by 10am ISM Non-manufacturing Composite.  After hours Wednesday are BOJ October meeting minutes.  Thursday premarket we have ECB news including rate decision and a Draghi press conference.  And Friday premarket we have monthly Non-farm payrolls and US unemployment rate.

On a weekly chart of the Nasdaq Composite we can see the sheer size of the green candles printed the last two weeks.  These two candles suggest the hammer candle printed three weeks back is confirmed as a short term low.  Even if it was not, the distance traveled means sellers have their work cut out to revert long term control into their favor at the best or into balance at the least.  For now, the long term time frame is bullish.  Note also how we are back trading above the ‘gap-zone’ from 2000:

11032014_weekly_NQ

On the shorter term, we can see how the market spent three days building balance before the gap higher on Friday.  This balance is best seen as the green volume profile positioned to the left.  I have noted some measured move targets which, oddly enough, one of the targets from Friday morning ended up being an area where the market found support.  I have less conviction in these levels than auction/volume profile levels, but they do serve as a frame of reference when we trade in an area lacking price history.  I have noted these levels and a few other observations on the following volume profile mashup:

11032014_intterm_NQ


Comments »

Pro Gap Into Month End

Nasdaq futures were thrown out of balance overnight after the Bank of Japan announced they were expanding their massive stimulus package.  The reaction was large enough to put the index to new swing highs meaning participants are coming to market this morning at prices dramatically different from the closing bell. The volume and range on the globex session are beyond normal as you might expect putting us in pro gap territory.

On the economic calendar for today we have Chicago Purchasing Manager at 9:45am and U. of Michigan Confidence stats at 9:55.  We are also in the thick of earnings season as the month-end trade takes us into the weekend.

Prices at the open will be trading levels unseen since March of 2000.  Given the lack of price history available, I need to work using available support levels and measured move targets.  I have noted the measured moves and support levels I will be observing on the following volume profile mash up chart:

10312014_intterm_NQ

Comments »