iBankCoin
Home / Volume Profile (page 119)

Volume Profile

Settling Unfinished Business

Sellers gained quite a bit of confidence yesterday.  The day started with responsive selling into the overnight strength which morphed into initiating selling for the rest of the day.  The session ended up printing a new swing low and solidified the seller control on the intermediate term timeframe.

The long term timeframe is still buyer controlled in the NASDAQ composite even through this selling.  This can be seen as a series of higher highs and lows on the weekly chart.  We are watching the market follow through this week on an outside candle print two weeks back.  The outside candle print often occurs near inflection points.

The intermediate term is seller controlled.  I had to rebuild my volume profile back to November 25th to get all the data needed for a proper composite profile representation.  I have highlighted some key levels and observations on the following intermediate term volume profile chart:

NQ_VolumeProfile_intermediateTerm_03272014

The short term auction is seller controlled.  Value is being pushed lower and prices are testing lower into areas of unfinished business (naked VPOCs).  I have highlighted the key levels I will be watching today, as well as a few scenarios on the following market profile chart:

NQ__MarketProfile_03272014

Comments »

Sellers Abate as Balance Takes Shape

NASDAQ futures are higher overnight and we are currently priced to open inside of yesterday’s range but outside of value which presents an elevated potential for big intraday moves.  The overnight profile is also interesting because it shows no real consensus on value.  Instead we have a toothy profile with buyers pushing higher.

Price traversed through the volume cave which delineates where our upper-most intermediate term balance zone exists.  We are currently trading just above it which creates the potential opportunity for an overnight gap fill more possible and rapid due to the low volume structure beneath our current pricing.  The intermediate term is seller controlled but showing signs of balancing.  Yesterday morning sellers were unable to press to new lows verses Monday.  Instead we stabilized at a low volume node just above the Monday low and reversed higher.  Sellers need to prevent acceptance of trade above 3645.75 to sustain their control of the intermediate term. The long term auction is still buyer controlled as seen on a daily chart.  I have highlighted this key price level and the volume cave below on the following volume profile chart:

NQ_VolumeProfile_intermediateTerm_03262014

The short term auction is out of balance and buyer controlled.  This can be seen as value migrating higher.  Buyers need to make a new high above 3645.75 (overnight high) to firm up their control in the short term.  I have highlighted this level and a few potential scenarios on the following market profile chart:

NQ__MarketProfile_03262014

Comments »

Day Trader Environment

The NASDAQ futures are higher overnight, drifting quietly through the globex session after buyers put together a decent bounce yesterday afternoon.  As the USA comes online, prices are currently trading just above the afternoon swing high.

The long term auction taking place in the NASDAQ composite has become an interesting picture.  On one hand, the weekly chart is very much still in buyer control.  The series of higher highs and lows is still intact.  Yet the weekly chart offers us a bit of contex that we continue to watch develop. Three weeks back it printed an outside candle and this week has the potential to confirm it to the downside.  Of course, this is very early speculation since we have only seen one trading day, but something to keep in mind nonetheless.  The daily chart suggests buyers are still in control but with a more confident seller pressing down below recent support.  We have not seen a swing low support broken since late January.  In that instance the market quickly V-shape recovered, should one expect the same outcome again?

The intermediate term auction is seller controlled.  This can be seen as a series of lower highs and lower lows.  The sellers also pressed us out of the intermediate term balanced volume profile.  There now exists a large void in volume where the lower end of balance once existed.  It would not surprise me if price were to traverse this area several times the next time we come to it before the market ultimately decides which side of the cave it wants to trade on.  I have highlighted this volume cave and some other interesting observations on the following volume profile chart:

NQ_VolumeProfile_intermediateTerm_03252014

The short term auction is buyer controlled.  We saw responsive buying yesterday afternoon which resulted in some tail prints which demonstrate strong demand.  When the NASDAQ came into the bell while forming balance and that profile print has a long tail on it also.  There exists a stronger potential for an opening drive this morning for two reasons.  First, the market is currently trading only a few points below the volume cave highlighted above (intermediate term).  Second the market profile prints are single prints like a zipper, and prices tend to run right up these.  Thus, any aggressive attempts to fade early strength are at an elevated risk of a drive.  Otherwise,  we have a solid profile structure to trade against below us.  The play would be to short into any early overbought positions and target an overnight gap fill.  If price trades inside of the prior value for an hour, find another entry onto the short side to trade through value to the VPOC and then the VAL.  I have highlighted this trade as well as a few other observations on the following market profile chart:


NQ__MarketProfile_03252014

Comments »

The Discovery Process

Yesterday we saw the effects of overhead supply and how sometimes the weight of said supply becomes too great and liquidation ensues.  Many a market commenter will cite the Fed meeting as the reason for the move, but an understanding of the auction and balancing process yields the potential directional bias of the market.  An event such as the Fed simply accelerates the process of price discovery.

The long term auction continues being controlled by the buyer.  This can be seen clearly on a weekly chart of the NASDAQ Composite index which shows a pattern of higher highs and higher lows dating back to October 2011.  The daily chart suggests a similar buyer control with prices continuing to hold their recent low around 4200.

The intermediate term auction is in balance.  When we sold off yesterday afternoon, the market was able to find a higher low.  Responsive buying down inside Monday’s range was forceful enough to reverse the directional liquidation occurring.  Price eventually settled near where we hypothesized value to be yesterday morning, 3678.25.  I have highlighted the inflection points which resulted in the market coming into balance, as well as a few key action price points on the following volume profile composite:

NQ_VolumeProfile_intermediateTerm_03202014

The short term auction is in balance.  I have traced the movement of value since Monday and you can see it drifting and consolidating much like a sine wave with increasing frequency.  Sticking with Monday, 3/17, we left behind a naked VPOC at 3644.50.  This level may be targeted by sellers today should we see any follow through by them.  Overall my expectation is for the market to chop about and settle a bit early on before deciding on a direction.  I have highlighted a few levels I will be watching today as well as a few scenarios on the following market profile chart:
NQ__MarketProfile_03202014

Comments »

Trading The Overnight Strength

Equity futures printed an abnormally large range overnight, one that began with a selloff before finding strong responsive buying activity which triggered a rally in the Globex hours.  As of this post, the NASDAQ futures are set to open inside of Friday’s range but outside of the value area set Friday.  These conditions are slightly out of balance and present an elevated risk/reward environment.

The long term control of the auction is buyer controlled.  This can been seen on a weekly chart of the COMPQ, however the daily chart is not as clear.  The daily chart still presents a picture of buyers in control, however that control is being tested as we made a slight lower low on Friday verses March 1st.  This week we will be closely monitoring any sort of bounce that materializes and the potential of price to form a lower high.  This would change the character of the long term auction from being buyer controlled to balance.

The intermediate term timeframe is seller controlled.  We have seen prices make a series of lower highs and lower lows dating back to March 7th.  The price action has been fast and choppy with the momentum edge favoring selling.  Price slid out of balance Friday and closed near the lows.  Above we have a large overhang of supply.  How the market reacts to this supply will be telling this week.  I have highlighted the intermediate term volume composite on the following volume profile chart:

NQ_VolumeProfile_intermediateTerm_03162014

The short term auction is balanced.  We have overlapping value areas and price stabilizing inside of these value areas.  The overnight inventory is long, thus I am looking for prices to press into these overnight longs.  Early on, I will be on watch for a gap fill trade back down to 3621.25.  If you refer to the intermediate term profile above, you can see we are set to open on top of a volume cave.  Price can quickly move through this area which would aid sellers in pressing for the gap fill down.

I have envisioned a scenario for today on the following market profile chart:


NQ__MarketProfile_03172014

Comments »

Vlad Takes A Headshot

shark

I love people who catch a great entry into a setup, the setup finally confirms, and they take profits. That is like driving to an amusement park and then staying in the parking lot to listen to AM radio. Sadly, this greed to snatch at table scraps is how most deals are blown. Go for the big deal—slowly if you must, but always with a strong sense of urgency.

I was out of cash at one point today, but decided to scale off some profits in LO. I have no idea whether the news is of the rumor variety or not, but word is someone wants to gobble up LO. And I can’t blame them, Lorillard separated from the herd charging the pot of gold at the end of the vaporizing rainbow with their Blu product offering. The fact that they sell delicious and powerful Newport’s in the meanwhile is moot—everyone knows that. The key is to parlay your cash cows into new evil ventures, like a doctor…evil inventions like disposable atomizers which allow humans to inhale nicotine and airplane deicer. It was an excellent allocation of resources and the execution was top notch. These are the types of management teams I want to be involved with.

So I have some cash now, and want to get it back into the game. I started getting into some ASCO stocks this morning, whetting my beak with shares of IMGN. I have another name on my radar, too.
I back to basis with my newest cannabis positions PHOT and GRNH. This is technically my “second entry” into this trend/pump, because I started by ripping a big win out of MJNA. This is the most absurd thing I have ever done, holding degenerate OTC paper on companies engaging in criminal enterprise. But, hell, people have earned fortunes doing worse things then speculating. I just want my piece.

“You dig?”

There is a big, dark cave crevasse just below where the market stands and everyone is jumping up and down like BassNectar just dropped the grimiest growl of bass in his repertoire. I suppose this has me keeping a clear eye on the LED lit Exit signs.
Want to see the cave? Here, ga’head:

NQ_VolumeProfile_intermediateTerm_03042014_CAVE

My hands are shaking, my hearts beating, but I am still moving, and I am still getting headshots.

Comments »

Fill The Cave

Equity futures are currently priced to gap up after printing over 40 handles in range on the NASDAQ.  As I write, prices are coming in a bit, and by the looks of both the intermediate term balance profile and the overnight profile, the action could be fast this morning.

Yesterday’s context report focused on the intermediate term balance, and whether price would stay in balance on the intermediate term or instead begin exploring lower.  Bracketed (or balanced) trade can be very frustrating noise for the trader if they are not aware it is occurring.  It can result in unnecessary capitulation and overconfidence at the extremes prior to getting faded.  The last two sessions in the NASDAQ have effectively set the floor and the ceiling for our balance zone.

If you have ever seen a live auction, you have seen this action.  Yesterday the market pressed lower in search of buyers.  They were found in the form of a sharp reaction.  Once a baseline bid is established, price can very rapidly move in the opposite direction to form the extremes of an auction.  Now market makers and specialists and hedge funds and retail participants meet and hash out the details of this balance to determine if the value is an accurate representation of the NASDAQ or not.

Long term auction is controlled by the buyer.  This can be seen as a series of higher highs and lows on a daily and weekly chart of the $COMPQ.  Yesterday we nearly brought the long term into a balance scenario, but we managed to print a higher low.  We need to monitor any retest of yesterday’s low very closely, and we need to consider reducing exposure should price be accepted below perhaps yesterday’s open at 4261.42 (on the $COMPQ).

The intermediate term auction is in balance.  This balance stretches back to 02/13 when we broke above the neckline of a V-shape recovery.  We are currently prices to open inside a cave inside the intermediate term auction.  Price will move fast in this low volume environment, at least initially, and often times we spend time filling these voids in prior to exploring elsewhere.  Intermediate term balance is aging, and a move away from it becomes more likely with every half hour that goes by.  I have highlighted this cave feature and some other observations on the following $NQ_F intermediate term volume profile:

NQ_VolumeProfile_intermediateTerm_03042014

We covered tons of ground, in the short term, but buyers are back in control.  This can be seen via the migration of value higher over the last few distributions.  However, the last two profiles suggest a slight downside imbalance exists.  It would not surprise me to see some backfill early on.  Given the overnight inventory is long, it would make sense to press into that inventory and test its conviction.  Conversely, should we see an opening drive, we can begin to consider the long term timeframe reentering the market, and we should join them.  I have highlighted the imbalances I expect to see resolved on the following market profile chart:

 NQ_MarketProfile_03042014

Comments »

Morning NASDAQ Trader Report

There has been solid overall auction activity overnight where we are seeing constructive action from both the buyer and the seller.  Late into trading Friday the sellers rejected the uppermost distribution we were forming.  Their action could be seen as a swift vertical movement lower followed by an hour of “acceptance” of the new prices via sustaining the levels.  Once the futures opened back up for business, we gave the area a solid auction lower, found a bid, and pressed above where we are currently finding selling.  The net activity forms a nearly symmetrical distribution of time and volume.

The profile however, does appear to have a slight imbalance which sellers could capitalize on early this morning.  It appears to be contingent upon how we handle 3674.50 early on, a value area low and sight of prior responsive selling.  If we again find sellers here in the early USA hours, we may see an attempt to balance out our current profile by trading down below the volume shelf at 3664.25.

Of course, if sellers are unable to respond at 3674.50, then we may see another drive for fresh highs.  Also, if sellers cannot push us over the volume shelf to balance out our current profile, then we would gain a valuable bit of insight, that buying force is great enough to disrupt the natural tendency of Gaussian distribution.

In the short term, I give sellers a slight edge in control.  This is void if they do not show responsive trading at 3674.50.  This short term control by sellers firms up if they push us below the shelf at 3674.50.

Intermediate term, we are in balance.  I have highlighted this balance and a few key levels on the following micro composite profile, spanning about 6.5 days of trading activity:

NQ_VolumeProfile_intermediateTerm_LateFeb2014

Long term, buyers are in control.  This can be seen as a series of higher highs and lows on the daily and weekly COMPQ chart.

Below is my vision for the morning, where I have highlighted the key price point and a scenario for the session using my market profile chart:

NQ_MarketProfile_02242014

Comments »

Morning Scenarios

Index futures went for a ride overnight, with the S&P trading a 22 handle range and the NASDAQ trading over 45 points.  There were several macro influences affecting the action as the market was given plenty of information to digest in the overnight hours.  From the volume profile distribution that was printed, I can see there was no consensus reached.

Overnight, we are out of balance with sellers asserting control.

For traders, a market out of balance creates the greatest amount of opportunity.  However, this is a high risk/high reward environment where tight stops, although prudent, are vulnerable to random market noise.  The best strategy is often smaller position size with a larger profit target and stop loss.

Interestingly enough, we are currently set to open inside of yesterday’s value area which would typically mean we are in a low risk/reward environment.  Should we sustain trade between 3500 and 3486.50 on the NASDAQ, we may see a very aggressive chop-like trade.  This scenario would make sense, a violent waiting room ahead of the 2pm FOMC meeting announcement.

Another scenario would be for the intermediate term sell control to reassert itself early on and drive prices lower to 3474.25 then 3462.75 and ultimately to the naked VPOC at 3458.  This would fit into the discouragement framework noted yesterday morning.  If instead price continues to drive lower, cutting through 3452.25, then we are likely to see an acceleration of selling and may be entering the true panic phase of correction.  With the market movers at the FOMC on tap, this possibility becomes greater, however this is still scenario number two for the day.

A third scenario is the long term timeframe entering the market and driving higher. This would require sustaining trade above 3527.25.  I have highlighted these levels on the following intermediate term volume profile chart.  I have also attached a daily volume profile for insight into a possible chop trade.


NQ__VolumeProfile_01292014


NQ__VolumeProfile_01292014_dailydist

Comments »

Correction Road Map

In order to succeed in any business venture, be it trading or startup or corporate monotony, one must have a plan.  It does not matter if the plan is perfect.  Once you have a plan, you can respond to live conditions as needed, always returning to the plan drawn out during a calm state-of-mind.  There is no free lunch ever, and with trading you can end up being lunch.  The best traders I have ever met work incredibly hard.  If you want to succeed, you should too…and have a plan.

We are working through a correction.  It just so happens this correction is different than all the others because it is happening in January after a strong year.  It is also happening with a backdrop of negative news flow—no surprise there.  It is also happening on a macro level, with currencies and volatility rearing their lovely head back into the action.  This is all very fun, you see?

I tune out all of that.  I am trading stocks, many of which are nestled in the NASDAQ 100.  Therefore, the behavior of this one indicator can tell me more than any news channel or derivative.  I understand being very micro and treating every stock as its own situation, but at the least I will build a framework (read plan) for assessing the index.

First, I run through the control.

Long term control – buyers: this can be seen on a weekly chart.  Price has made higher highs and lows since last January.

Intermediate term control – sellers: yesterday’s action put price below recent lows, pressing price out of intermediate term balance.  The sellers now control the intermediate term timeframe.

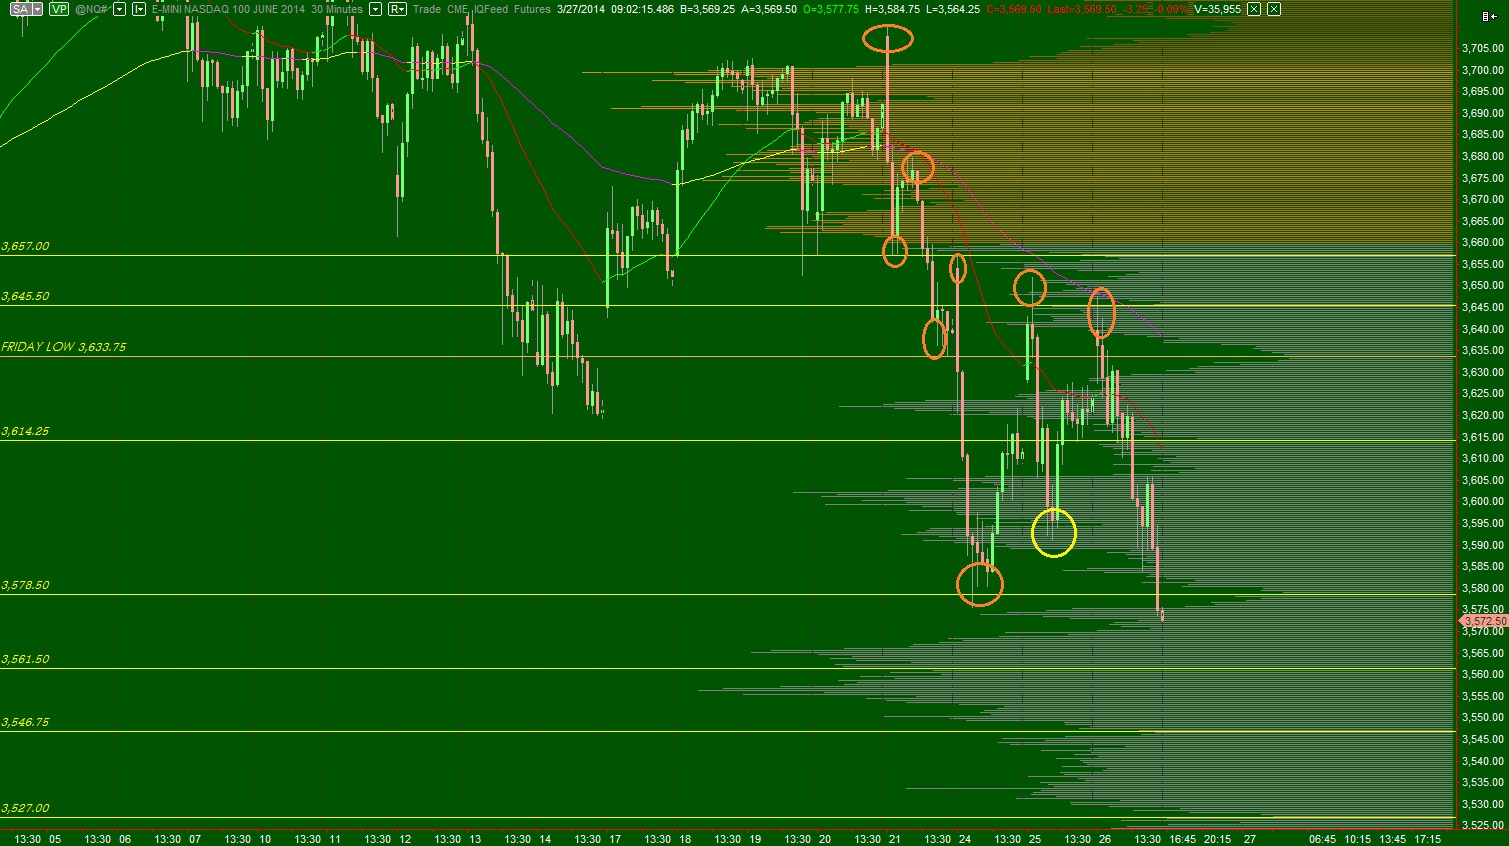
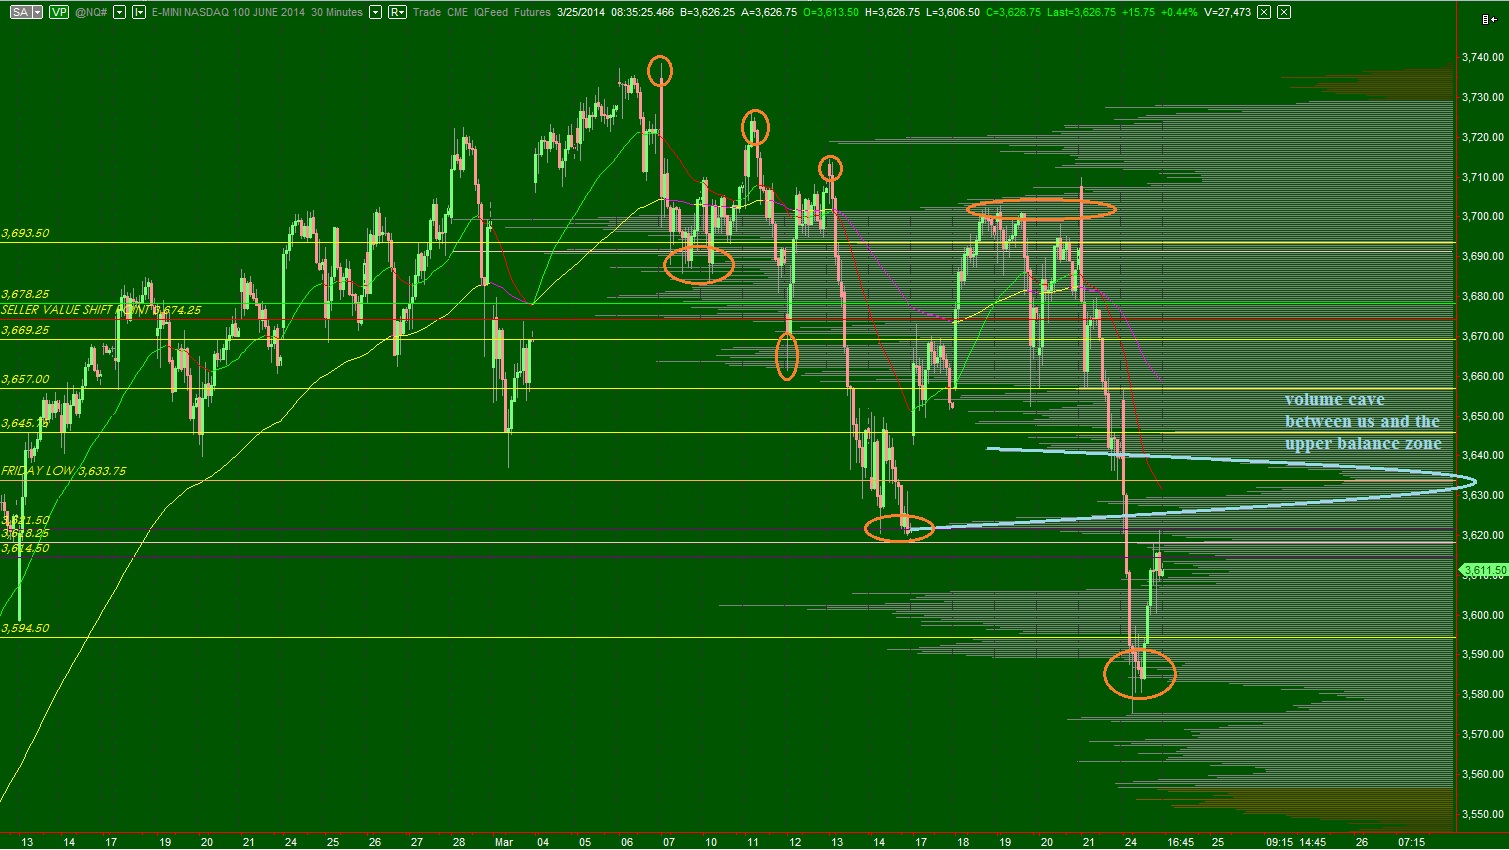
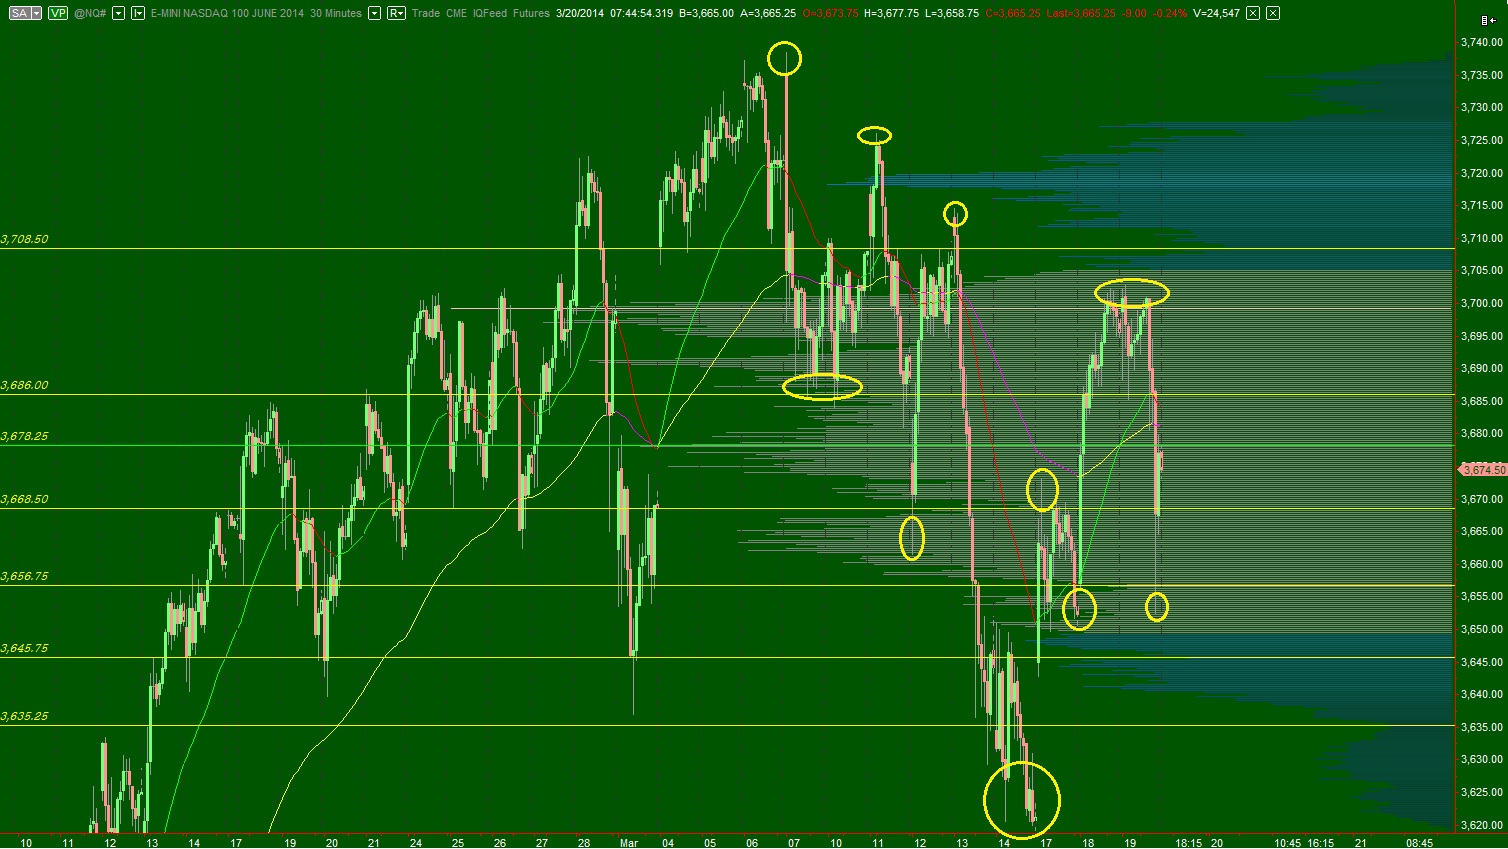
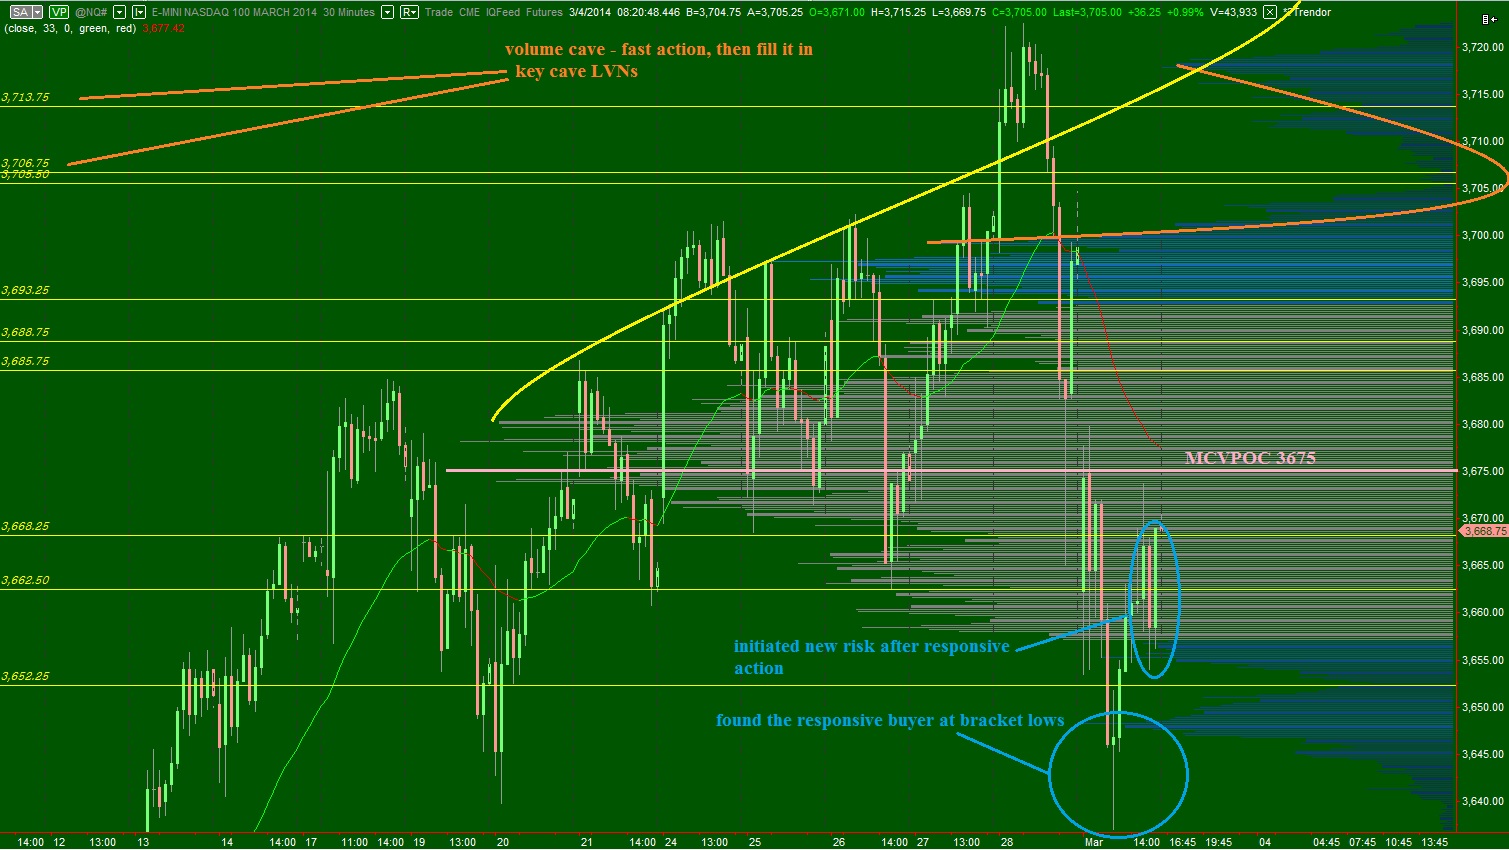
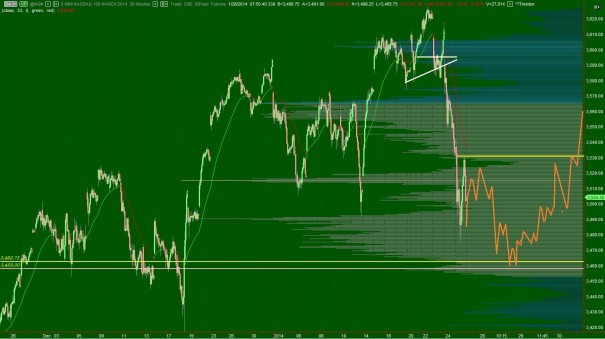
Short term control – sellers: the price action over the last three days has been dominated by sellers.  This can be seen in market profile via selling wicks, range extension lower (price trades lower than the first hour of trade), and value migrating down.

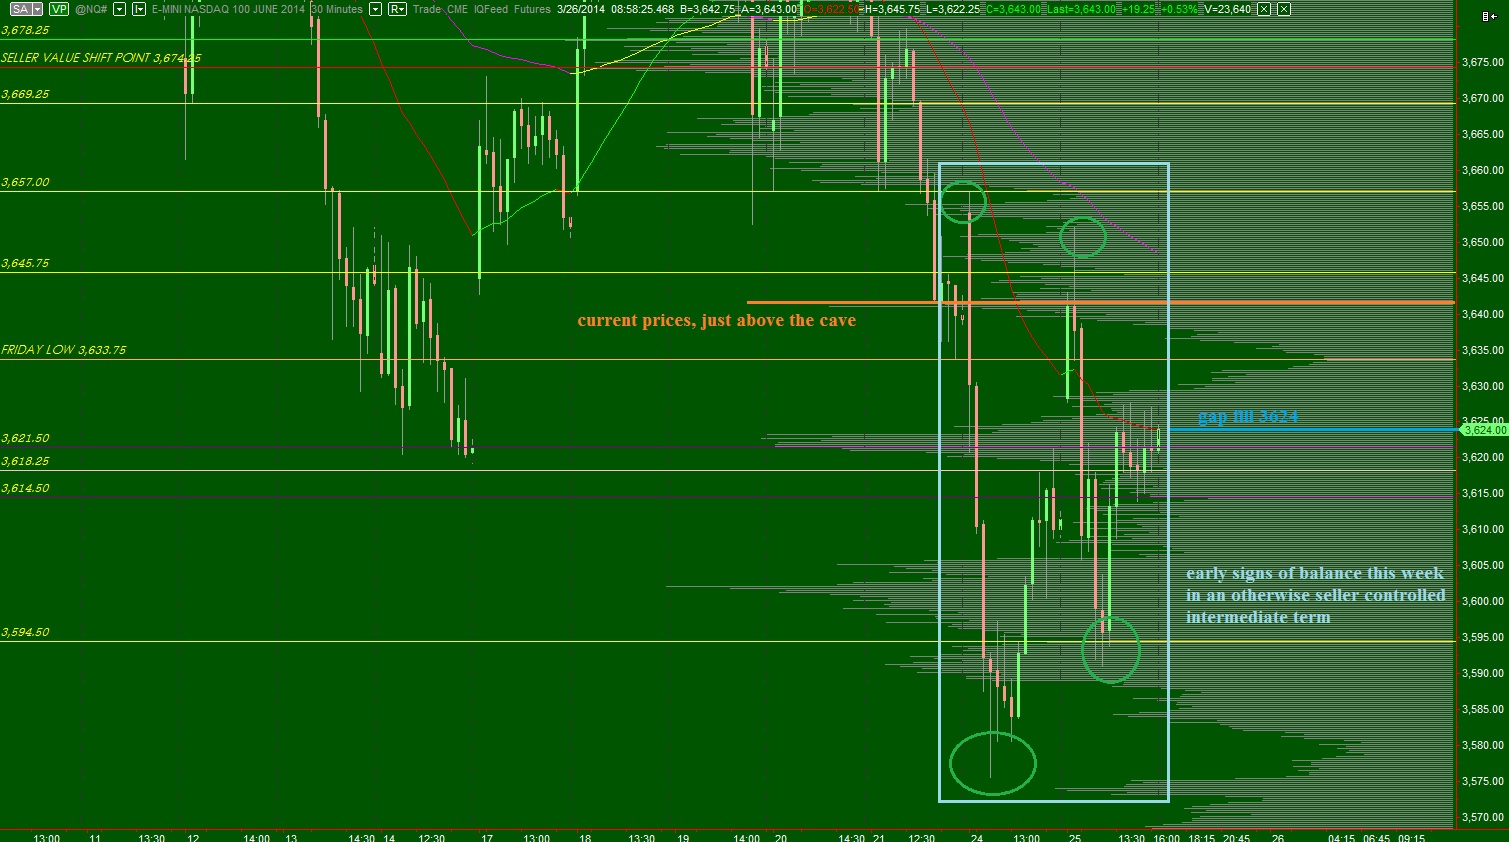
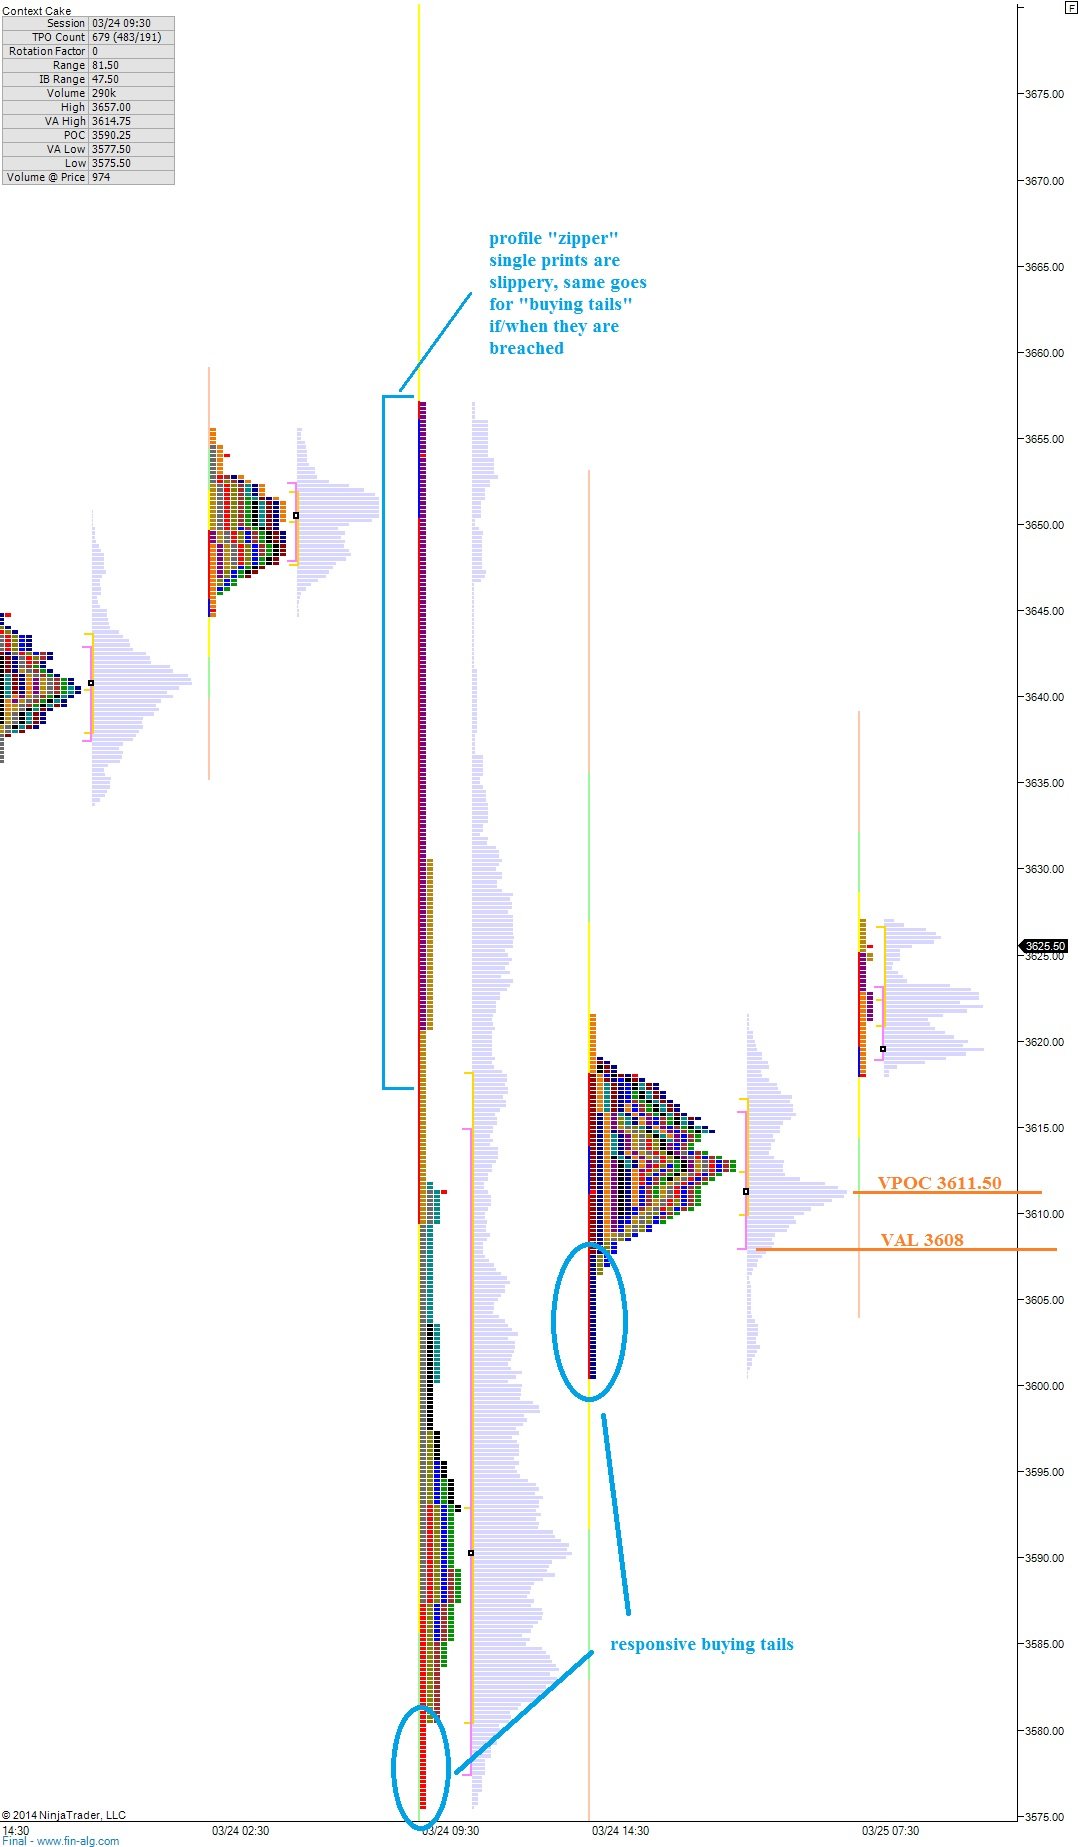
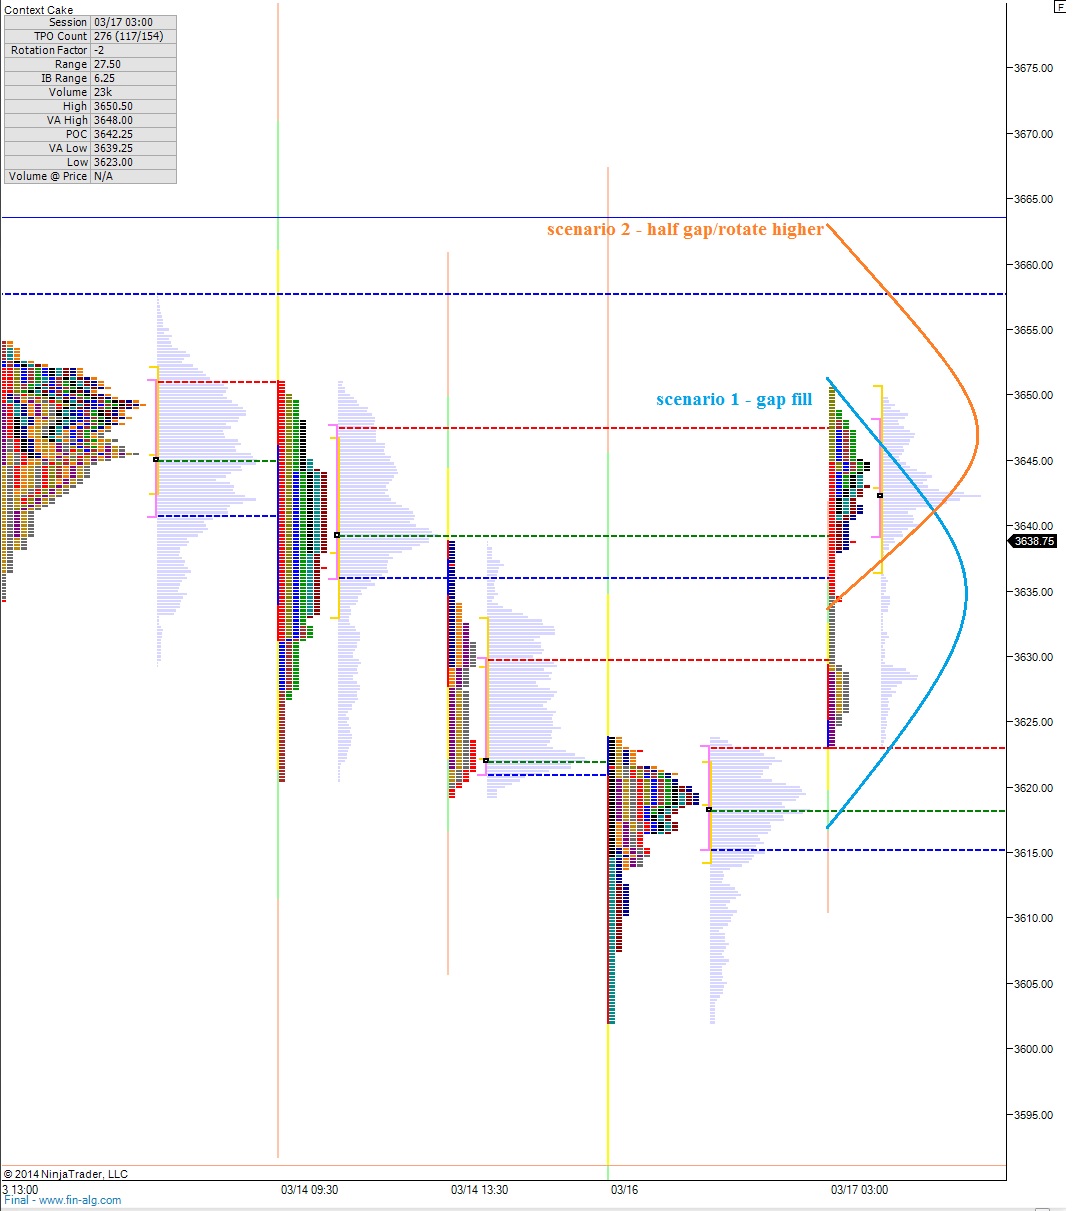
Yesterday’s control – sellers, but signs of balance: price action was again in the control of the sellers, however, we did begin seeing signs of balance with price trading back to the midpoint during the afternoon.

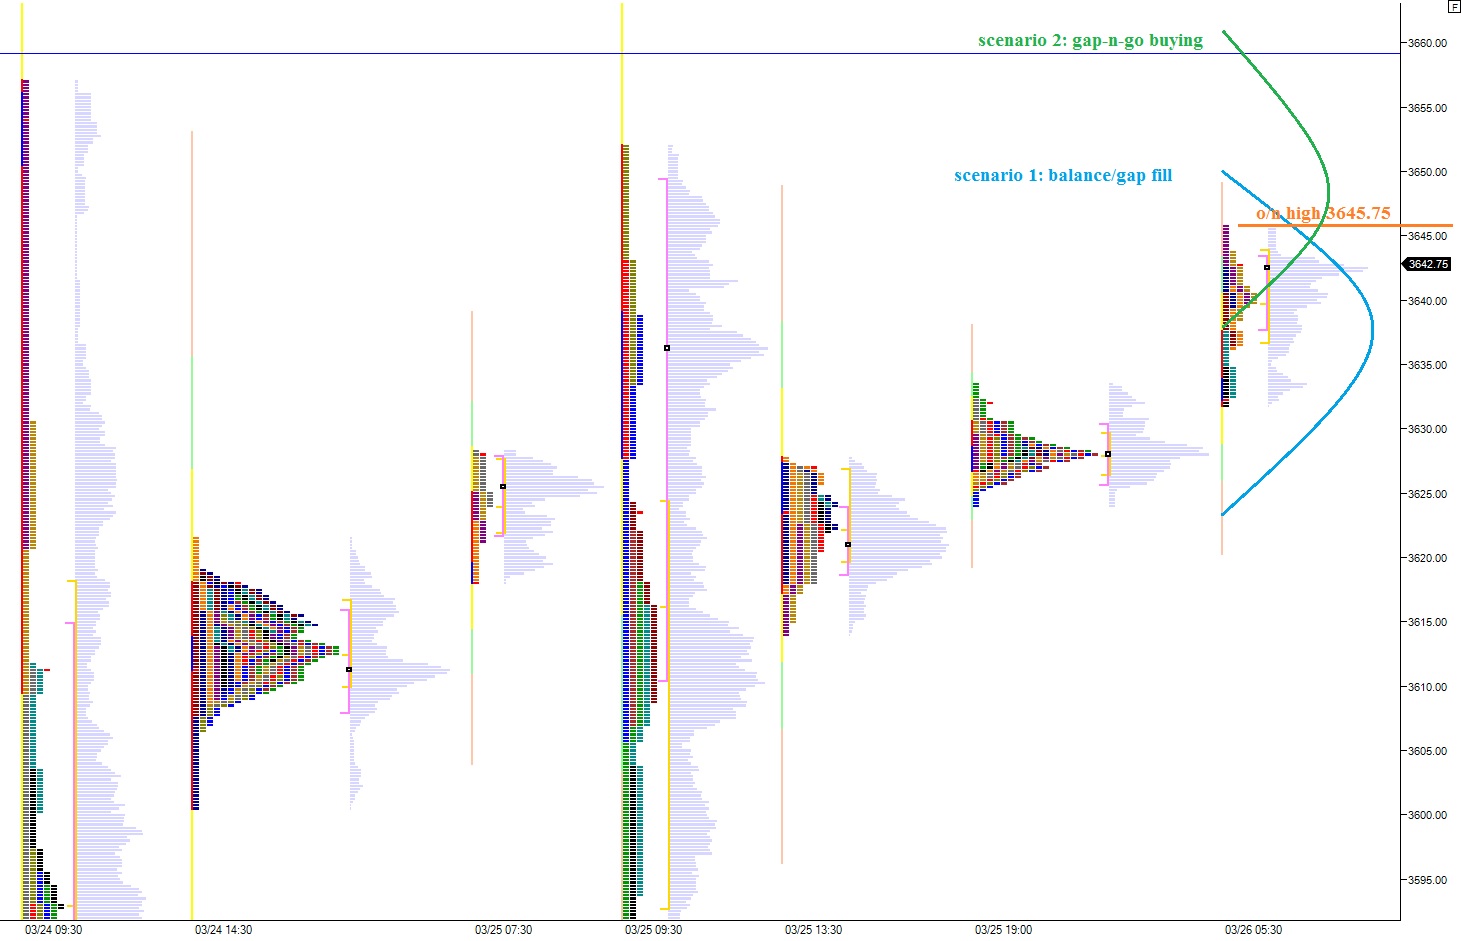
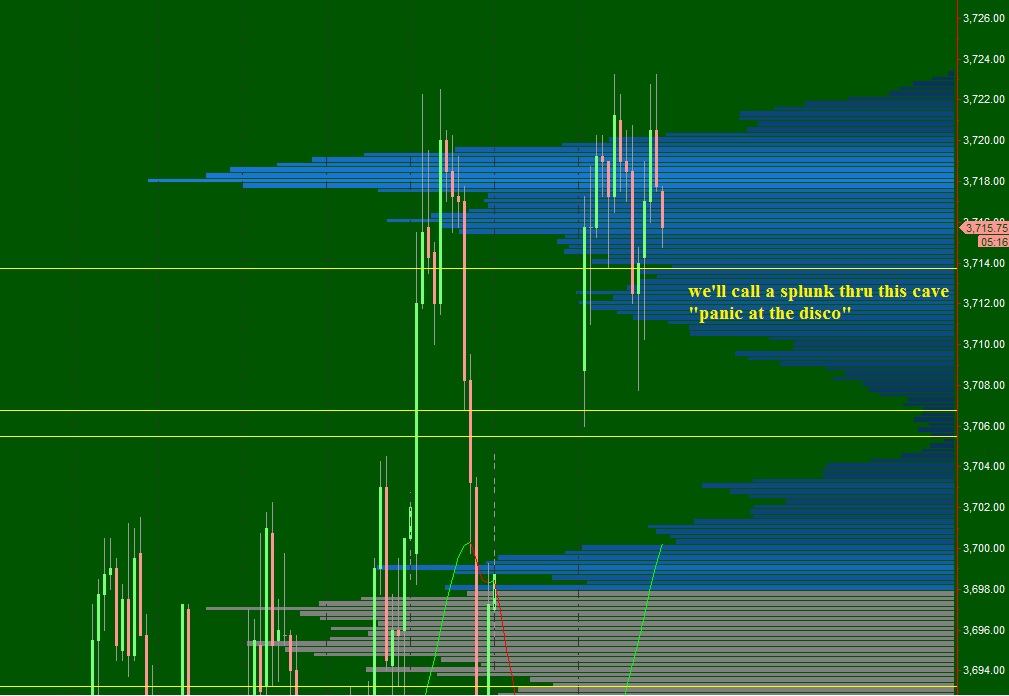
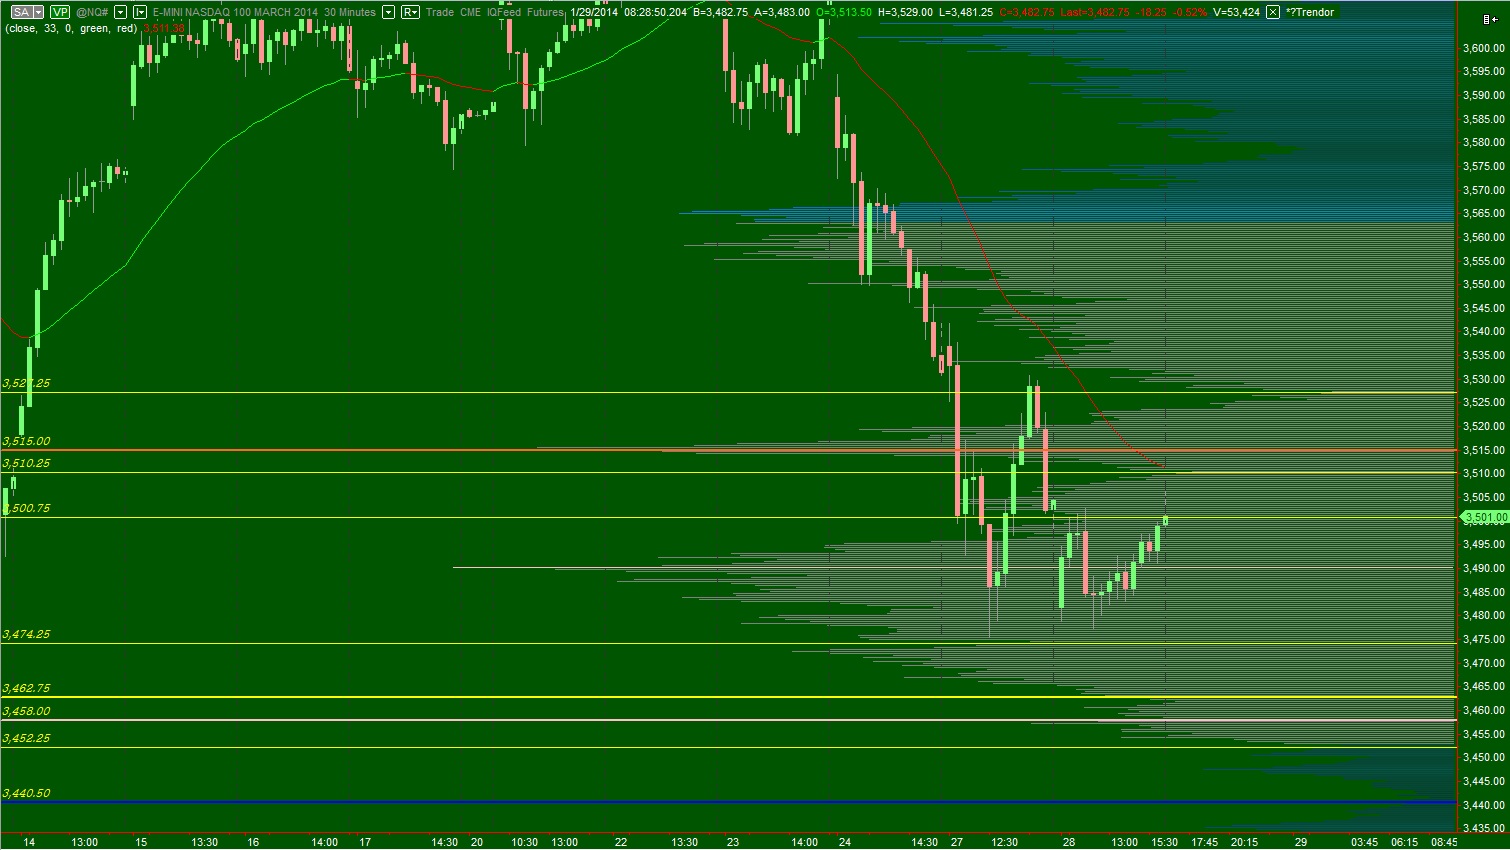
Overnight control – sellers: we have a thin volume , wick print on the overnight profile likely caused by the drop in AAPL shares post earnings.  This was extended upon before finding buyers at 3465.75.

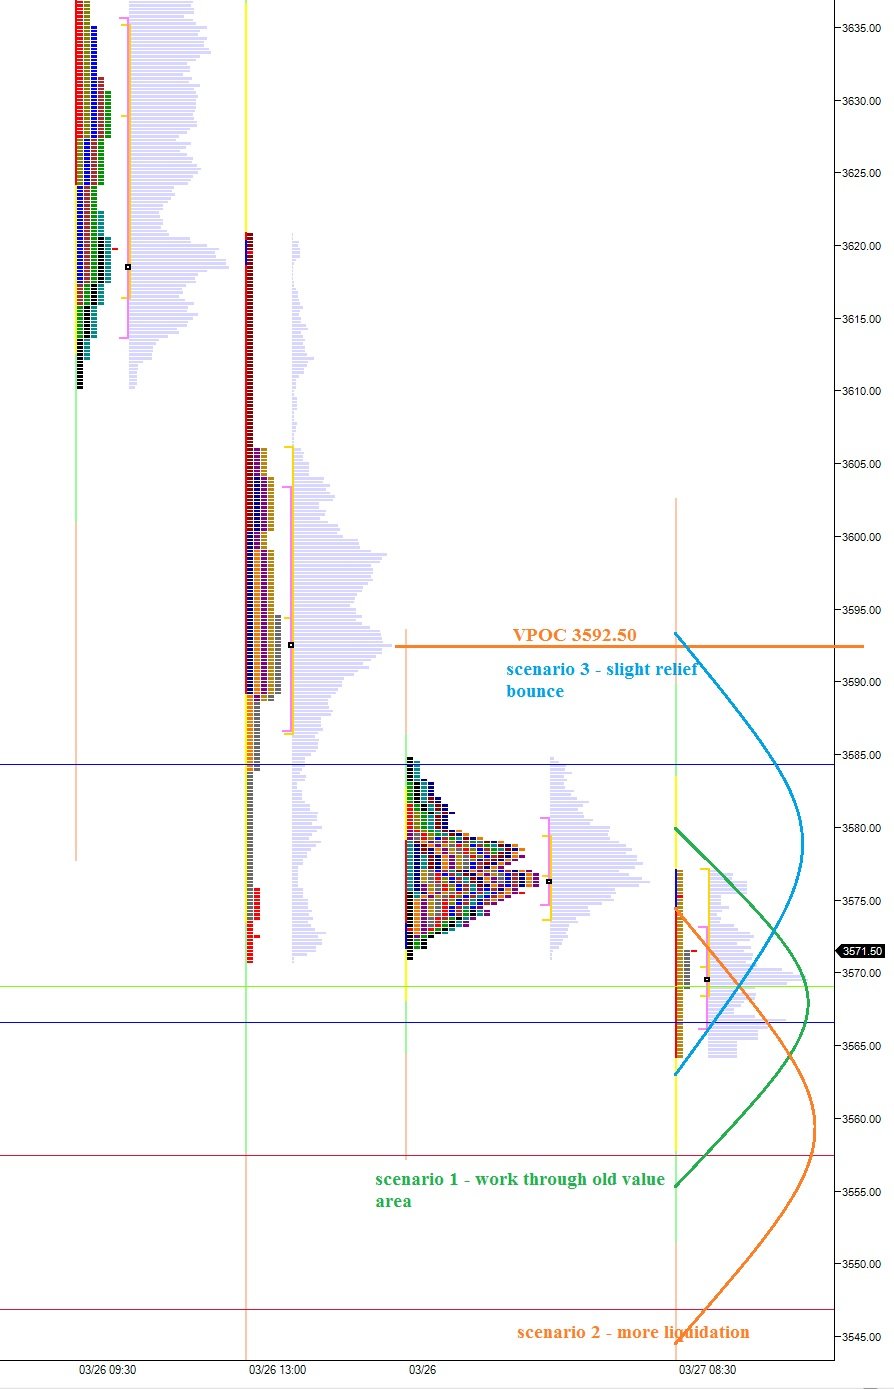
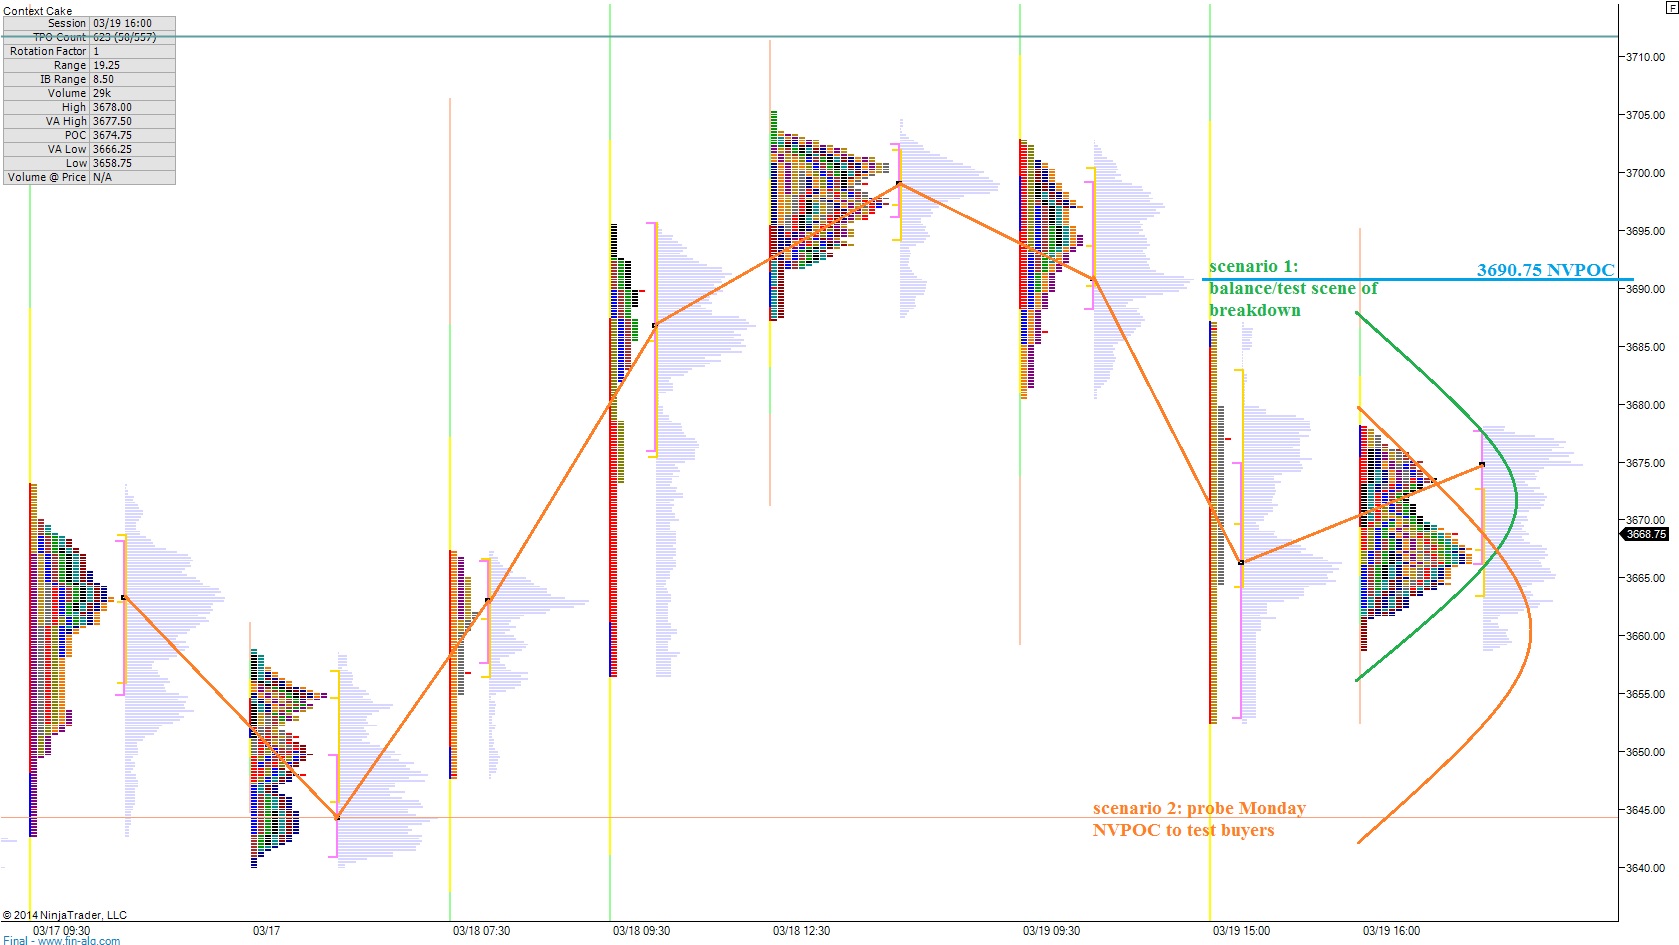
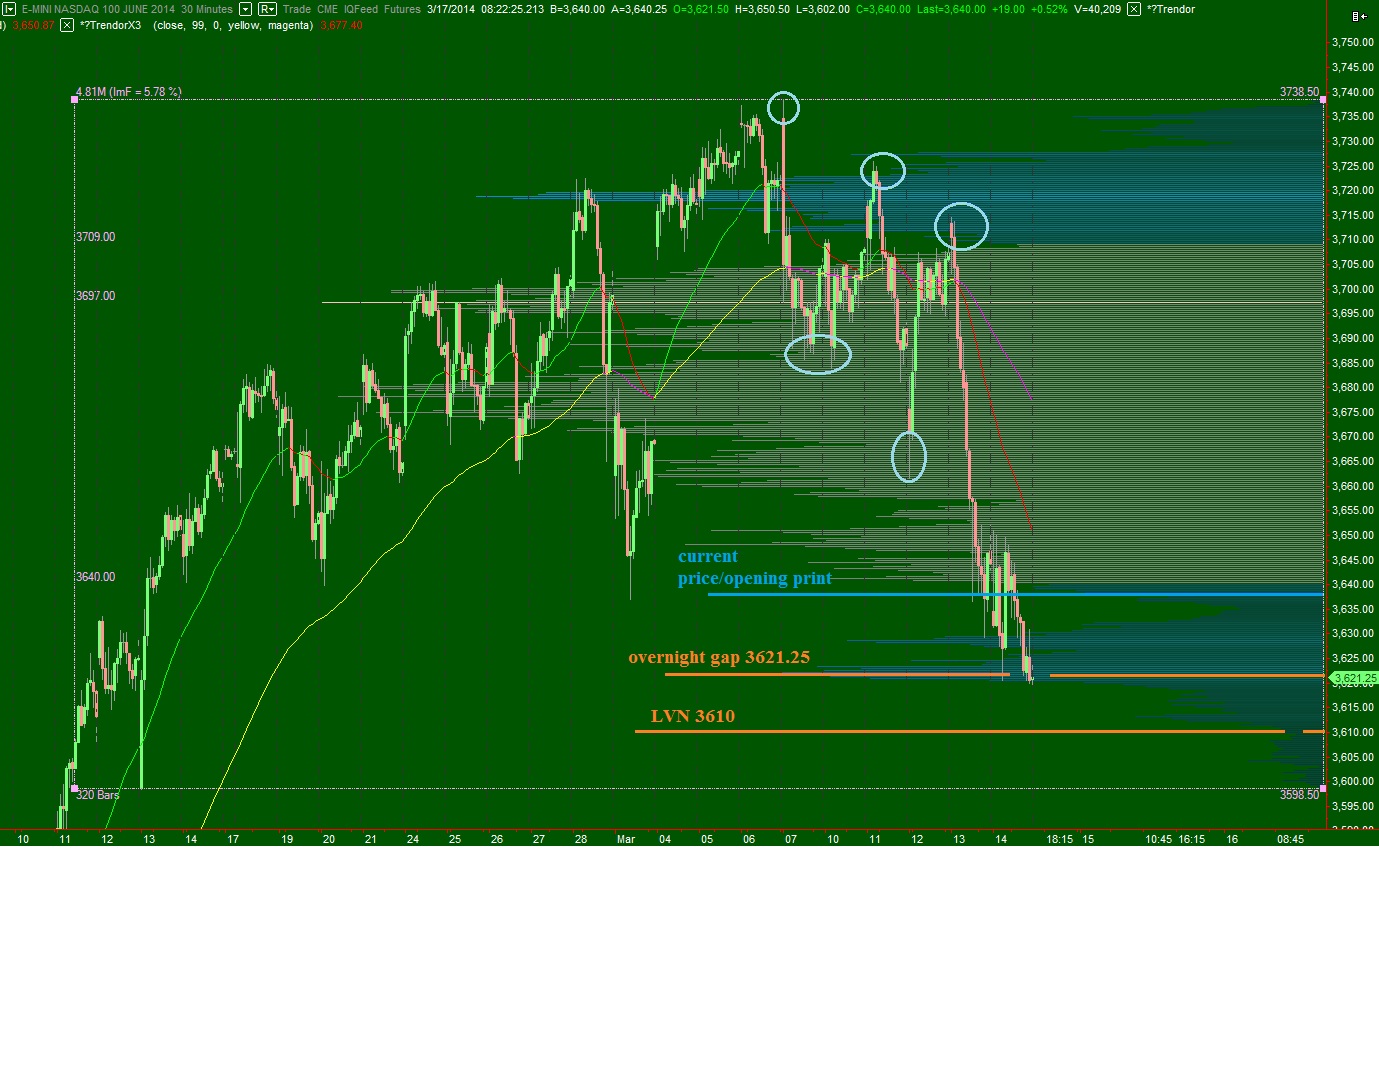
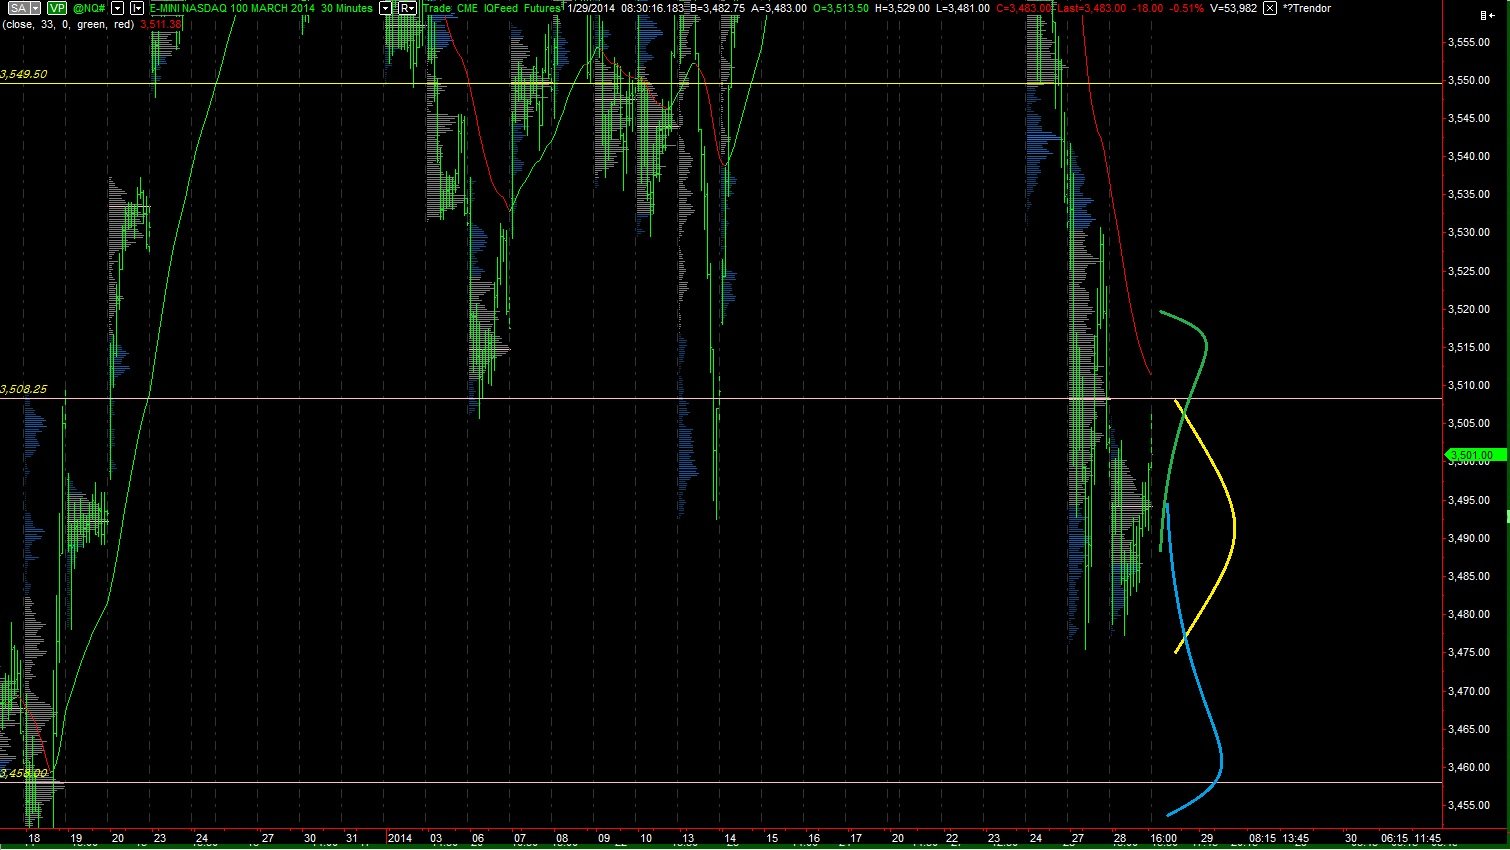
Therefore we can see sellers still predominantly controlling price action.  I expect their control to continue as we work through correction.  However, it is my expectation also that we are nearing the end of correction.  Calling the left side of a sentiment chart is difficult, but I have drawn out a rough road map of what I expect to occur as we close out January and head into February (see below):

NQ_SentimentChart

The low print you see coincides with a naked VPOC dating back to 12/18/2013, one of Ben Bernanke’s better days of action.  Price likes to retest these big “moment” days to see if the catalyst for creating the moment still exists.  If not, if buyers do not present themselves at these levels, my take on the left side of the sentiment chart may be wrong, and we may not have seen true panic yet.  However, if it holds, we may begin working through the very lucrative process of discouragement, where our micro stock analysis can begin working again.

Comments »