iBankCoin
Home / Volume Profile (page 120)

Volume Profile

I See Whale Footprints

First off, I suppose it was a matter of time before RVLT would lurch its dull dagger into my gut once CREE hit the bricks.  Today the Grim Reaper paid me a visit and took a swipe at my groin region.  This is classic, no-news-but-the-past-setting-in sell flow.  I have made my money on this stock, and I have made money on this ugly chart, oddly enough, because I have conviction in the industry as a whole.

As promising as the market for LED lighting is my temptation is increasing to bootstrap the entire idea and do it myself because I am afraid these companies may have a different vision than I do.  This is a digression I am completely unequipped to pen on Friday at 4:40pm.

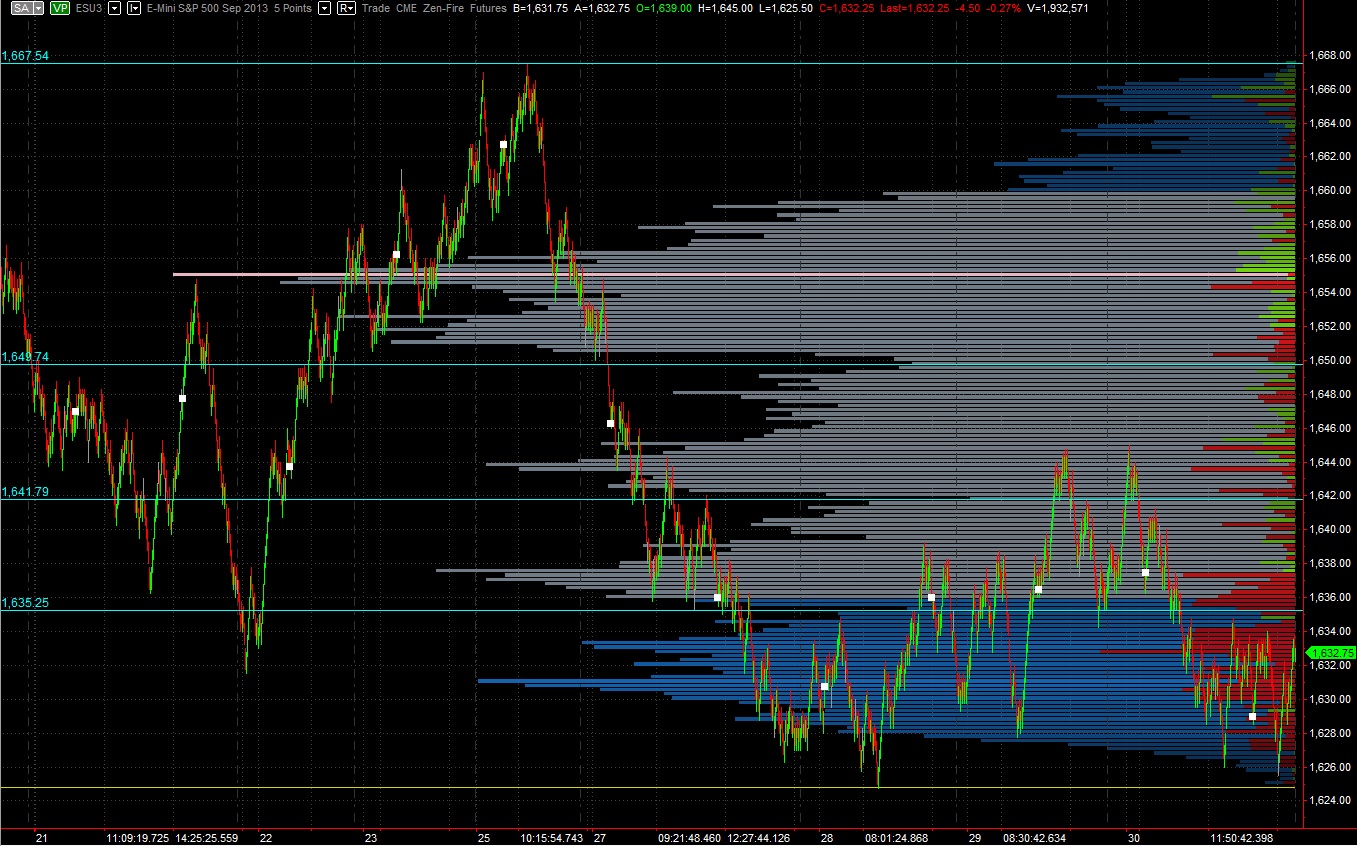
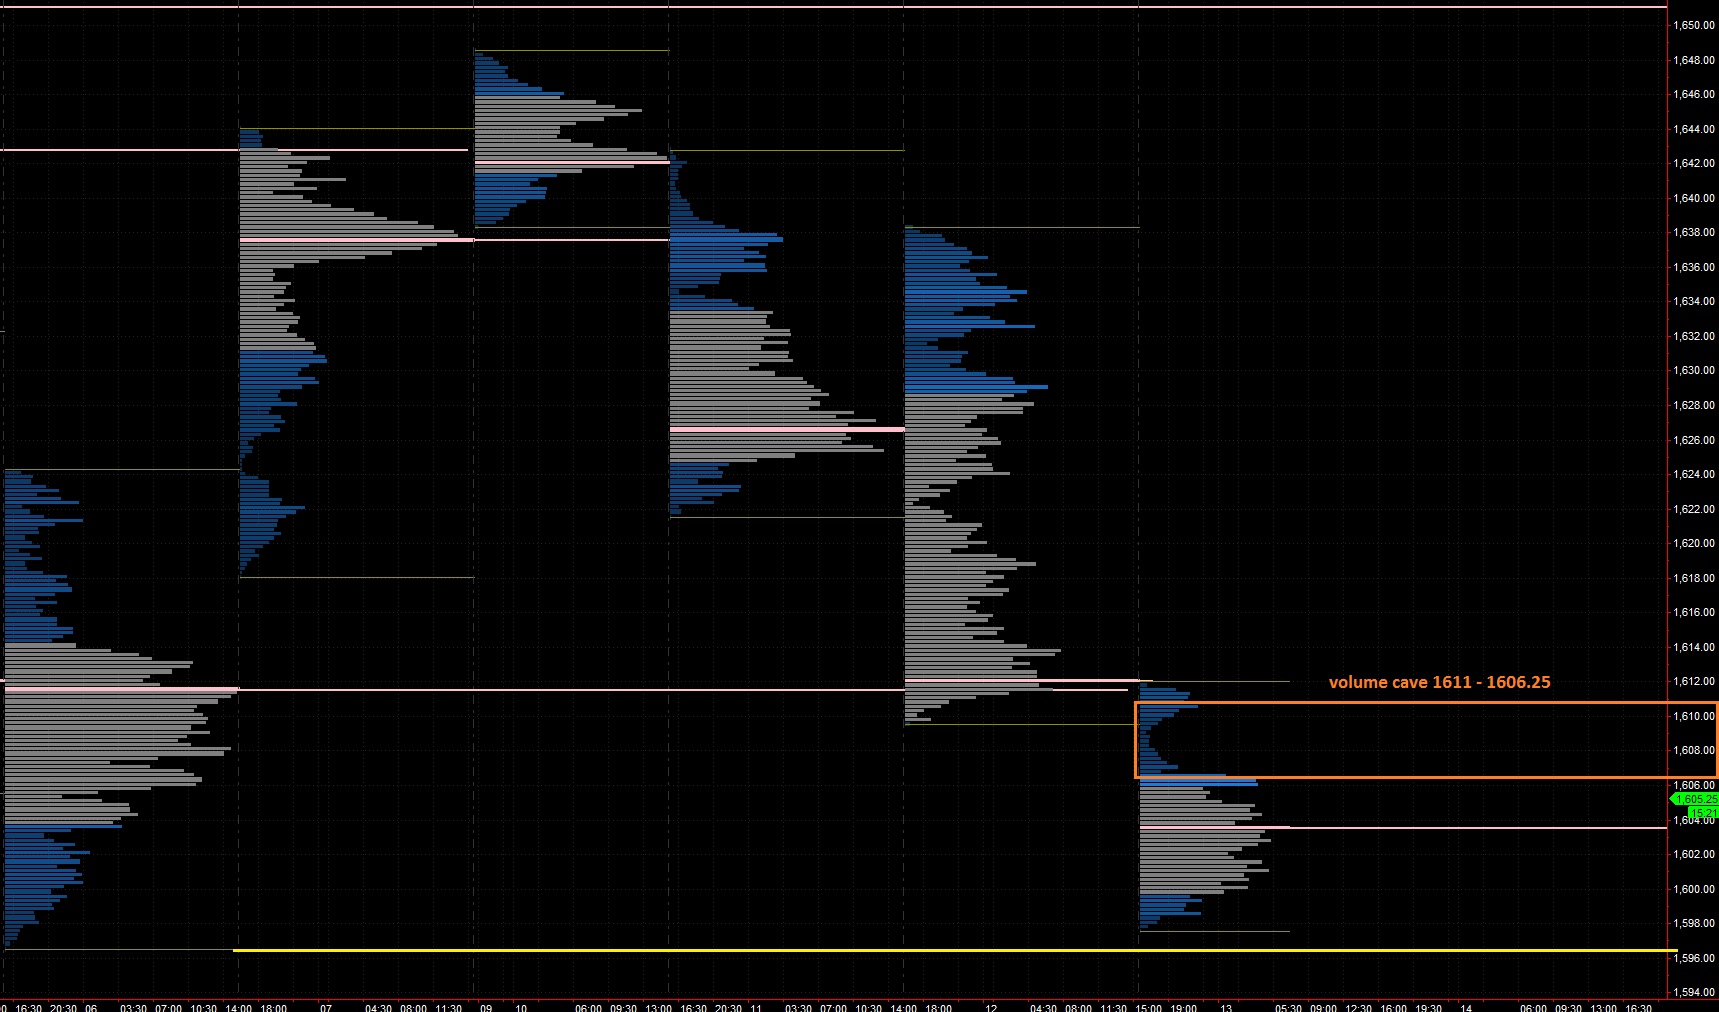
The important matter which had me making the hard decision of cutting longs was the massive absorption of orders I saw taking place throughout most of the day.  Absorption on a larger scale than I have seen in quite a while.  And it occurred in a curious place—just above a consolidation formation.  Tons of buy flow pressed on the market, and the seller only relented slightly into the bell.  I captured the following screenshot with cumulative volume delta on the lower pane and price on the upper:

ES_WHALE

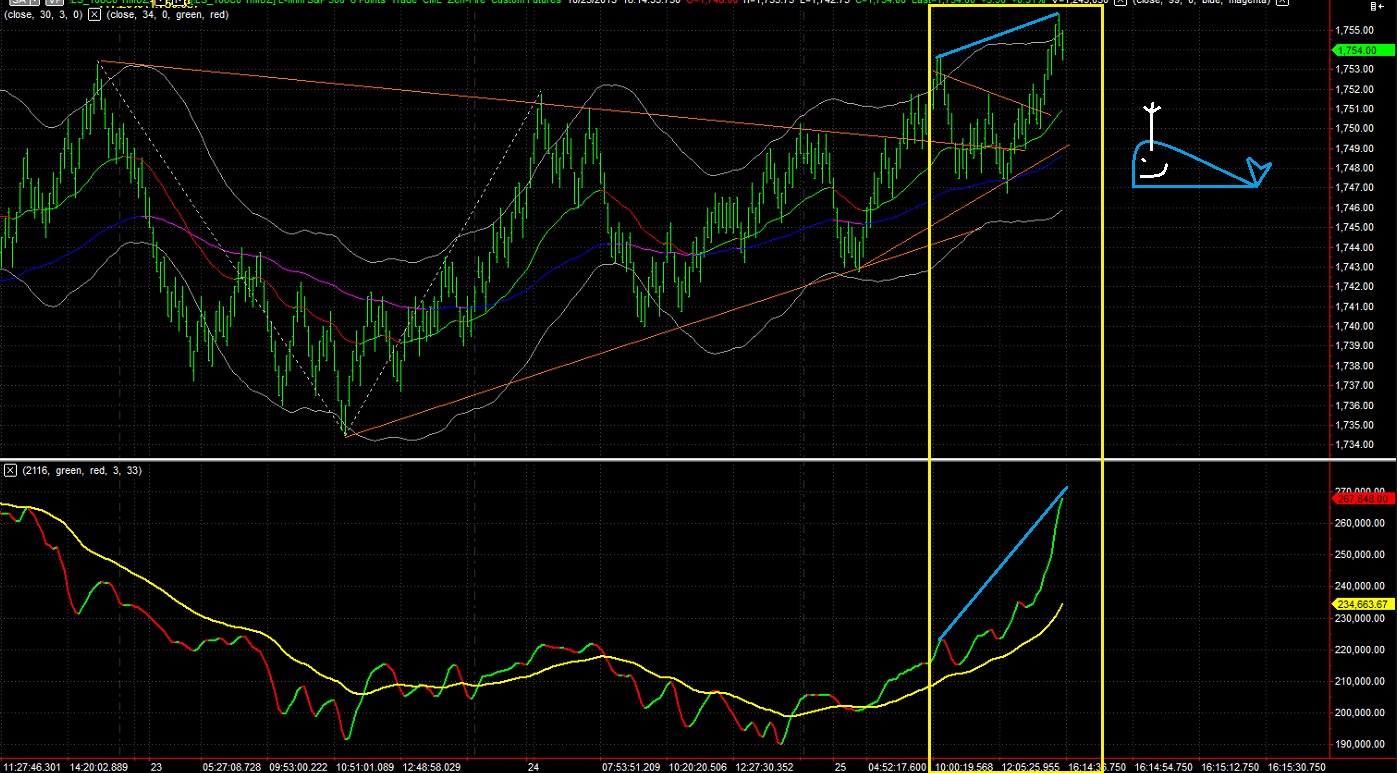
It looks like a massive and patient seller which, once you see that type of absorbtion the next thing we look for is aggressive bid hitting with price dropping swiftly.  By selling WDAY and ADHD I am attempting to get out in front of that occurrence.

And to be quite honest, I should have “done sold” ADHD days ago at about these same prices.  That trade got away from me and I had to sit through way too much risk to get a more reasonable exit point.  It could have kept tanking taking Raul aka Pesce Piccolo down the toilet with it.

WDAY could still win, I really can’t say with any certainty it won’t but I was respecting the whale currents I see.  I almost cut WLT too but I will give it a little more of a chance.  If that spinning top candle confirms lower, I am out.

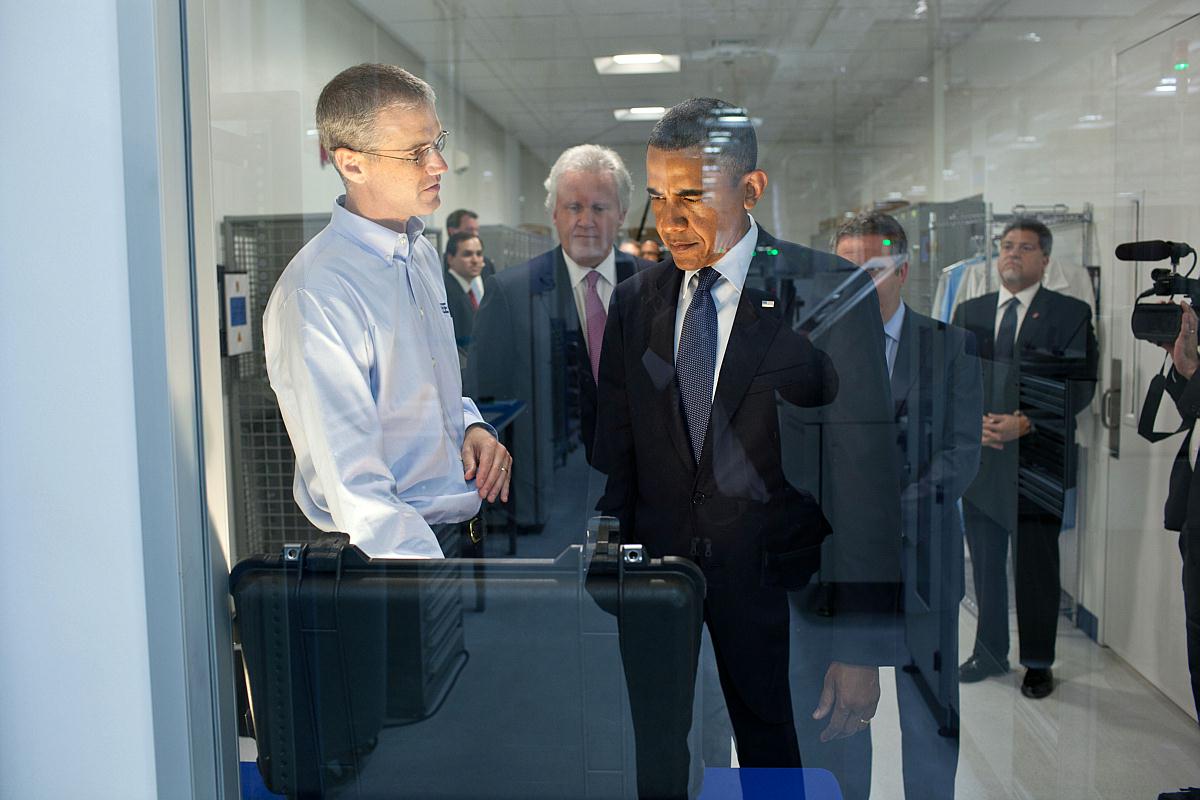
CREE is going to be the soxhlet for a while because momentum has left the building.  Let everyone forget about this name then consider accumulating.  Good news is Chuck Swoboda made his monthly DC payment to keep the LED revolution’s gears greased.  Here he can be seen presenting the ceremonial briefcase of cash (the real money gets wired) to our Commander in Chief:

chuck_CREE

I still have some Ford stock and I like where this company is headed but I never imagined it trading so poorly.  It needs to come to life soon or I may take my interests elsewhere.

I bought more GOGO today and I did so too soon and with plenty of vigor.  Sometimes when you have a ton of conviction in a name you just want more.  But this action has been benign for quite some time and it may offer some real horrorshow brutality for longs next week.  I can just feel it.

PPC is my largest position now, hehehe.  Earnings next week and I like where price sits currently.  I suppose I’m feeling lucky with this one as I sit minus ten percent.  May the chicken gods award my complacency with chicken rain.

USO needs to appreciate from here or it is toast.

LO can do no wrong.

ONVO made me and plenty other fine folks on iBankCoin good money this week.  That was a lot of fun.

I perked cash up to 15% after one day of being 95% long.  Have a great weekend.

Comments »

There Is a Bid Under This Market

Price is/was/will always be the final arbiter, but I like to use cumulative volume delta to peer a little deeper into order flow. Check out the below graph, the below line is averaging the delta (volume at offer – volume at bid) to smooth the behavior out so I can better observe the trend.

Since the 26th, more orders are taking place at the offer than the bid suggesting aggressive buyers are more active than aggressive sellers.  Perhaps the developing shape, wall-o-worry, is leading the market.  Perhaps buyers are getting too far ahead of themselves and will blow their buying power before an actual move.  Nevertheless, the bid is present:

ES_BID

Comments »

Looking at The Auction Since The 08/15 Selloff

This morning I zoomed out to a larger timeframe and took a look at the S&P volume micro composite.  The following volume profile is built on all the trading activity since the 08/15 breakdown.  In essence, this is the long-term auction taking place since the market sold off.

We can draw some interesting observations from this chart.  The first reference point that jumps out to me is 1655.  The volume point of control, the price where more volume was done than anywhere else from 08/15 – present, is much higher than where we’re currently trading.  Even though we haven’t traded at this level since Monday, value has failed to migrate lower.  This is interesting because price and value always converge, either by value migrating with price or price reverting to value.

If you look at some of the other high volume nodes on the chart, you’ll see price retracing several times to the level.  High volume zones tend to slow price as both buyers and sellers perceive the zone as fair, and they auction the level with volume.

Next I see the low volume nodes.  To me, these are the areas of highest opportunity.  This is where price moves the fastest.  I’ve noted three on the chart: 1649.75, 1641.75, and 1635.25.  The not so great news for bulls is we’re trading below all three levels.  1635.25 held up well until we had the war news from John Kerry.  Since then, the price was rejected once.  Therefore, we want to closely observe this level when the markets open back up briefly Sunday then again Monday evening.

The final observation I make is the negative delta we’re seeing down here.  This is shown as the coloration on the volume profile bars.  This tells us more orders are taking place at the bid, sellers initiating the trade, then orders at the offer.  They are net sellers, but there’s significant absorption taking place.  Imagine a sponge sopping up all the orders without much directional movement.

Feel free to share your thoughts on the following volume profile chart in the comments below:

ES_MarketProfile_08312013

Comments »

All The Levels You Need To Navigate Today’s Tape

The market headed south early on last night and made around 10 handles of progress to the downside before enticing buyers back into the S&P.  The dynamic action left behind a volume pocket which will be of interest as we approach the opening bell.  I’ve highlighted it below:

ES_24hour_VolumeProfile_06132013

In terms of the market profile footprints, we’re seeing these large, D-shaped profiles, which signal no real directional conviction.  The bearish bias from yesterday comes from the fact that we closed out near the low of the session.  The follow through overnight adds credence to their cause.  The resistance overhead is pretty clear cut in the following picture:

ES_MarketProfile_06132013

We still have a big gap below to watch also, good luck trading today, people:

ES_MarketProfile_Throwback_05032013

Comments »

Morning Profile Analysis

Futures are modestly higher and the overnight profile shows signs of a possible roll higher, but certainly lacks the symmetry of a balanced session.

Typically, we see the market digest a big directional day by setting up value near the prior day’s close in an orderly fashion.  Considering the precarious position yesterday’s action put us in, I’m prepared for a quiet day or perhaps a day a violent indecision.  I would consider the former to be more challenging to trade.

Note: I’ve split yesterday’s action into its two key components, the selloff and the violent D-shaped distribution.

I’ve also notated the volume profile chart below with clues to the gap existing below and how it may play out as support.

ES_MarketProfile_06062013


ES_MarketProfile_Throwback2_05032013

Comments »

Early Weakness, Here Are The Key Levels

We’re not looking to strong in the S&P globex session, starting with the rock solid resistance overnight at 1630. It held on a series of three lower highs overnight and resulted in a snap of the 1625 level, if only temporarily.  Both of these levels are important today.

I zoomed back on the balance zone from about 1631 – 1622 to get some lower levels to watch in case we see a liquidation occur.

The next levels of potential support are 1618.50 a significant low and then 1616. Finally I see 1614 on my radar as possible.

I will use the following market profile chart to define upside resistance.  Note: I’ve split yesterday’s session essentially in half, where the conditions changed:

ES_MarketProfile_06052013


Comments »

Tap Dancing Through the Minefield

A couple of my positions came very close to stopping out today, but the late-day strength managed to buoy the share prices of SNE and ACHN above where I wanted them. This can either be seen as good or bad, considering my nubile derriere is now exposed to the ghoulish villains from cell block six overnight. So I’m either deferring a loss or avoiding unnecessarily being stopped out. Either way, we stick to the plan, yes yes?

I was reminded by my good friend @elizamae via twitter of this old post concerning a very significant price zone. A price zone we tested today. How quickly my mind forgets old thoughts, I blame the ADD. Nevertheless, it’s worth a reread as we swim in these waters.

A humble tip of the hat to you, good sir.

The only other action today was buying some GOOG weekly calls near the LOD. I scaled one off and the other is nicely green and held close to my chest overnight. It’s mine! You can’t have it. I bought Google because it’s a support play, much like we’re looking for these prices in the big indices to behave as support. Therefore, I can extrapolate the index behavior out to the stock and allow the large tides to assist in dictating my decision process when drilled down to Google stock. Cool right?

My swing portfolio was down 1.2 percent today and cash levels are near 40 percent.

Good Monday. Let’s string together a strong week.

Comments »

Taking Us Back to The Old School for More Clarity

We’ve had several instances of overlapping profile development recently, and it made me miss my old school market profiles.  So I’m bringing them back, yes yes, very exciting.

Thursday featured a large gap lower that was steady accumulated all session only to be followed by Friday’s holiday tape which also gapped lower and was accumulated all day.  Friday’s profile was contained entirely inside Thursday’s which is aka an inside reversal pattern.

I wanted to merge the two profiles into one after seeing their volume characteristics.  Once I’ve done so, I get a clear picture of the auction that took place at these prices, and the relevant levels to monitor.

I also split the big selloff into the early distribution and the change.

I’ll be monitoring the following levels as we open up this morning:

ES_MarketProfile_05282013

Comments »

Weak Pre Holiday Morning

Tip top of the morning, memorial weekend procrastinators!

The pre market has turned from moot to rather weak over the last hour, with sell flow pushing into the tape.  We’re currently trading at the value area low of our 24 hour profile which is also a high volume node at 1639.50.  We could see a bounce here, especially given the one direction nature of this most recent move.

Oddly enough, our profile yesterday took on the shape of a letter P which, in many cases, suggests we spent the session squeezing shorts.  That’s relatively uncharacteristic of a large gap down, but I know many long traders who were green come market close yesterday, so it makes sense.

The question now becomes, was yesterday a temporary phenomenon to the upside?  The attempt at filling the gap was impressive, so I give the buyers a pat on the back, but we are dealing with a heavy amount of sell flow in the globex hours.  It will be interesting to see how RTH handles this weakness today.

I’m keeping with the zoomed back profile to give us reference points to trade.

ES_VolumeProfile_05242013

Comments »