Wed Sep 3, 2014 11:58am ESTComments Off on MIDDAY SNAPSHOT
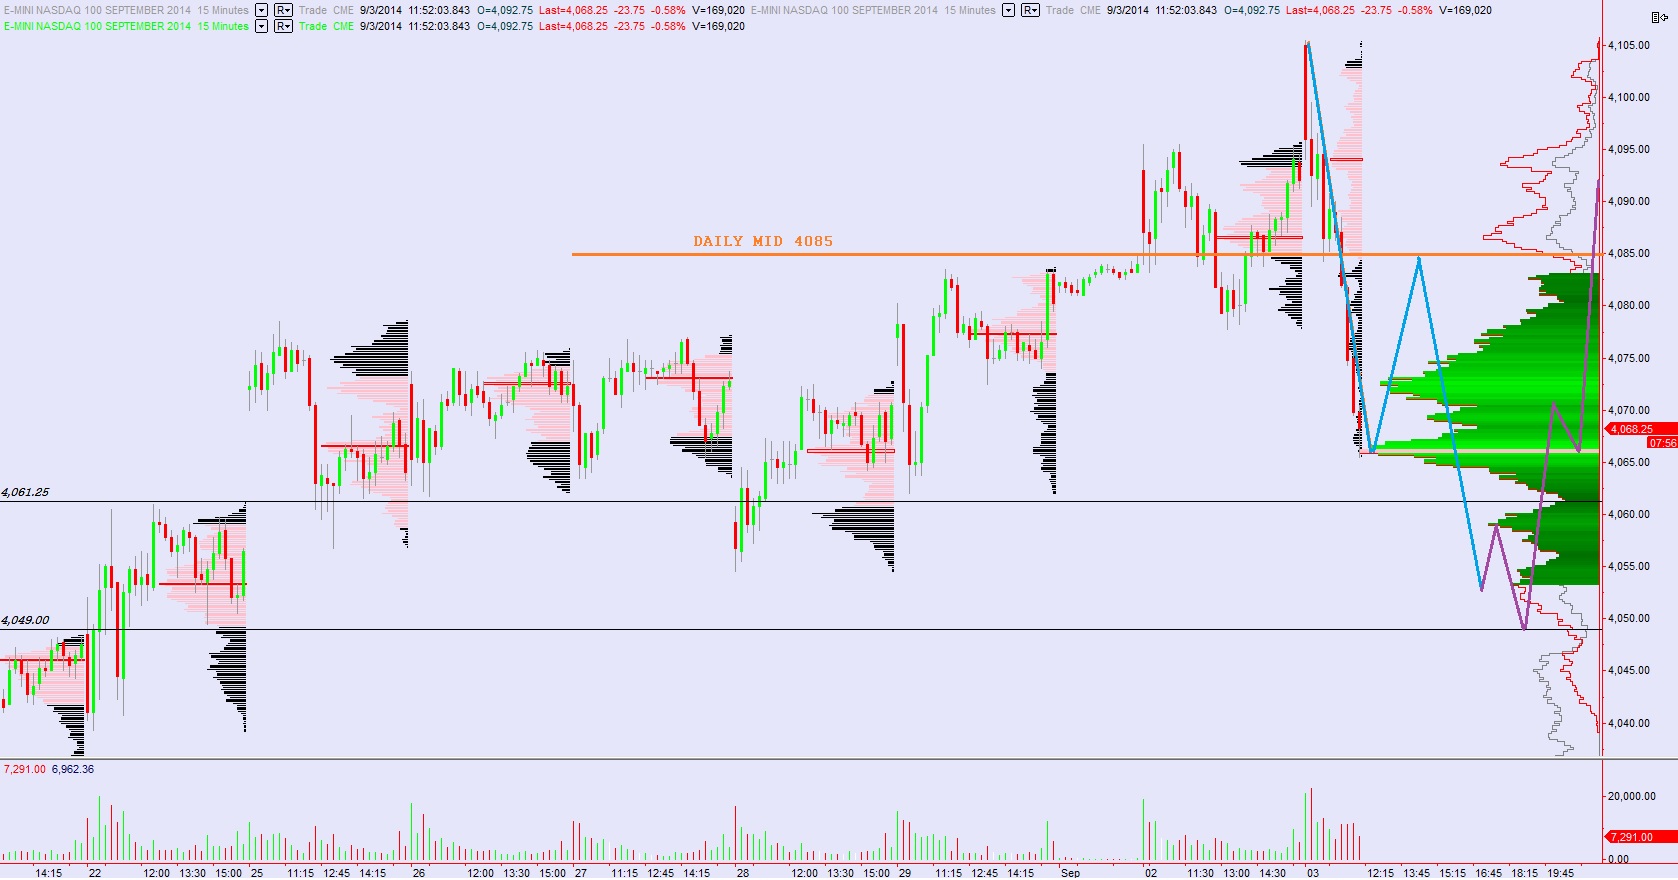
We observed a fairly strong bit of selling this morning in the Nasdaq, possibly fueled by the very weak day seen in AAPL. There are also several early breakouts fading throughout the stock complex. A bit of a rout is reasonable given the elevated price levels of late, the key however is maintaining some semblance of method to the tape as opposed to panic-type selling.
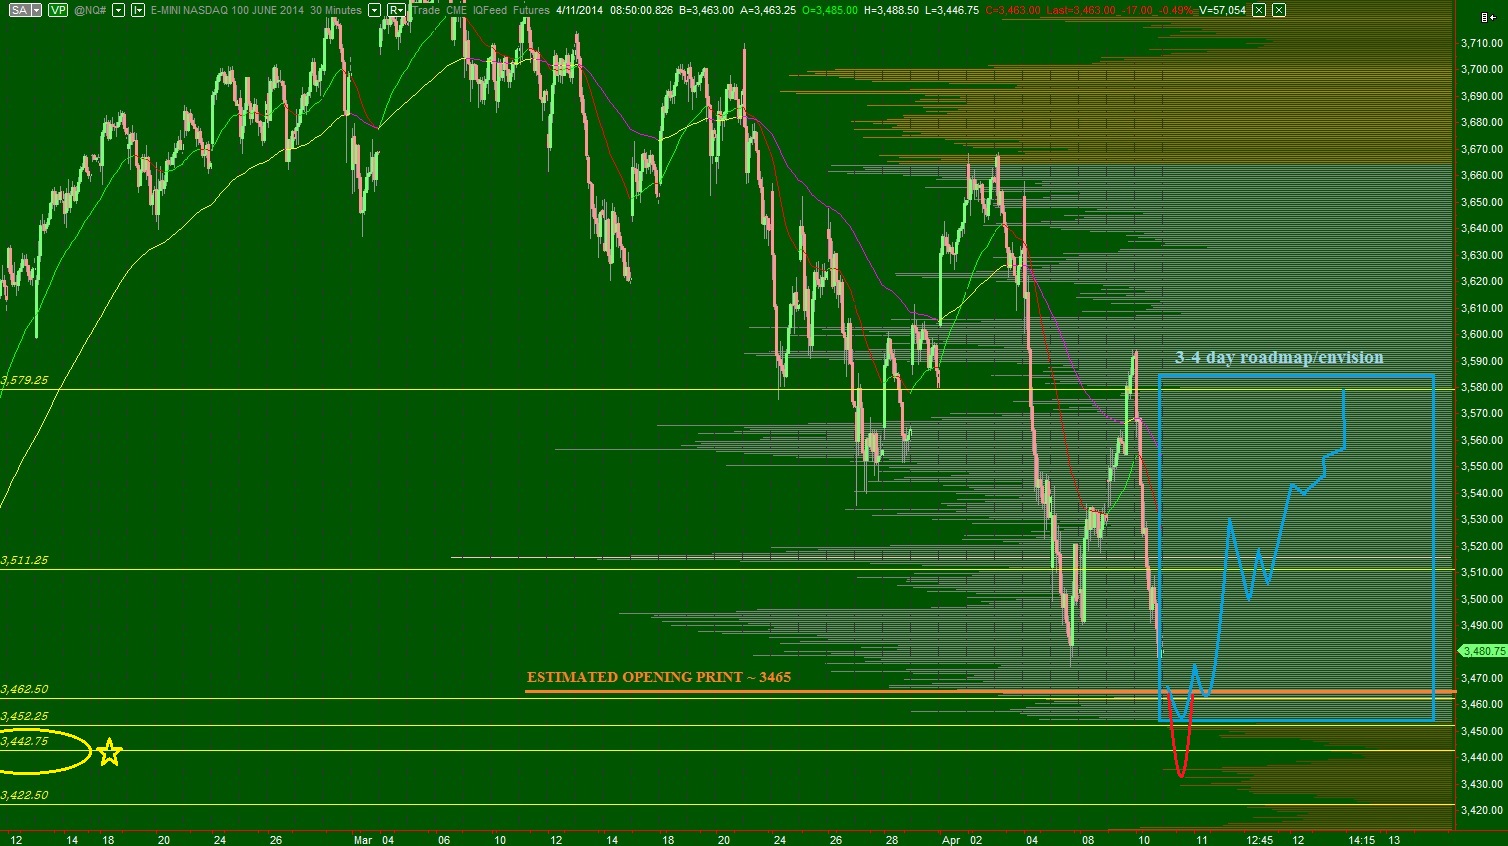
With that thought in mind, I have mapped out a hypothesis of how I envision the next 2-3 days to trade. This is not fact, this is not prediction, it is merely a template to compare to how the tape actually plays out.
A request has been made to assess the conditions of a certain metal, gold. The following analysis is of gold and is conducted using the December 2014 Gold futures contract which trades on the COMEX. I am using the complete trade data, not the regular trading hours, because this instrument tends to make moves outside of regular market hours.
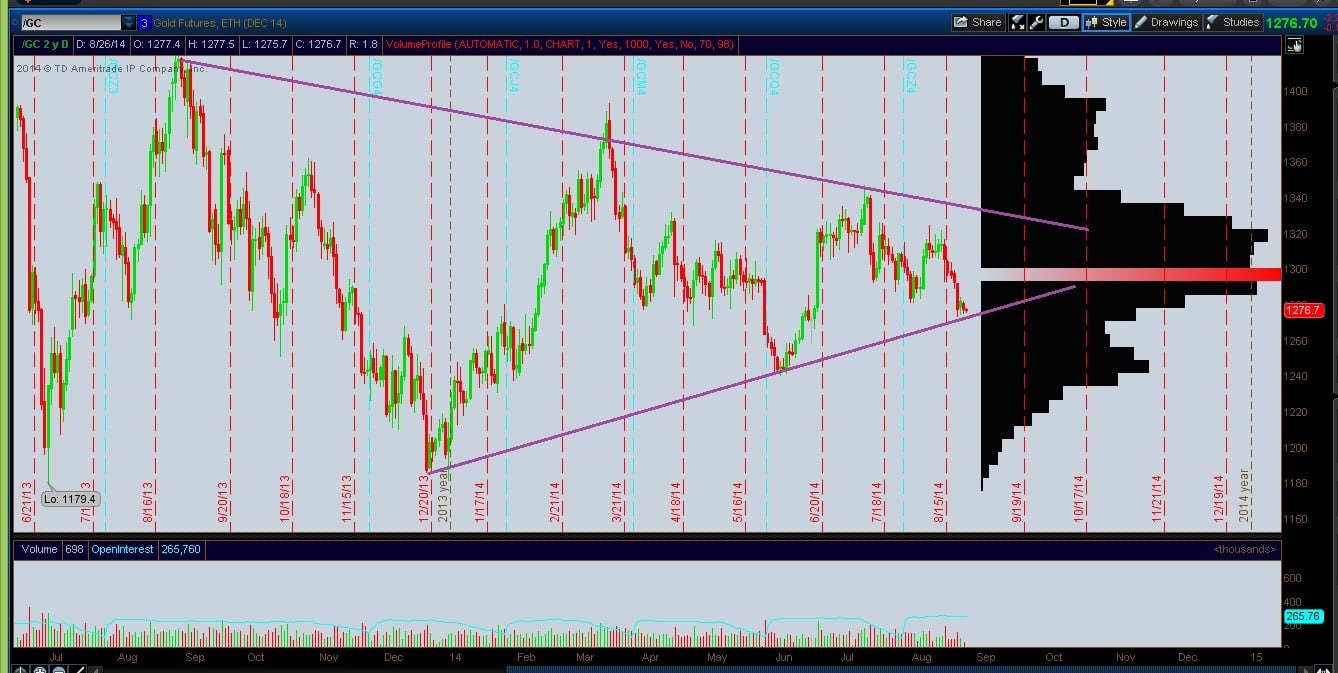
Long term prices are bearish to neutral. Prices took a sharp move lower starting mid 2012 and accelerating during 2013. Since then prices have been basing.
Intermediate term is neutral. After an excess low printed in July of 2013 we began the process of balancing. The balance is best seen on the following volume profile which dates back to about June 2013. We can see buyers and sellers reaching a consensus of value on the intermediate term, and we are currently trading near the lower end of where one might expect to see buying:
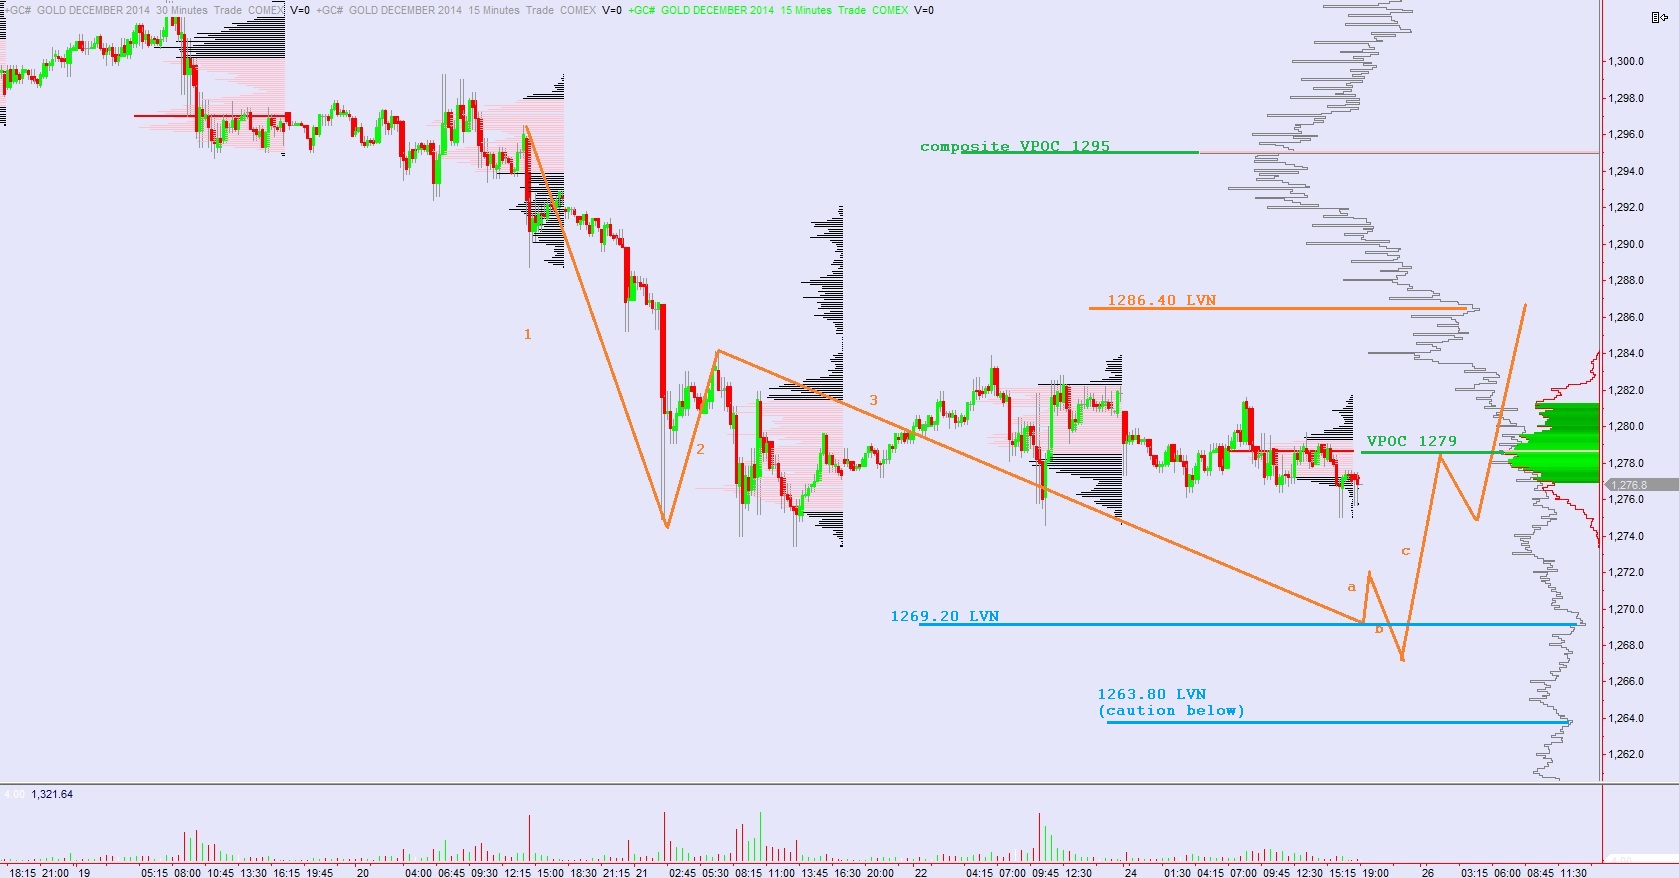
My current bias score is just a shade over neutral but not quite medium bull. The volume is coming in a bit heavier to the downside over the last week. However we do have signs of excess lows. And even though the trend of the last few weeks has been lower, we have been essentially flat over the last 2-(almost)3 days. If we are indeed coming into balance on the short term, then the micro composite VPOC at 1279 becomes a magnet with an even larger composite magnet existing at right about 1295.
If considering a long, one might be able to obtain a better entry by waiting for another lower low to complete a possible correction cycle. This is very much a speculative roadmap, but I have highlighted my vision below:
One of the primary jobs we have as traders is determining what type of environment we are trading in. What are the conditions? Are prices moving fast or are we chopping around? Our behavior can be adjusted accordingly. This means stepping back and examining the price and volume action from a less granular level—instead observing a multiple day auction.
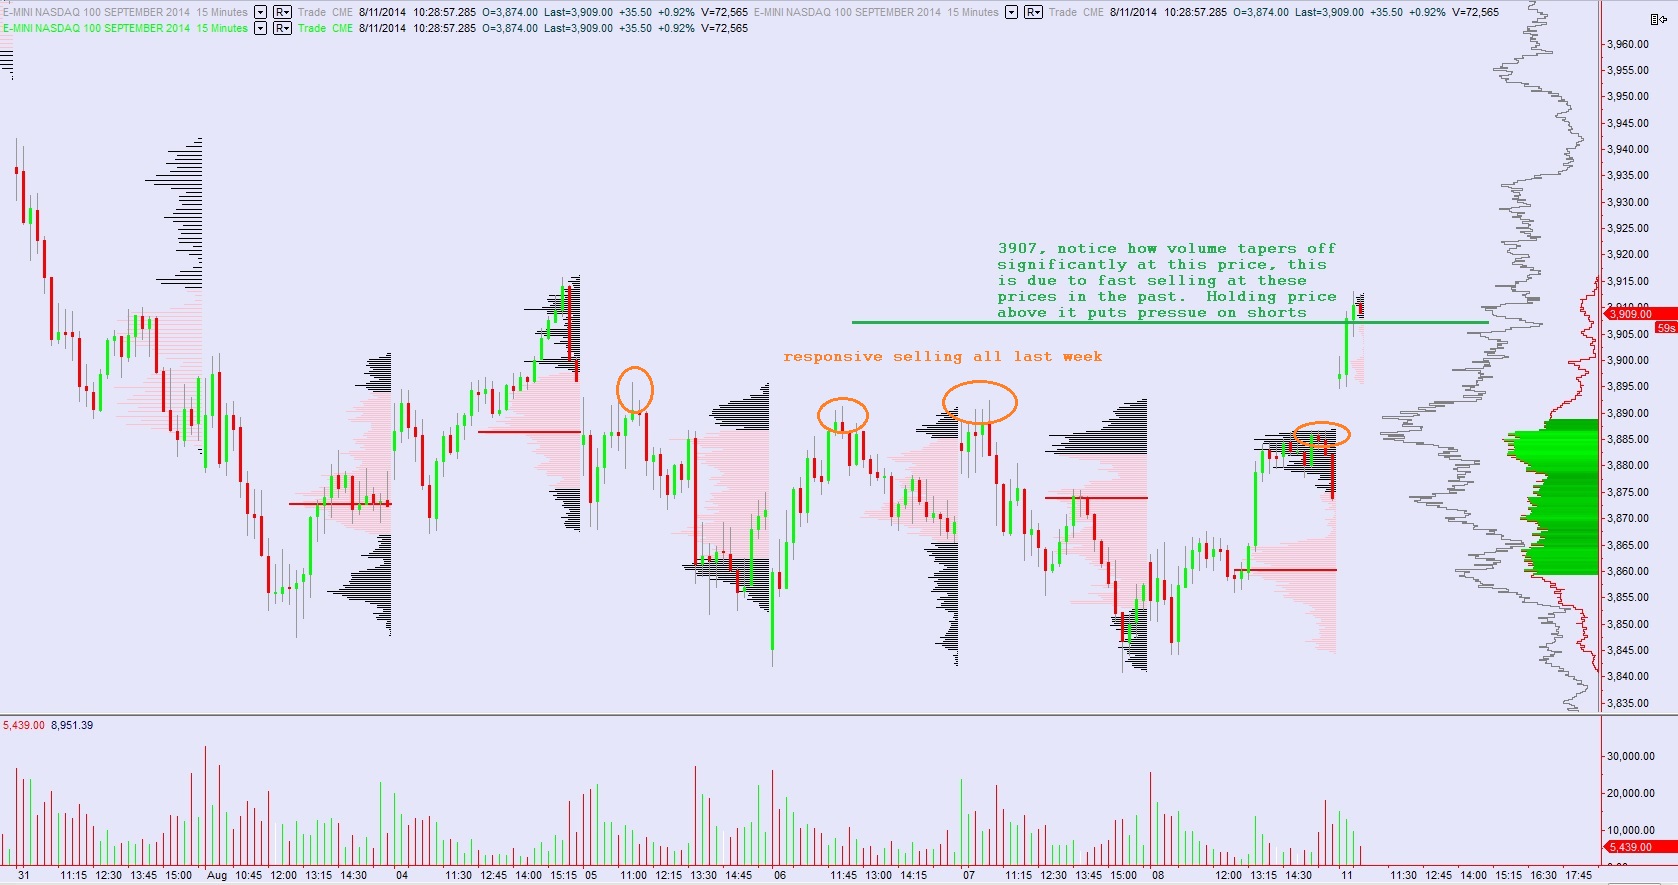
On my latest volume profile chart we can see multiple conditions all in one place. At a glance we can see the long term volume composite, the balance occurring on a shorter more intermediate term timeframe, and also see the daily auction. What jumps off the screen when I look at this chart is the balance formed during the last eight sessions. These eight sessions are significant because they are the auction as we wrapped up July and began August. A significant build of volume took place, we compressed on Friday before thrusting higher, and the thrust continued into Monday. We are now trading up at the edge of balance and that high volume core is acting like gravity. Between us and mean revision lower is a low volume node at 3901.25. The behavior around this price will be my early tell on whether we go back and fill the gap that started the week. Furthermore, how we behave around the high volume VPOC at 3885, a price vehemently defended by sellers last week, might indicate whether we have shifted into discovery mode, see below:
The overnight auction was quiet thus far, taking place inside yesterday’s range on low volume. The biggest rotation occurred around 7:15am, it was a downward rotation of 14 points. We have a Monthly Budget statement being released at 2pm and an otherwise quiet economic calendar until afterhours when Japan GPD data is set for release just before 8pm.
I have highlighted the short term levels I will be observing on the following market profile chart:
Last week’s work is paying off today. When you put aside the headlines and focus on interpreting the auction you will find yourself much more able to execute. Traders often struggle with their trading during the summer months for a variety of reasons. In many ways, summer trade is like the off season and such a break is much deserved and needed. However, if you push too hard, forcing trades, you might be frustrated when the thin action plays out.
The Nasdaq has been leading thus far this morning, where price gapped up and chopped a tight range before breaking higher. Although I do not expect a ton a conviction from buyers today, I would still caution shorts with this initiative-type buying occurring. I highlighted the 3907 price level this morning as a key composite LVN to monitor during today’s trade. Watch how the market treats this level today as your intraday pivot. Should we continue sustaining trade above it, then the discovery process is likely to continue higher.
On the day my only action was scaling off a piece of my TNA long.
Sun Jun 8, 2014 12:52pm ESTComments Off on How Mutual Fund Monday Looks When Money Flows into RISK
The Nasdaq 100 index houses the absolute finest in growth and risk stocks. It includes the largest domestic and international non-financial securities listen on The Nasdaq Stock Market based on market capitalization. Some of the big dogs are AAPL, FB, AMZN, BIDU, CSCO, MSFT, CMCSA, GILD, GMCR, QCOM, INTC, and YHOO. For the full list of symbols involved, check out the link below:
This index has some shades of value stocks in it, but for the most part these are massive, promising, growth companies. When money flows into the index it suggests our market participants has a taste for popular, big timer, growth. We could expect the lazy mutual fund managers to put down their cheese platters and stop schmoozing for a few minutes to enter their fresh AUM (assets under management) into the market at the start of the month, and as traders we sit around eagerly searching for these gluttonous flows of money. The last few months they have been sort of weak, perhaps because people are either pulling some money away from the markets or not contributing their average allotment.
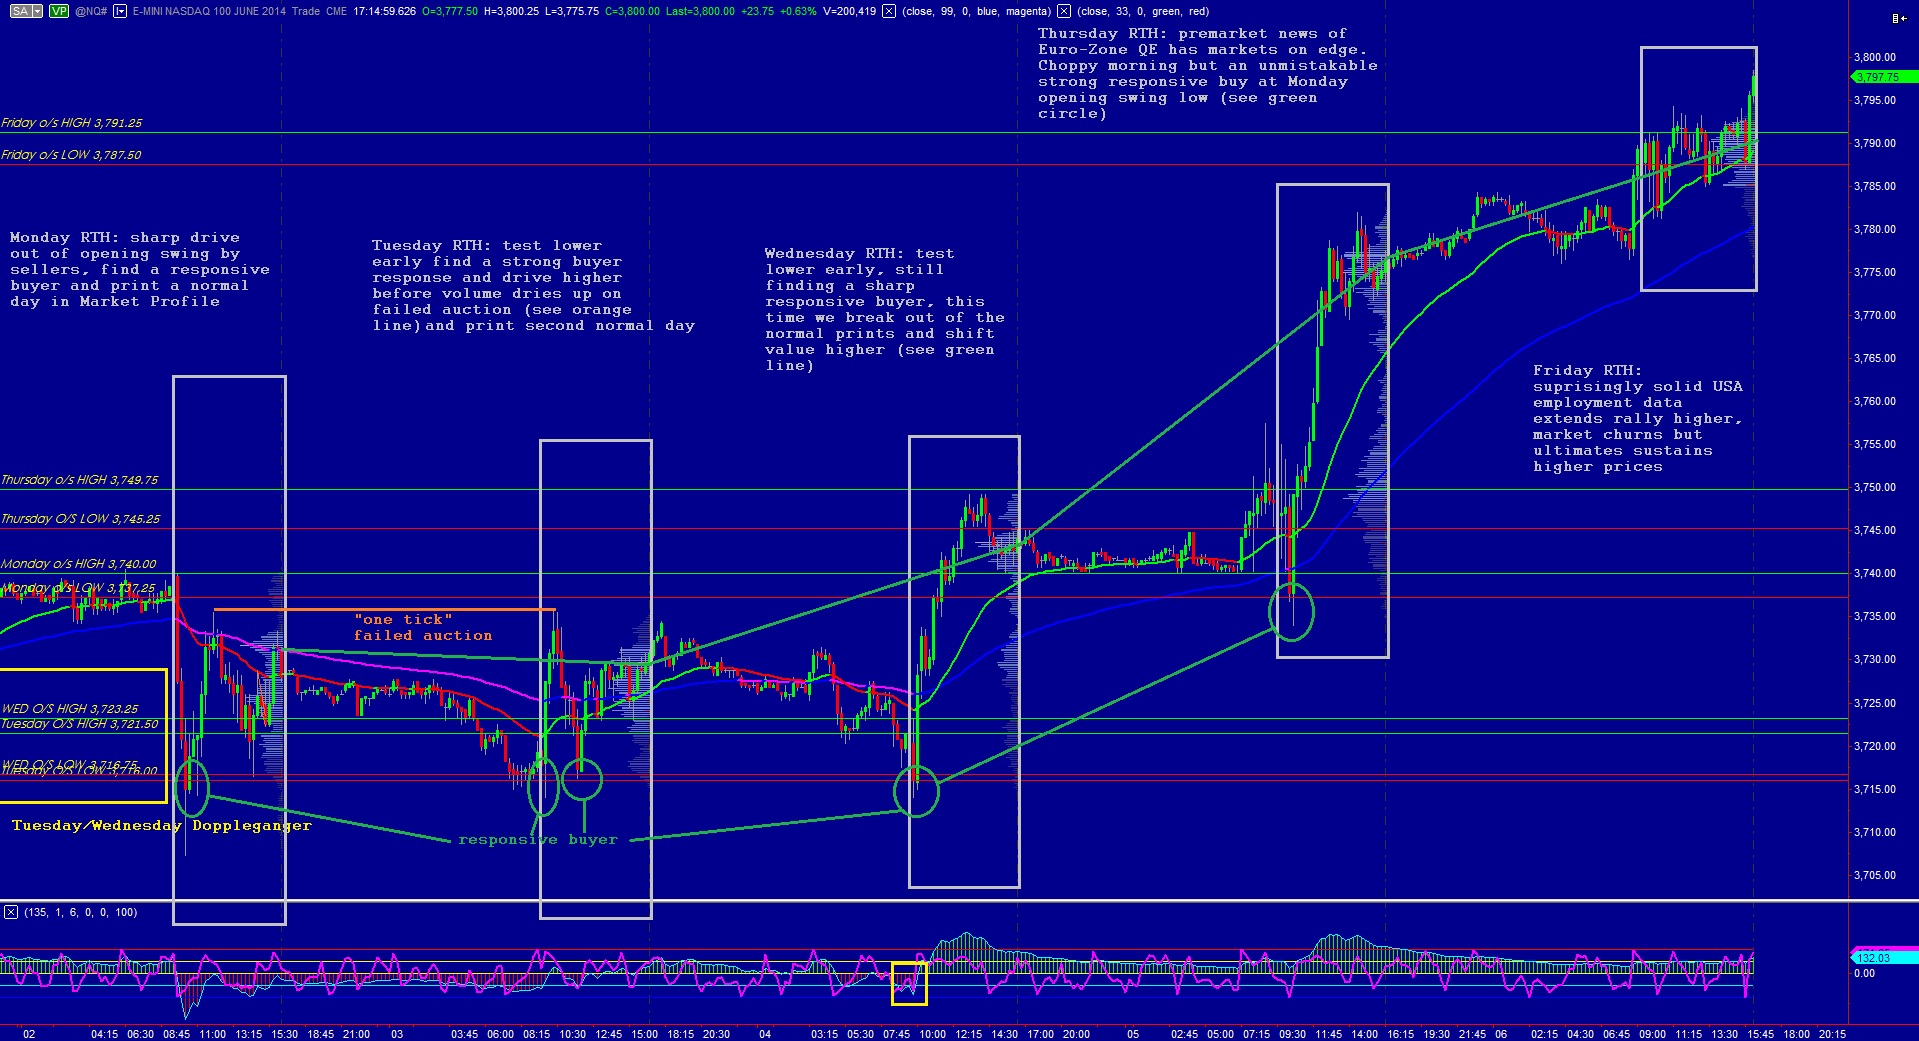
However, Thursday morning a huge unknown was removed from the market. Everyone worries about the Euro-Zone and usually we make a big story about their odd economy. However, they are taking the path of the United States, the path of free money and it has become very normal, almost an expectation of participants. These actions are what EVERYONE is watching, and MOST OF THE TIME they lead to higher equity prices. The employment data on Friday was a cherry on top, by no means a necessary to persuading the money into the market.
Anyhow, that is my view of the current investment conditions. This is speculation based upon what I hear people who I consider wise to the game focusing most intently upon. I like to focus intently on the auction. And without further adieu, I want to show you what a strong auction with fresh buyers coming into the marketplace looks like. See below:
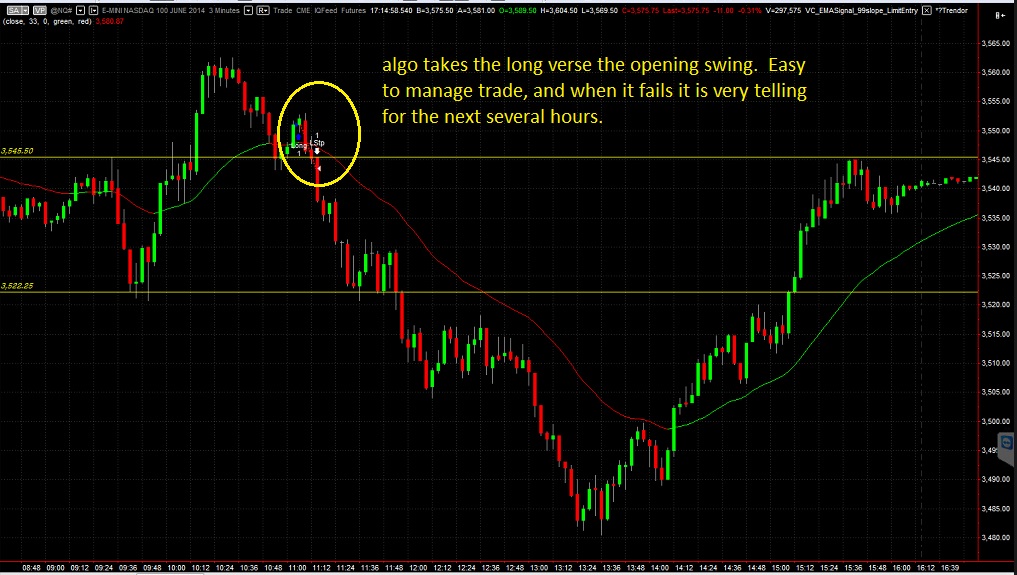
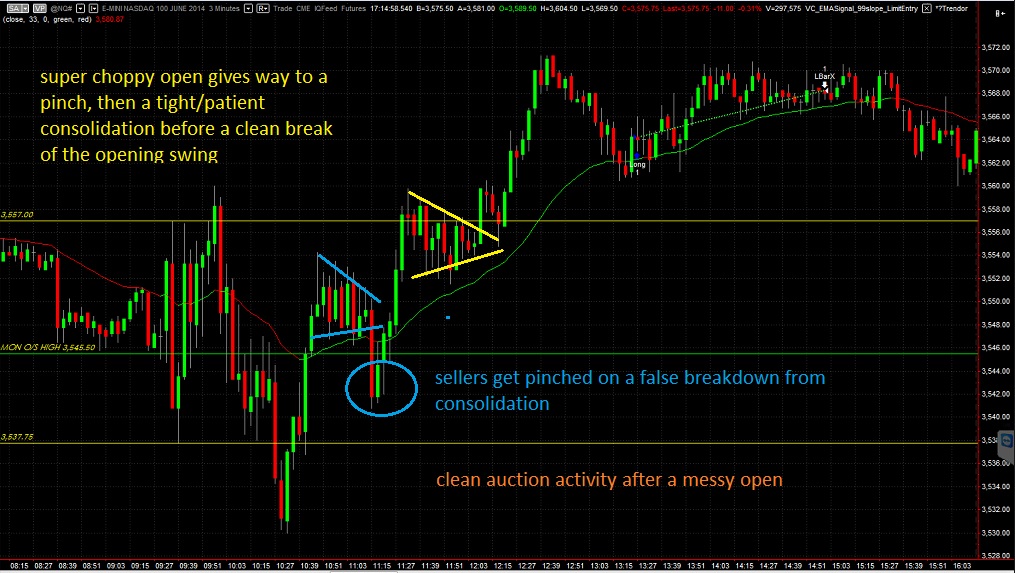
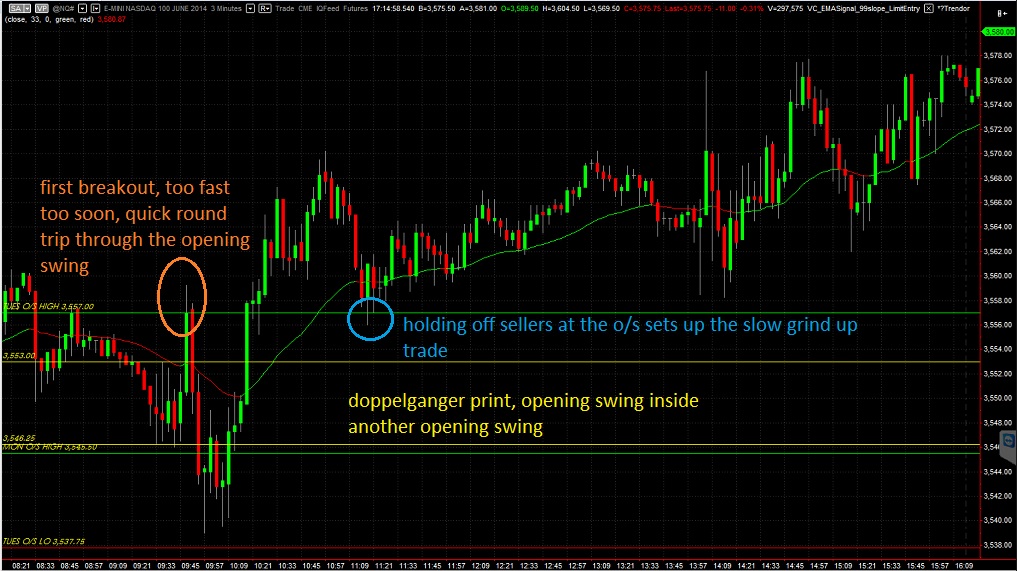
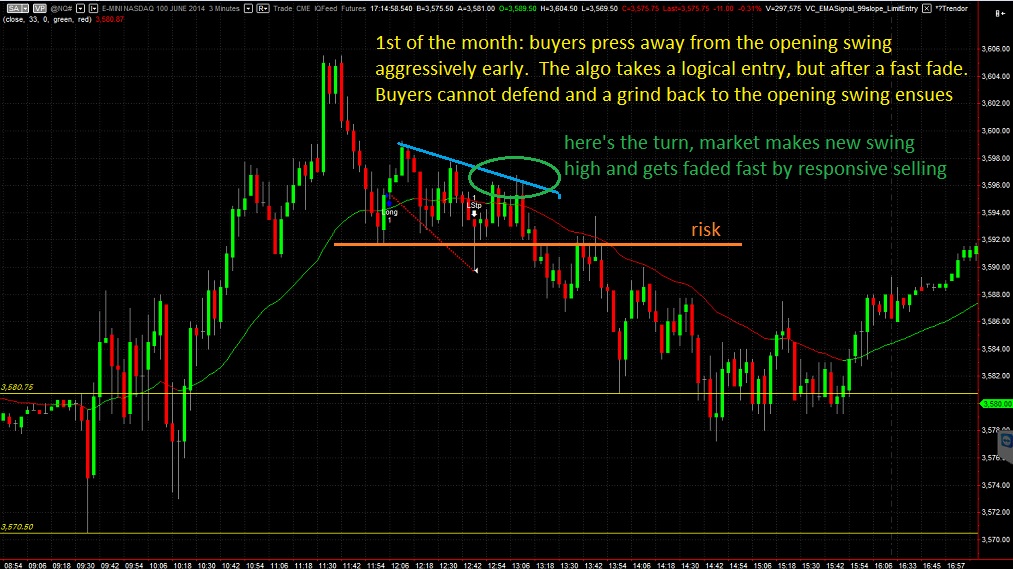
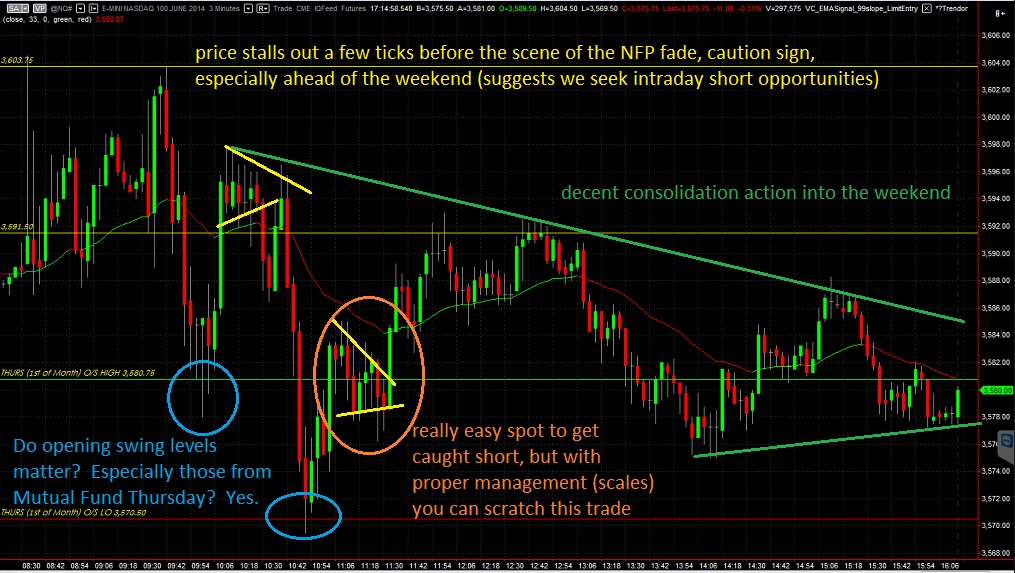
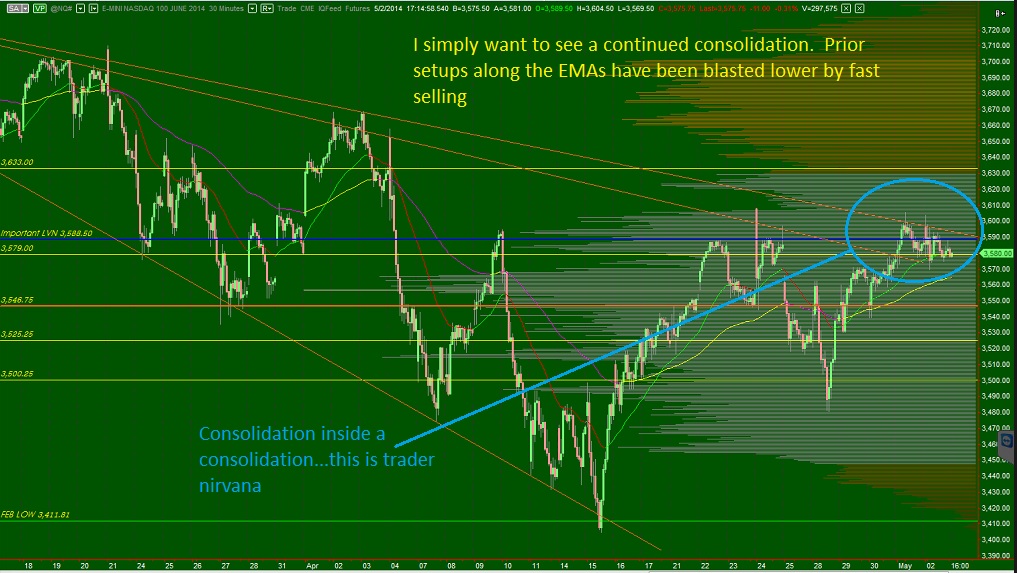
The opening swings this week were choppy and indecisive, but from them emerged several clean auctions. As the week progressed more and more opening swings piled up before we ultimately came into balance ahead of the weekend. Below you can see how the daily auctions played out relative to the opening swings and also an update to the intermediate term auction:
Equity futures gapped lower overnight displaying strong follow through on yesterday’s trend day. As the USA comes online the S&P is down nearly 10 points and the NASDAQ about 20. We have an hour until the cash session begins to recapture some of this downward progress but this is otherwise known as a pro gap. Essentially that means the risk is elevated beyond a level most retail traders can handle in the event they attempt to fade the move and close the overnight gap.
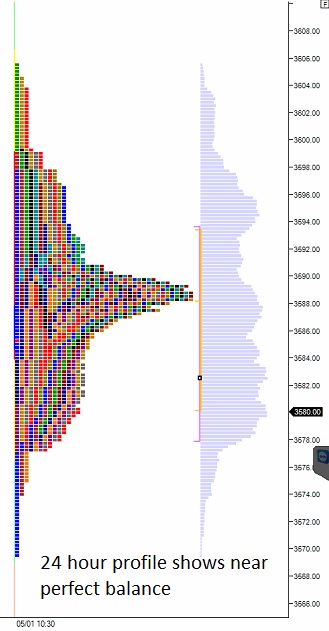
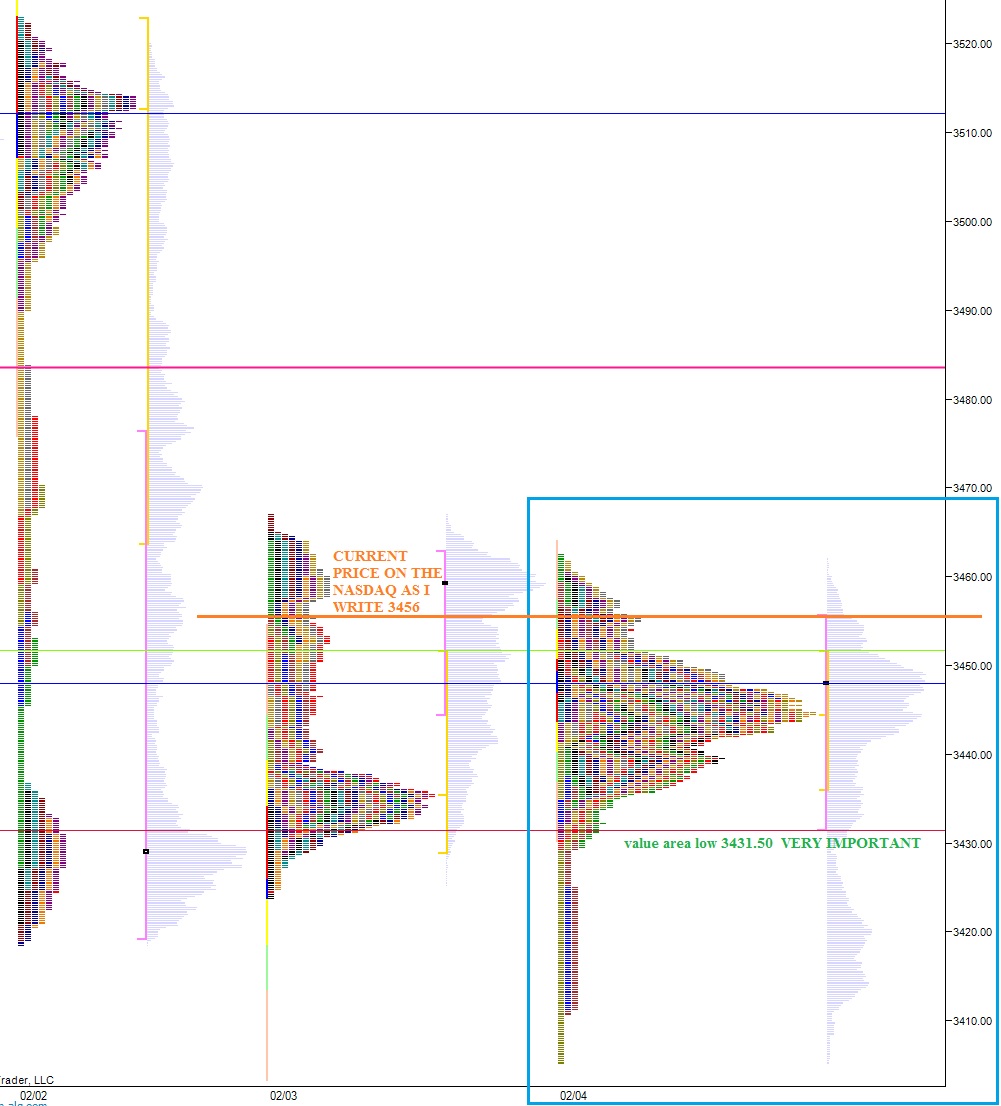
I am of the opinion that with the right tools we can formulate a sound method of participating in this gap, and the most important tool today is market profile. On Wednesday morning, I highlighted two key price zones which tell the story on the NASDAQ. One was a low volume price zone above. We traded ALMOST the entire range of that upper zone before stalling and being rejected out. Auction logic would suggest a move to the lower end of this bracket to see if buyers possess the same conviction they had down here. This takes us to February 4th, a rather interesting day. Have a look:
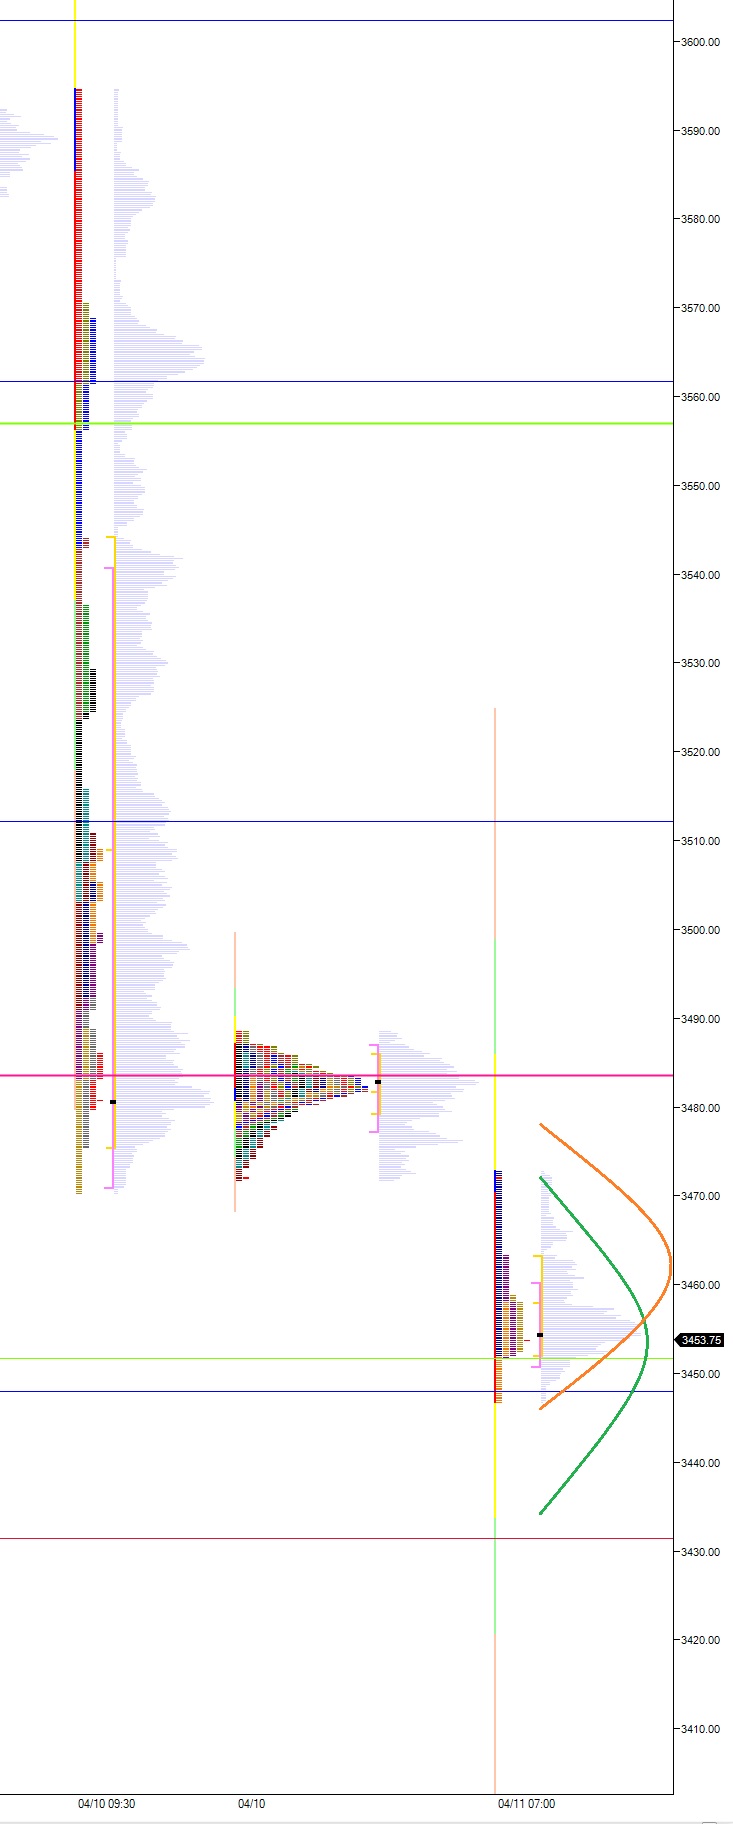
I won’t get too deep into observation of the above except to say this type of well defined profile structure is VERY useful for leaning on. I will look to buy as close to the value area low at 3431.50 as possible. Here’s the current market profile picture:
The intermediate timeframe auction is in clear seller control. They have this timeframe locked into a pattern of lower highs and lower lows. I have highlighted a few very interesting low volume nodes we are coming into this morning on my volume composite:
Finally, the long term auction. On the daily I show balance with sellers still pressing. But on the weekly, there is something keeping me on the buy side, a squiggly line. We may overshoot this reference point, given the markets current velocity, but I am leaning on this level nonetheless until we make a clean break:
Futures traders had some action early this morning when equity futures abruptly fell out of balance and knifed lower. The wave of selling rolled in around 5am and it was soon met with responsive buying. The overnight profile shows no clean consensus on value and we are currently trading near unchanged in the NASDAQ.
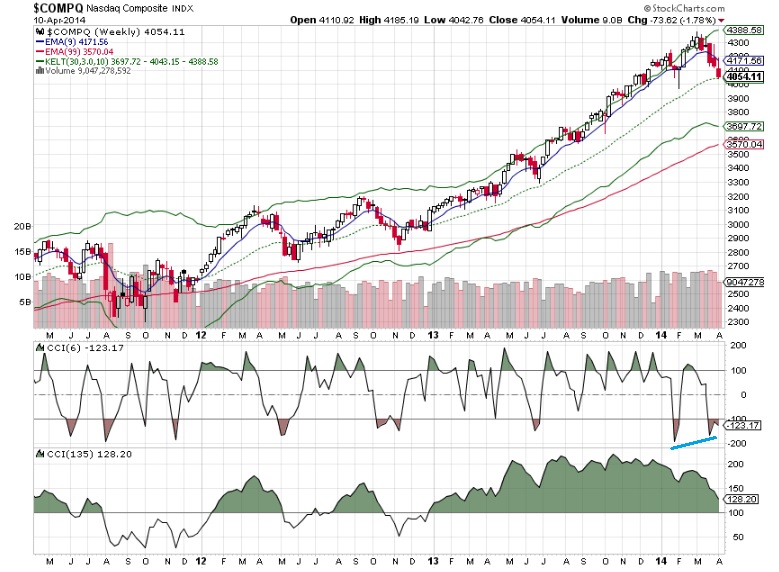
I will always buy the first test of my EMA if I feel the chart is still trending and the EMA resides at a higher low then our previous swing high (or lower high then our previous swing low). However, the buying is typically the easy part of this trade. Knowing whether the trend will resume or whether price will roll tide back is the management key. The very long term auction as seen on the weekly composite chart is still buyer controlled. We were buyers ahead of the 33 EMA which has now edged higher to touch the low print. Did you know moving averages move? See below:
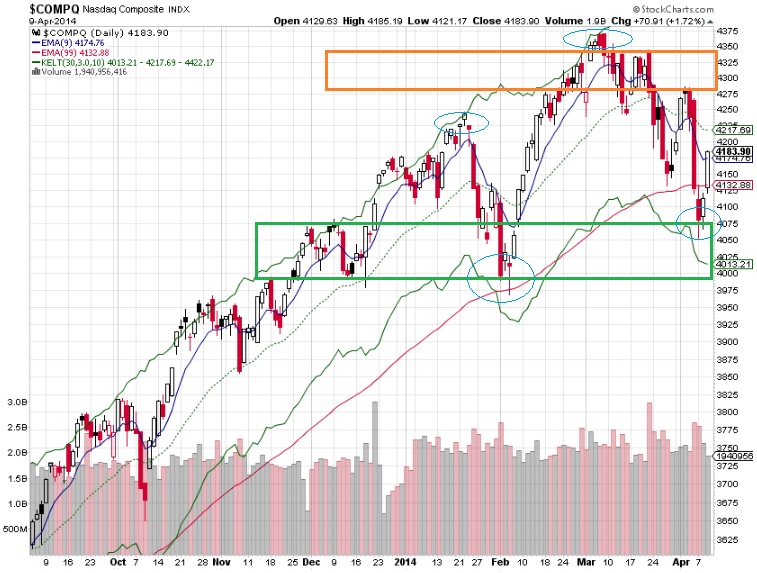
The daily chart which I most commonly refer to as the long term auction is no longer a clear picture of buyer control. Our EMAs are not in full alignment and our longest term EMA, the 99, is flat. We have also seen a pattern of lower highs and lows recently and it appears the long term timeframe is in balance. Now buyers and sellers must slug it out before one or the other becomes the clear controller of the long term auction. However, buyers have a slight control edge remaining (see blue circles on major swing levels). See below:
The intermediate timeframe is seller controlled. Their control can be seen as a series of lower highs and lows. Yesterday’s action was dynamic and powerful to the upside, but until we see a higher low printed, the sellers have the ability to assert control on this timeframe. I have removed all the lines I normally keep on this chart so we can more clearly view the seller control. There are some very interesting low volume nodes if you click and enlarge the chart, and these make great entry points because they often see “hot plate” type reactions:
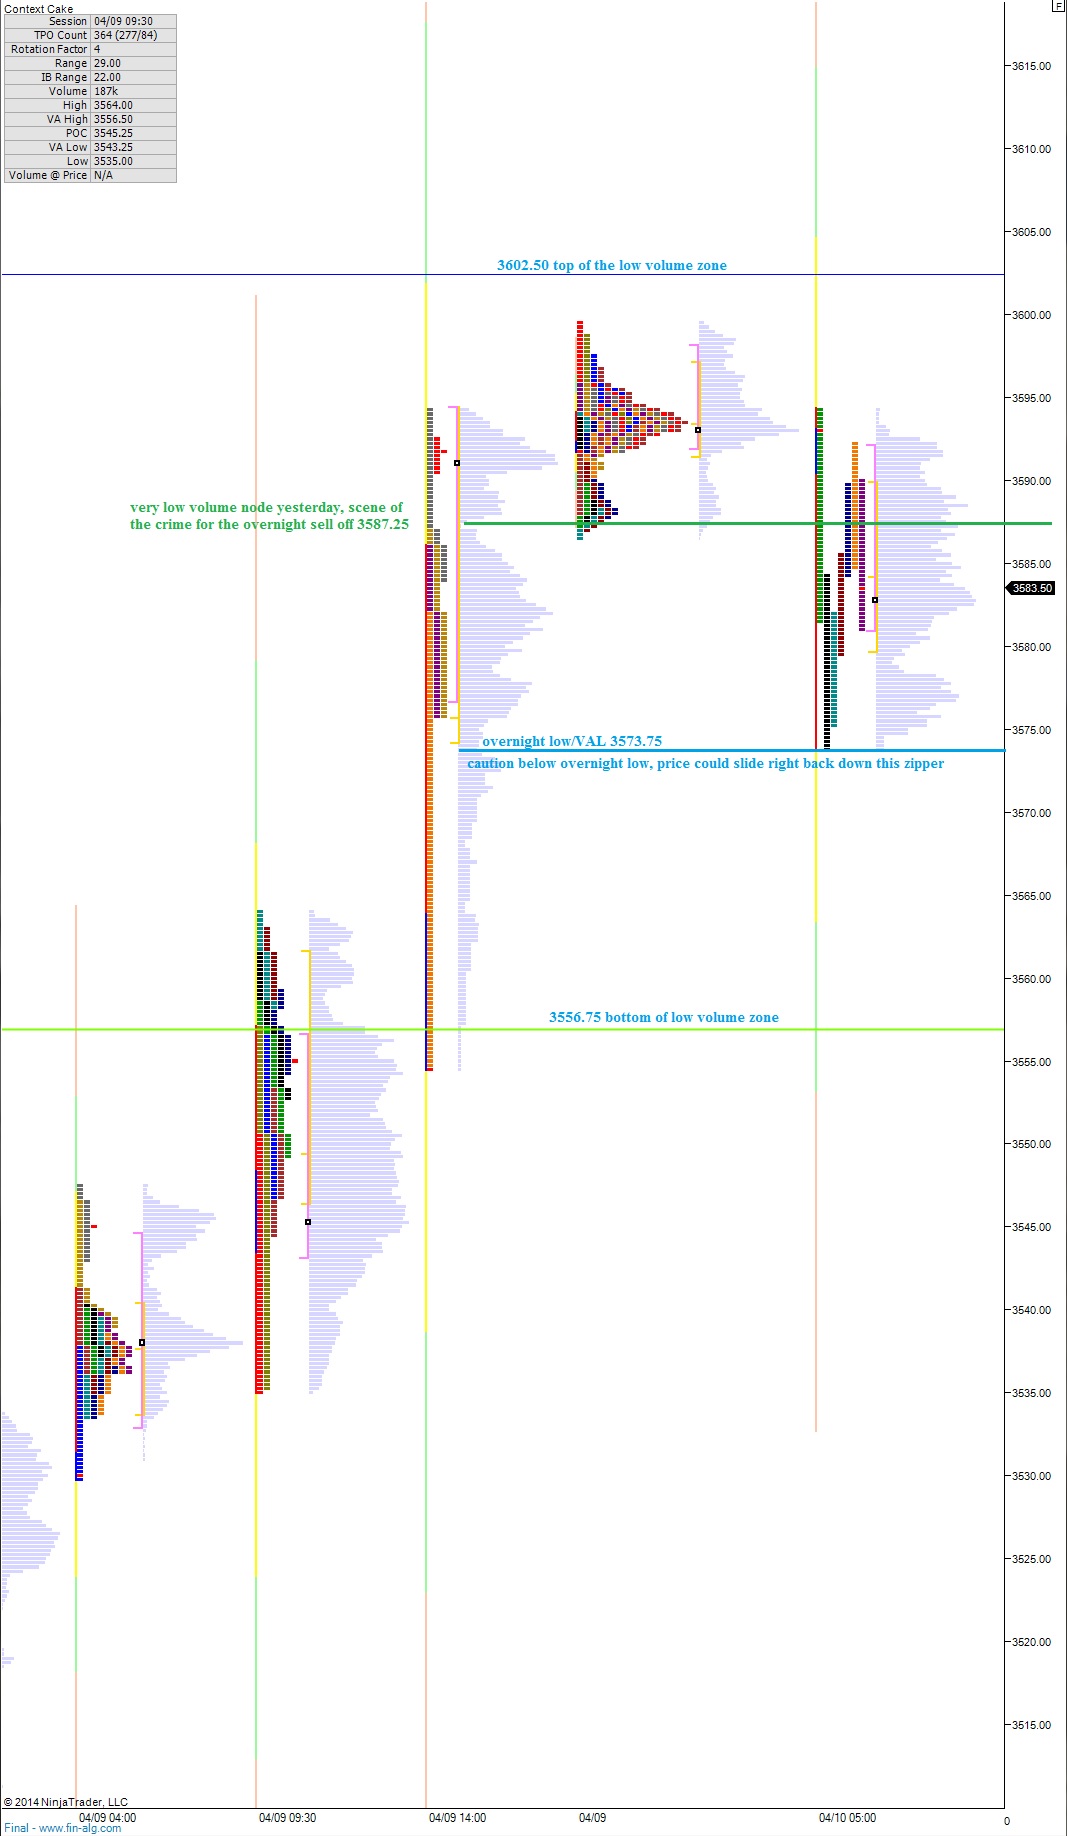
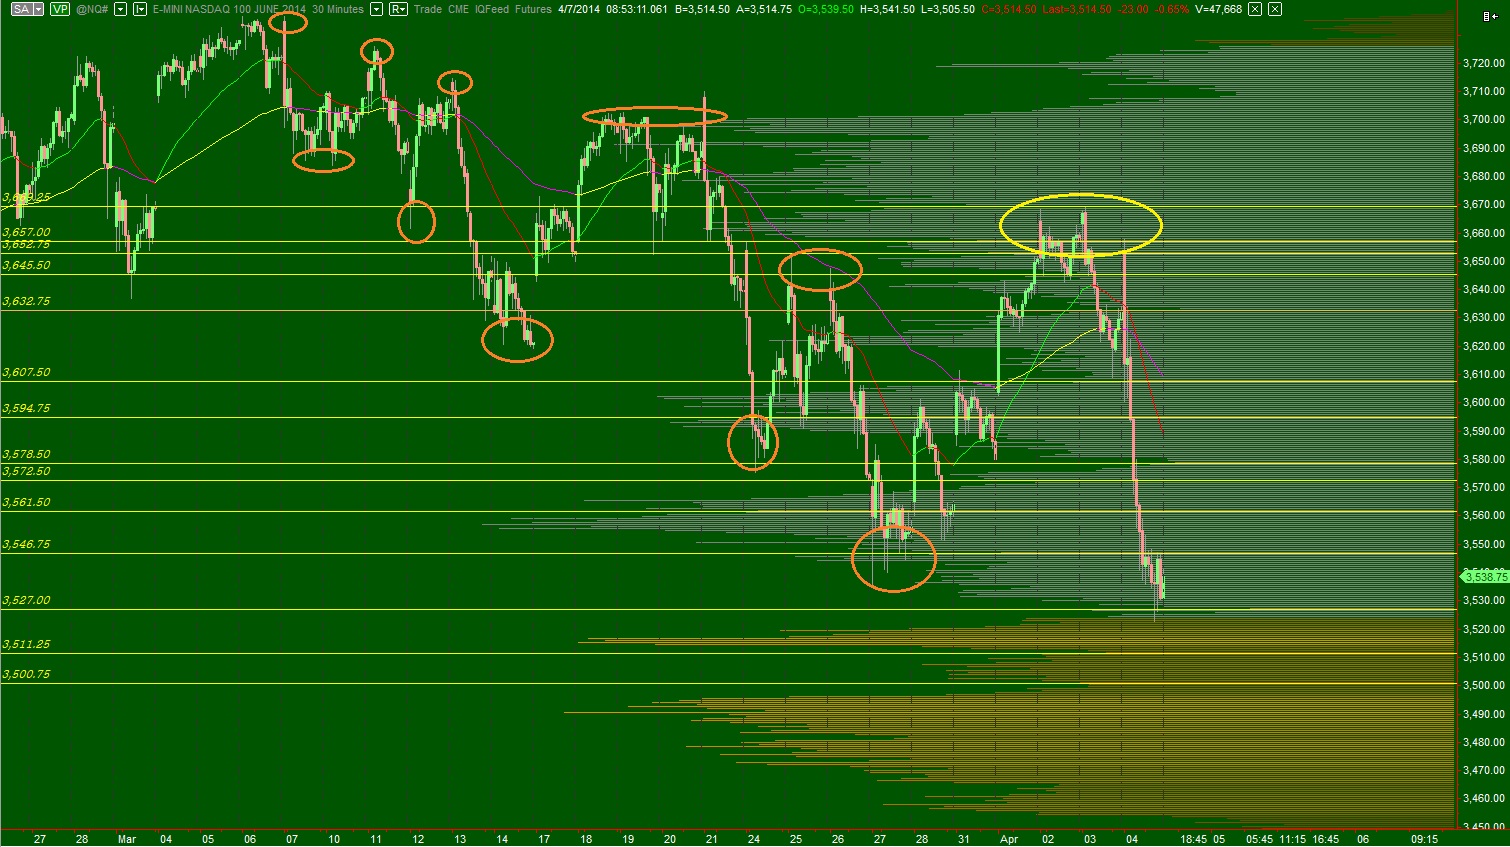
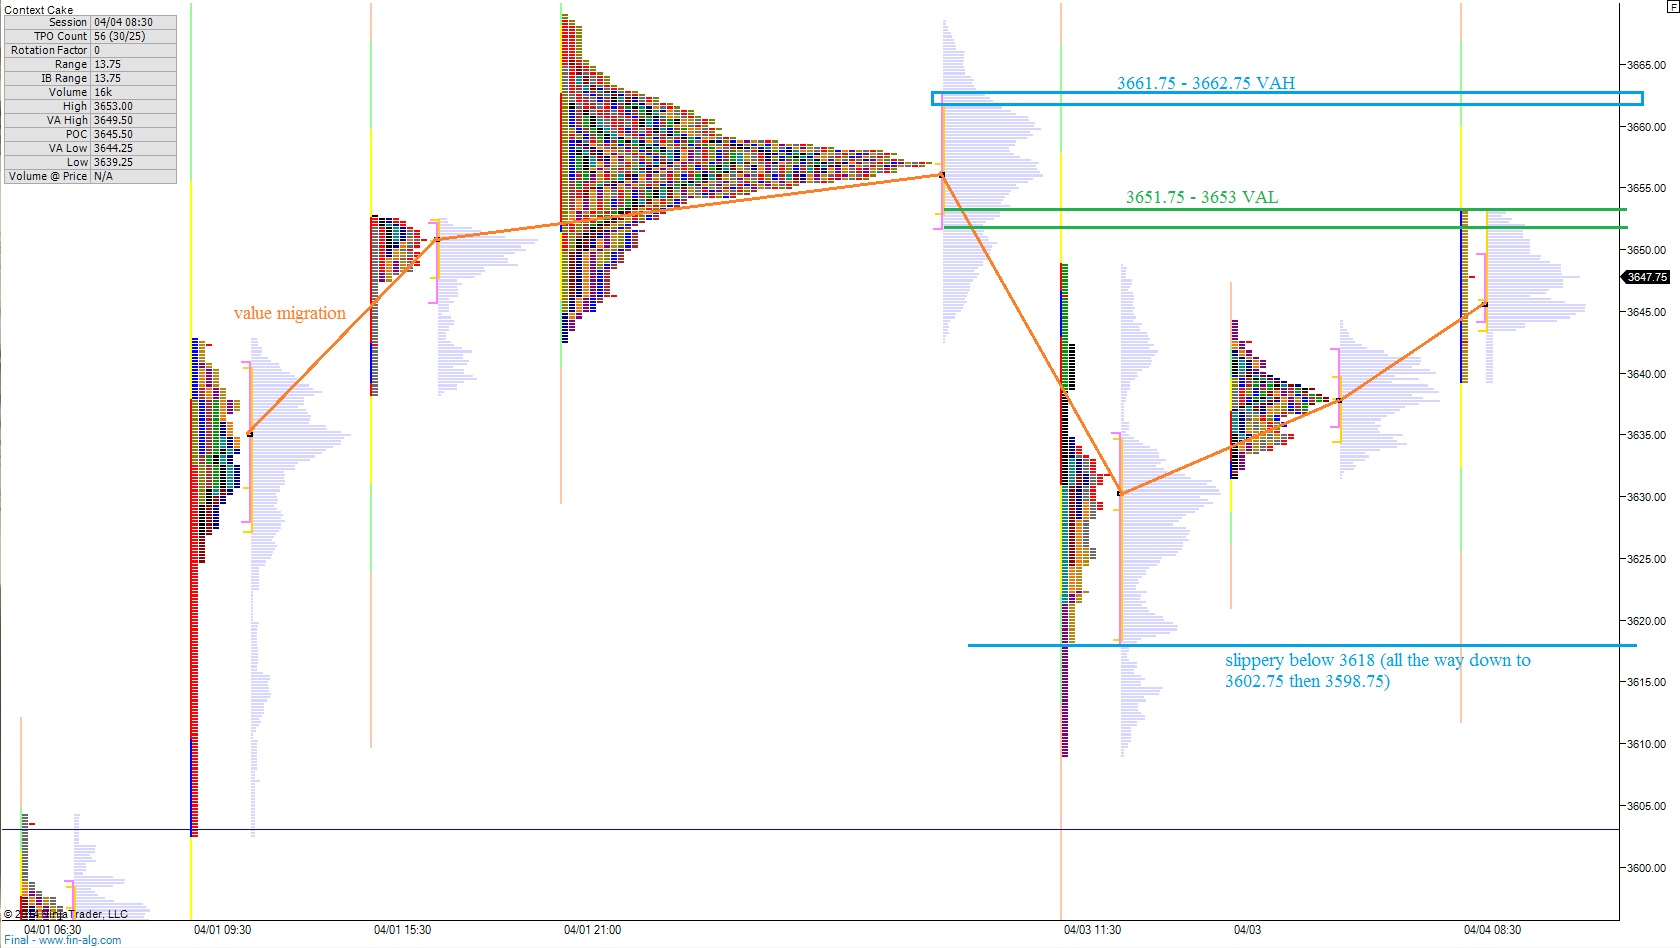
The short term auction is buyer controlled. This can be seen as a migration of value higher as well as strong responsive buying tails on the recent profiles. We are trading inside the price zone I highlighted yesterday as a low volume slip zone. This zone is so important. If buyers can finish trading up through it, and then gain acceptance via value up above 3602.25, this would translate well into gaining control of the intermediate term at best, putting the intermediate term auction into balance at the least. I have highlighted this interesting zone on the following market profile chart as well as a few other observations:
Index futures are down overnight as the selling which quickly began mid-last week spilled into the globex session. The entire move was quite exhausting as the USA comes online we are seeing some early buying interest.
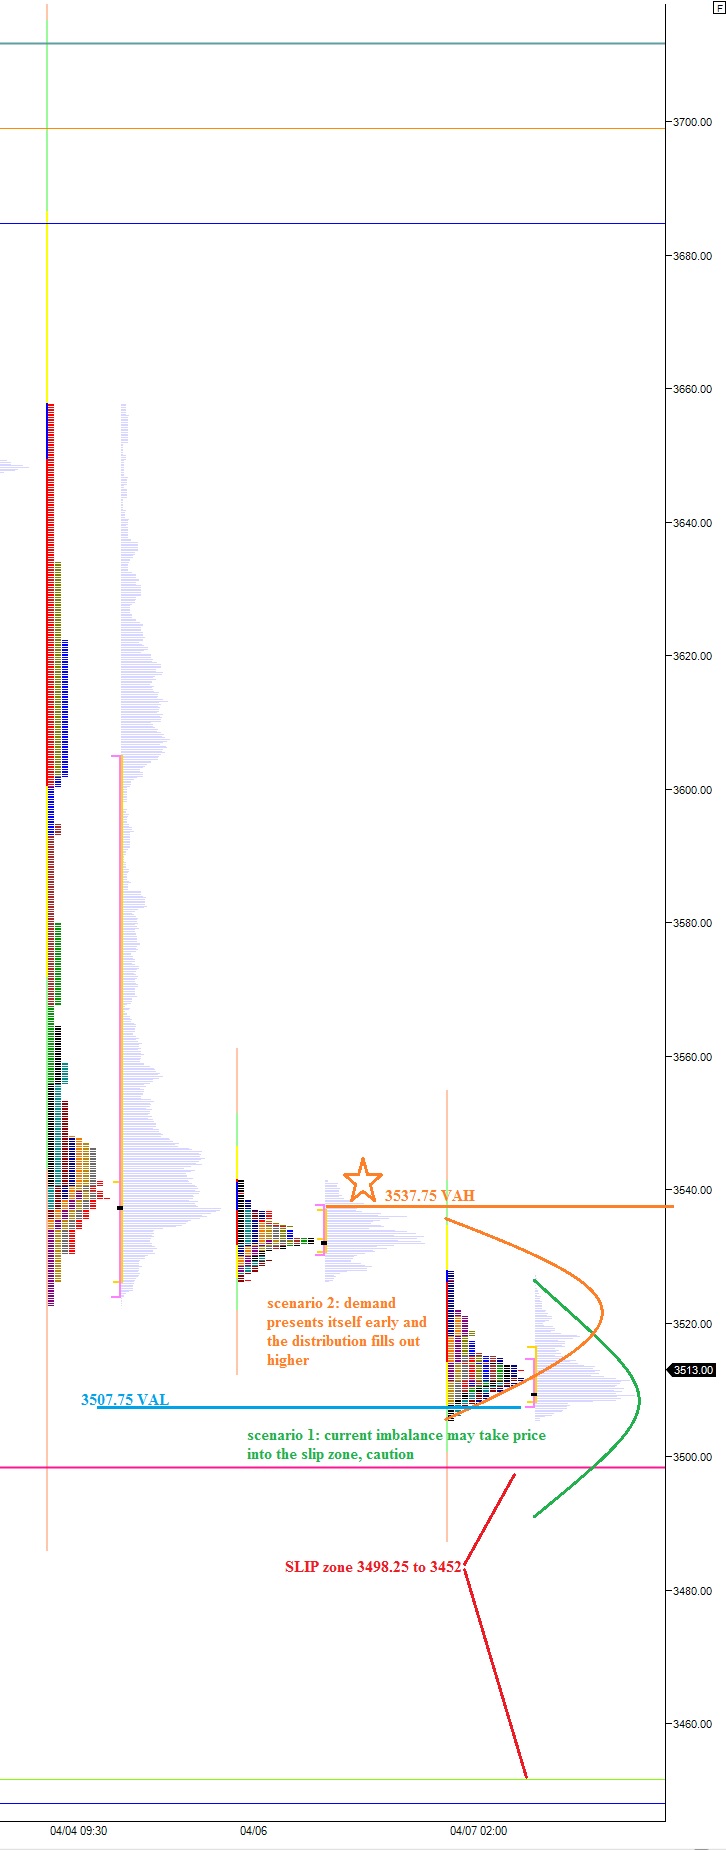
My main focus today is on the short term auction. Price has come down to a very interesting level on my market profile. We are reaching a level where demand was once very high for equities. I can tell this by the dynamic footprint which was left behind as a long and thin single print of TPOs. As we come into it from above, the risk is slipping down the4 viscous slope where demand once existed. The contrary move would be for us to not breach the upper reference point just before the slip zone. I have highlighted where this slip zone begins and ends on the following market profile chart. Should we not breach this level, I may be a buyer early on:
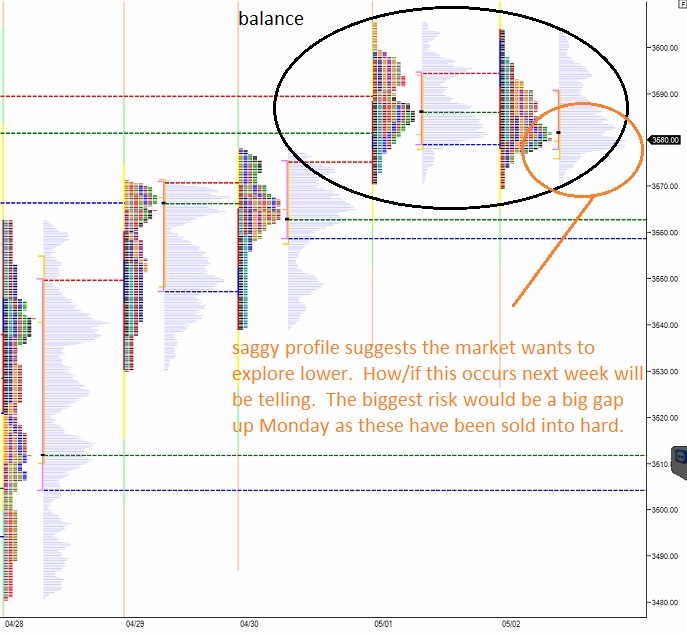
The intermediate term is seller controlled after briefly coming into balance. The market was able to make a higher low, higher high briefly before the big liquidation snap Thursday and Friday. For a moment we came into balance but when price travelled into overhead supply the market became overwhelmed with sell flow which was abundant compared to demand which was nearly non-existent for the two days. Since then we have made a lower low putting sellers in control. I suspect a revision trade will take hold at some point this week and return price to my EMAs. I have highlighted a few key price levels on the following volume profile composite. We are set to open nearest to 3511.25:
The long term auction is certainly in question. One could perhaps make the case for buyer control based on the February low being below here. I am not quite as clear on the long term. I will call it buyer controlled with a 50% chance of balance taking hold.
The NASDAQ futures drifted higher over night on low volume ahead of the jobs report at 8:30am. The initial reaction to the jobs report was a move higher. The report itself was mediocre-to-decent news thus an initial positive reaction is good, but not of the strongest conviction. The strongest conviction would be a positive reaction to a bad employment report. The strength was quickly faded by a strong bit of sell flow. It looks like the opening may be interesting today.
The long term time auction is buyer controlled. This can be seen as a series of higher highs and lows on the a daily chart of the NASDAQ composite. If sellers can succeed over the next few days at printing a lower high verses March, we will likely see the long term auction transition into a balanced state.
The intermediate term auction is in balance. Overhead supply came into effect yesterday morning and the resulting trading day was a press lower. The action probed prices back to the midpoint of this intermediate term balance where my expectation was to find buying. I will be watching the price action around 3632.75 for an early directional bias on the day. I have highlighted this level and a few other observations on the following volume profile chart:
The short term auction is very indecisive but I would call it a semblance of balance. Value is roaming somewhat aimlessly. We have a strong developed profile overhead which price rejected away from yesterday and since then we have been inching back upward toward the reference zone. I have highlighted this key upside profile as well as a few other observations on the following market profile chart: