Nasdaq futures are down to start the new quarter, and as we approach US market open prices are trading near yesterday’s low. Late yesterday afternoon the markets were informed the Ebola virus had made its way into the United States. Other overnight news included mixed manufacturing data out fo Europe, inline manufacturing data from China, and USA ADP Employment change coming in slightly better than expected. The last four days we have had an aggressive seller working in the premarket session not long before cash open. They are again active today. At 10am we have ISM manufacturing as well as Construction Spending. Energy traders will likely focus on the Crude Oil and Gas/Distillate Inventory numbers at 10:30am.
Furthermore, German Bund futures ripped through prior all-time highs this morning which resulted in a powerful reaction lower in German equities. Macro conditions are running high however the correlations have not significantly impacted individual equities yet. And as we approach cash open the Russell is attempting a slight bull divergence on the very short term timeframe.
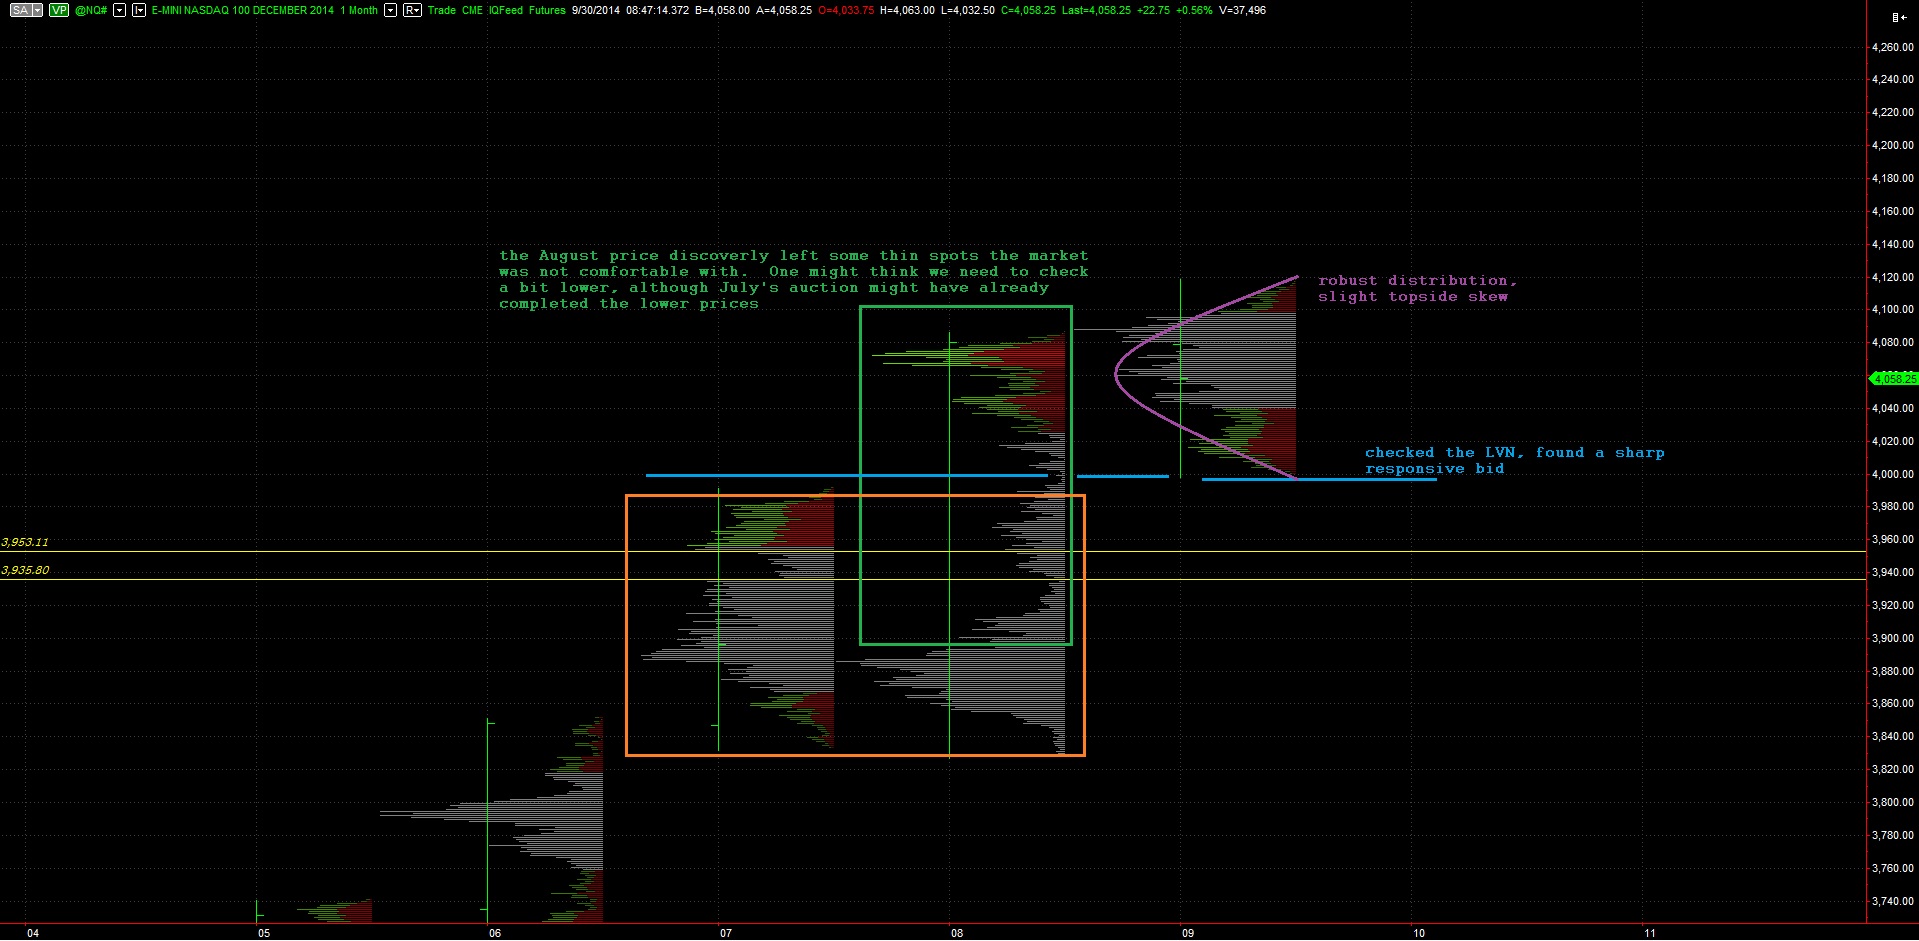
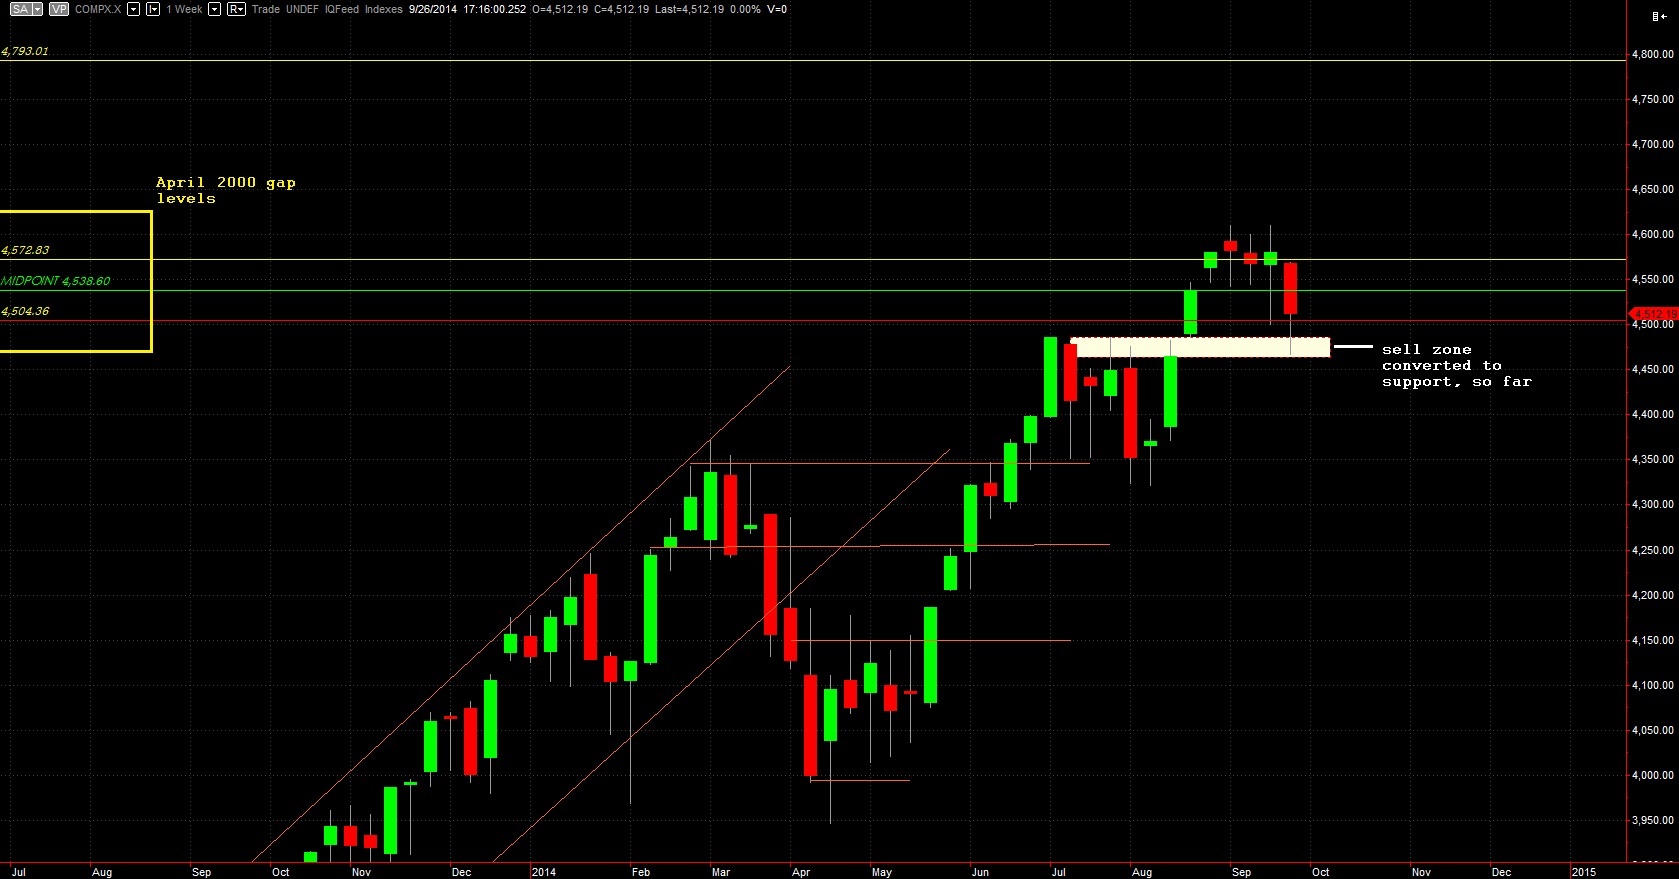
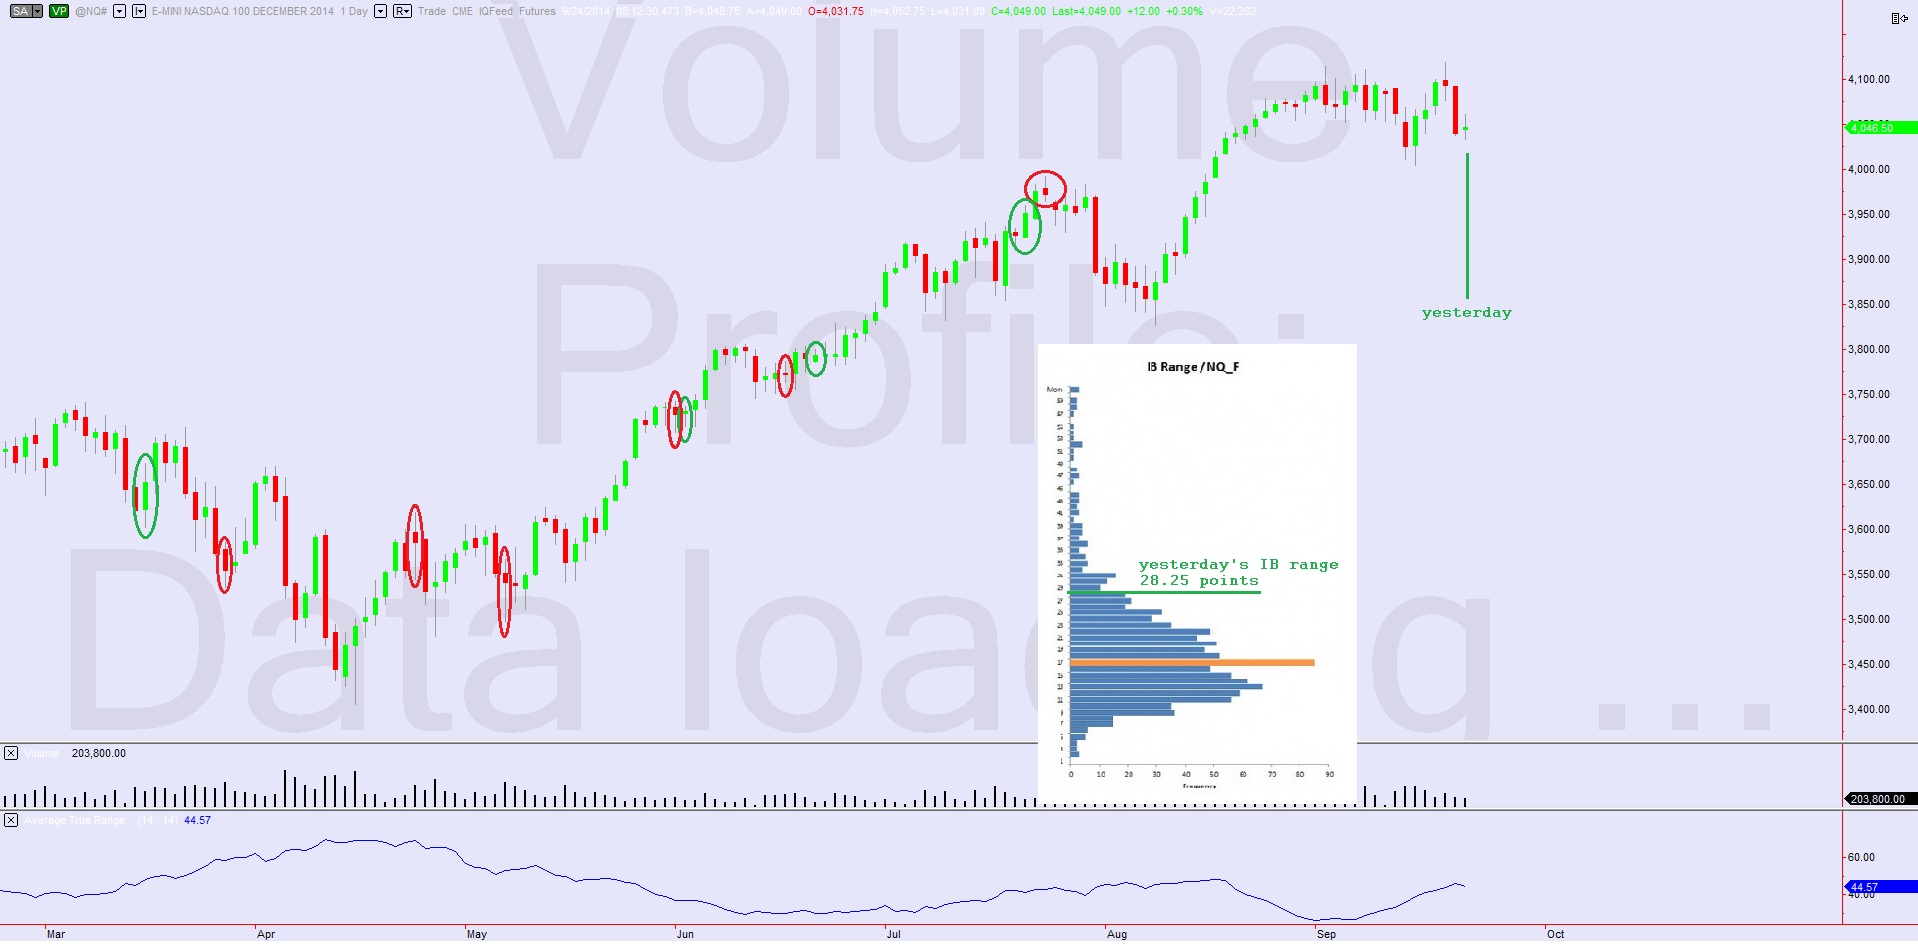
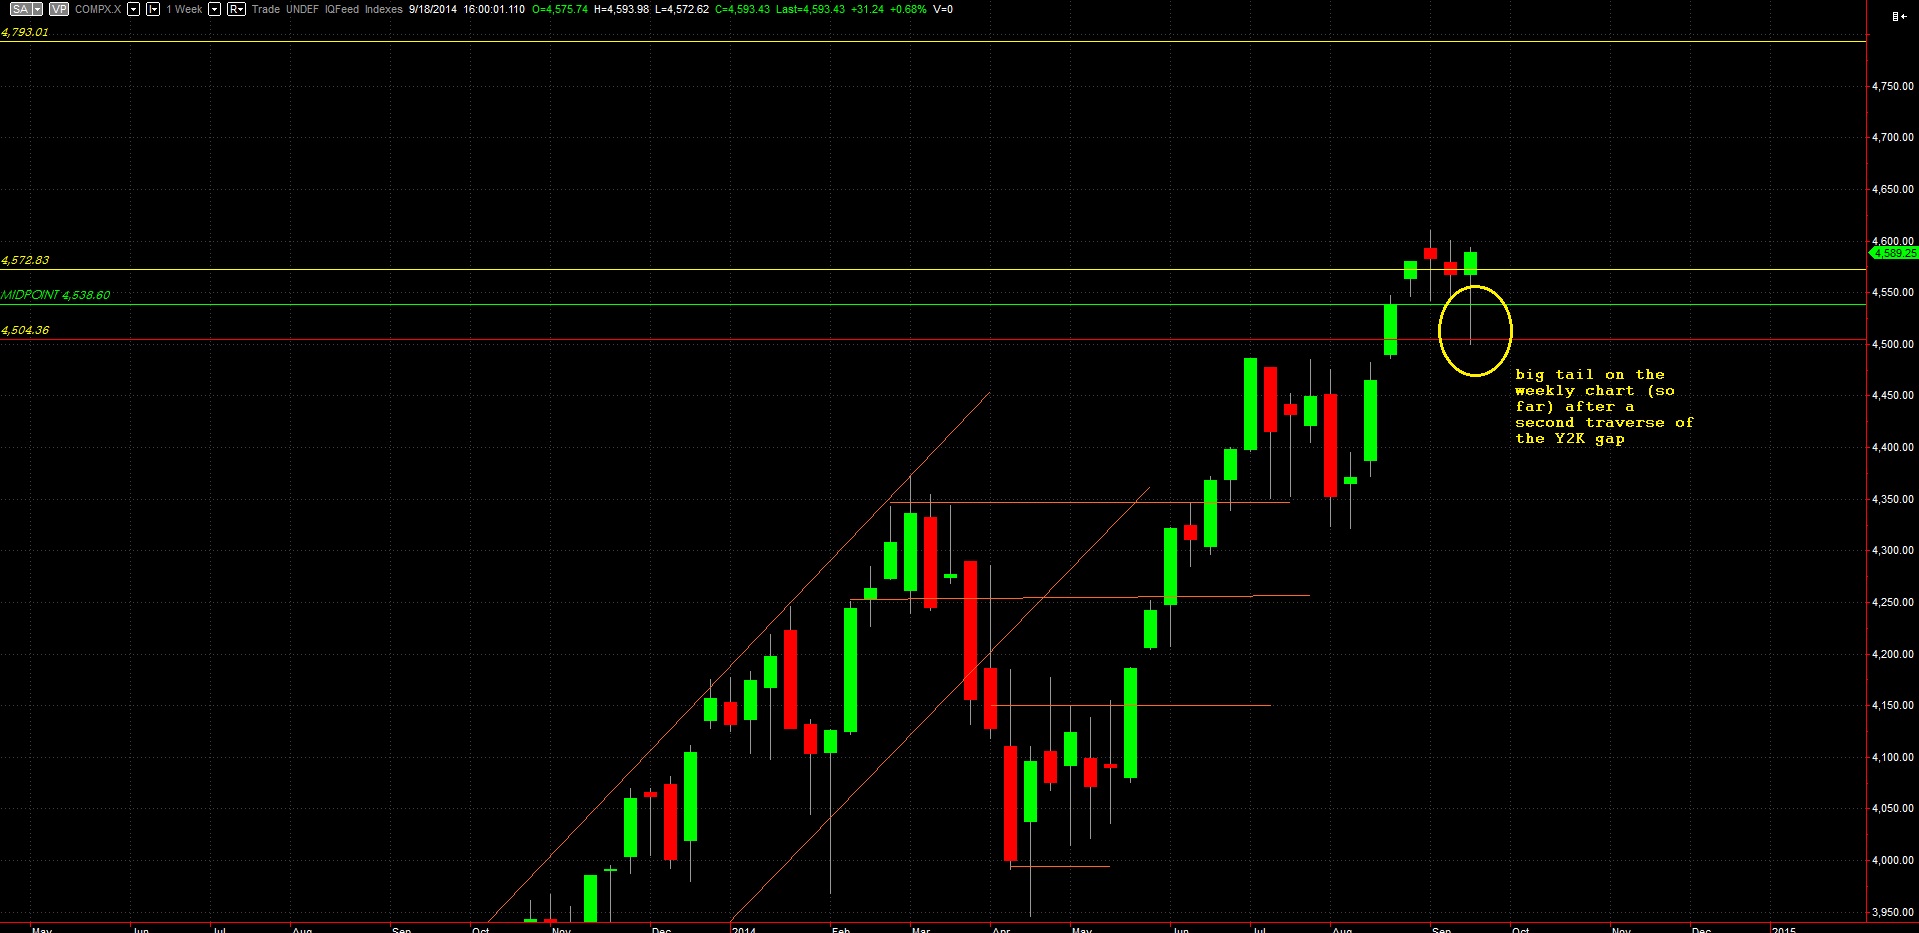
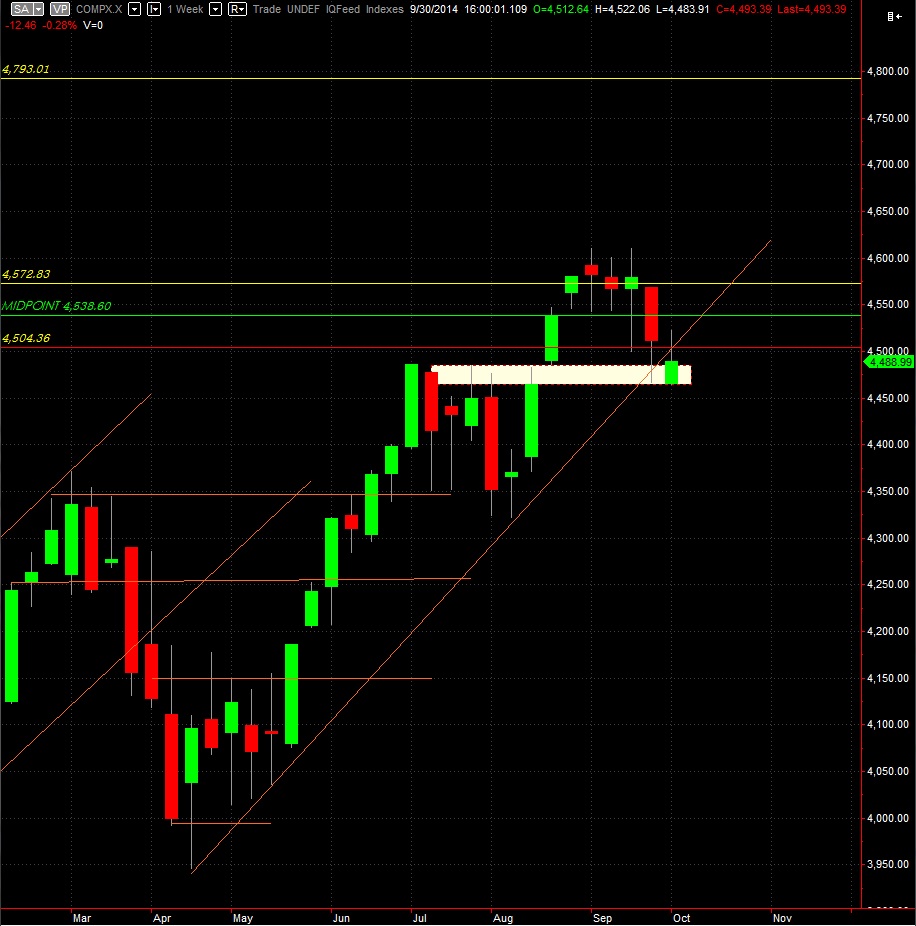
Again visiting the long term chart of the Nasdaq Composite, we can see prices are in a zone where sellers initially held us down. Since then, we broke higher, rotated through the dot com gap, and are now retesting the zone from above. This long term timeframe remains buyer controlled and in a support zone. Long term bullish:
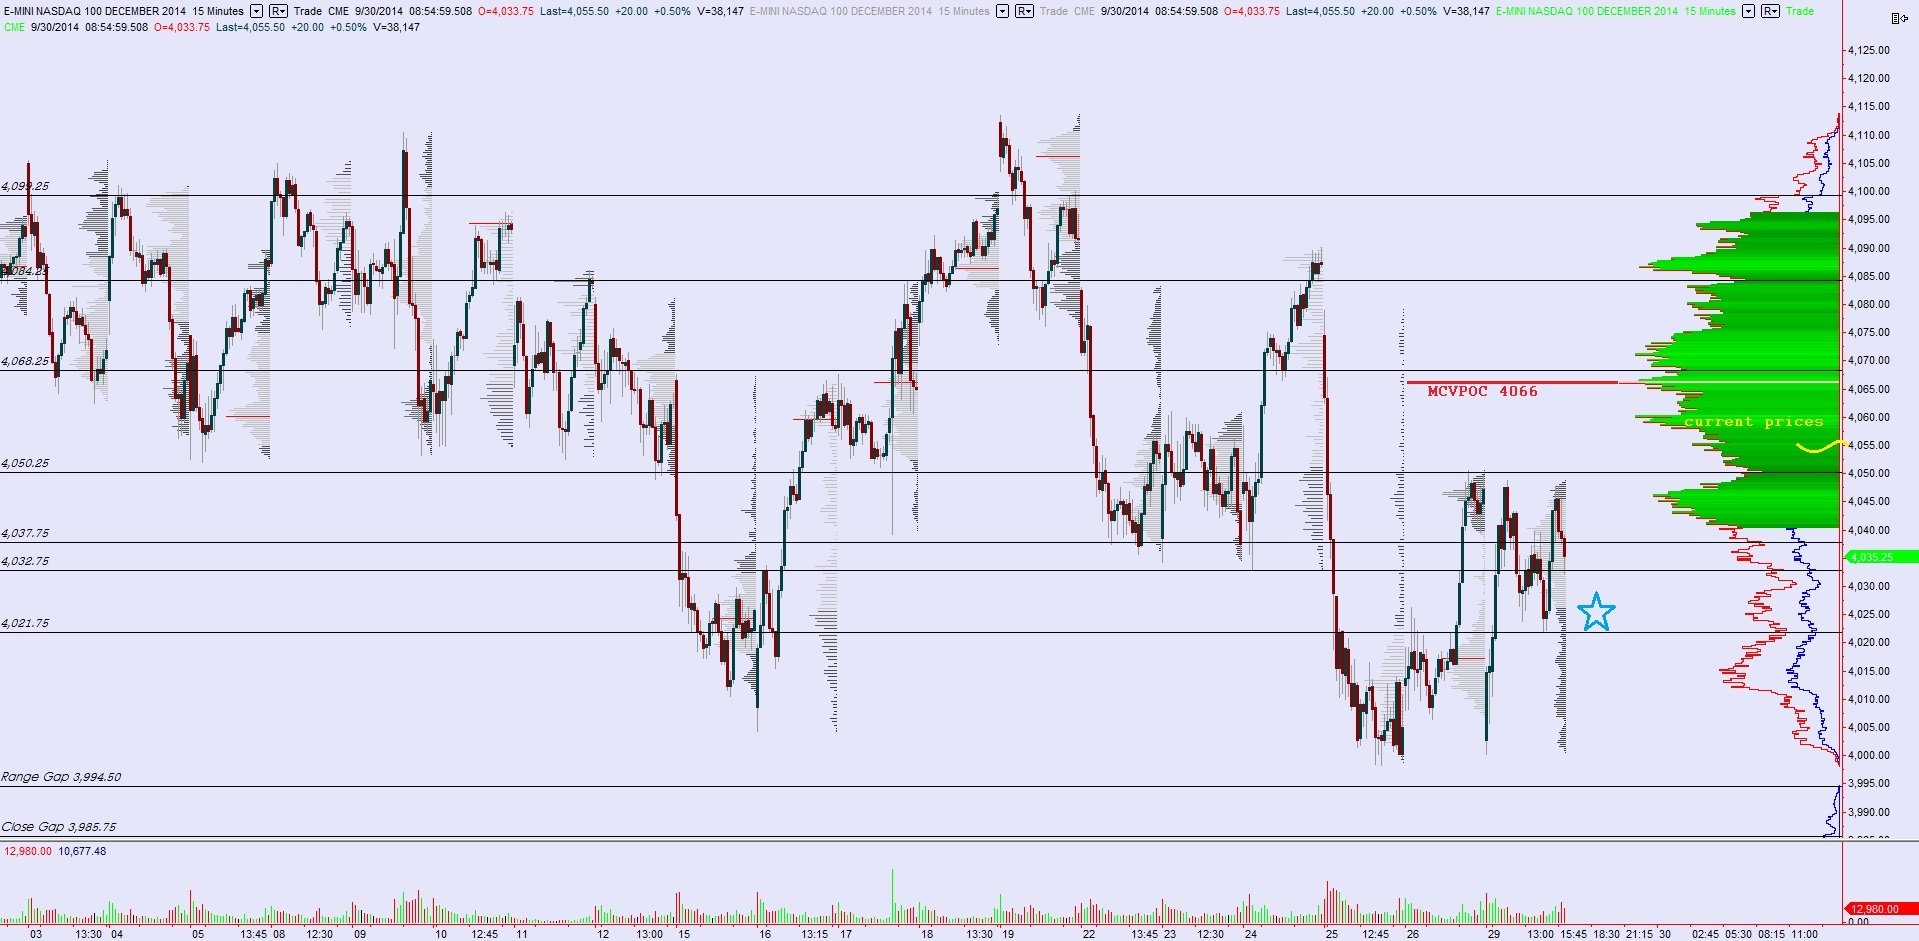
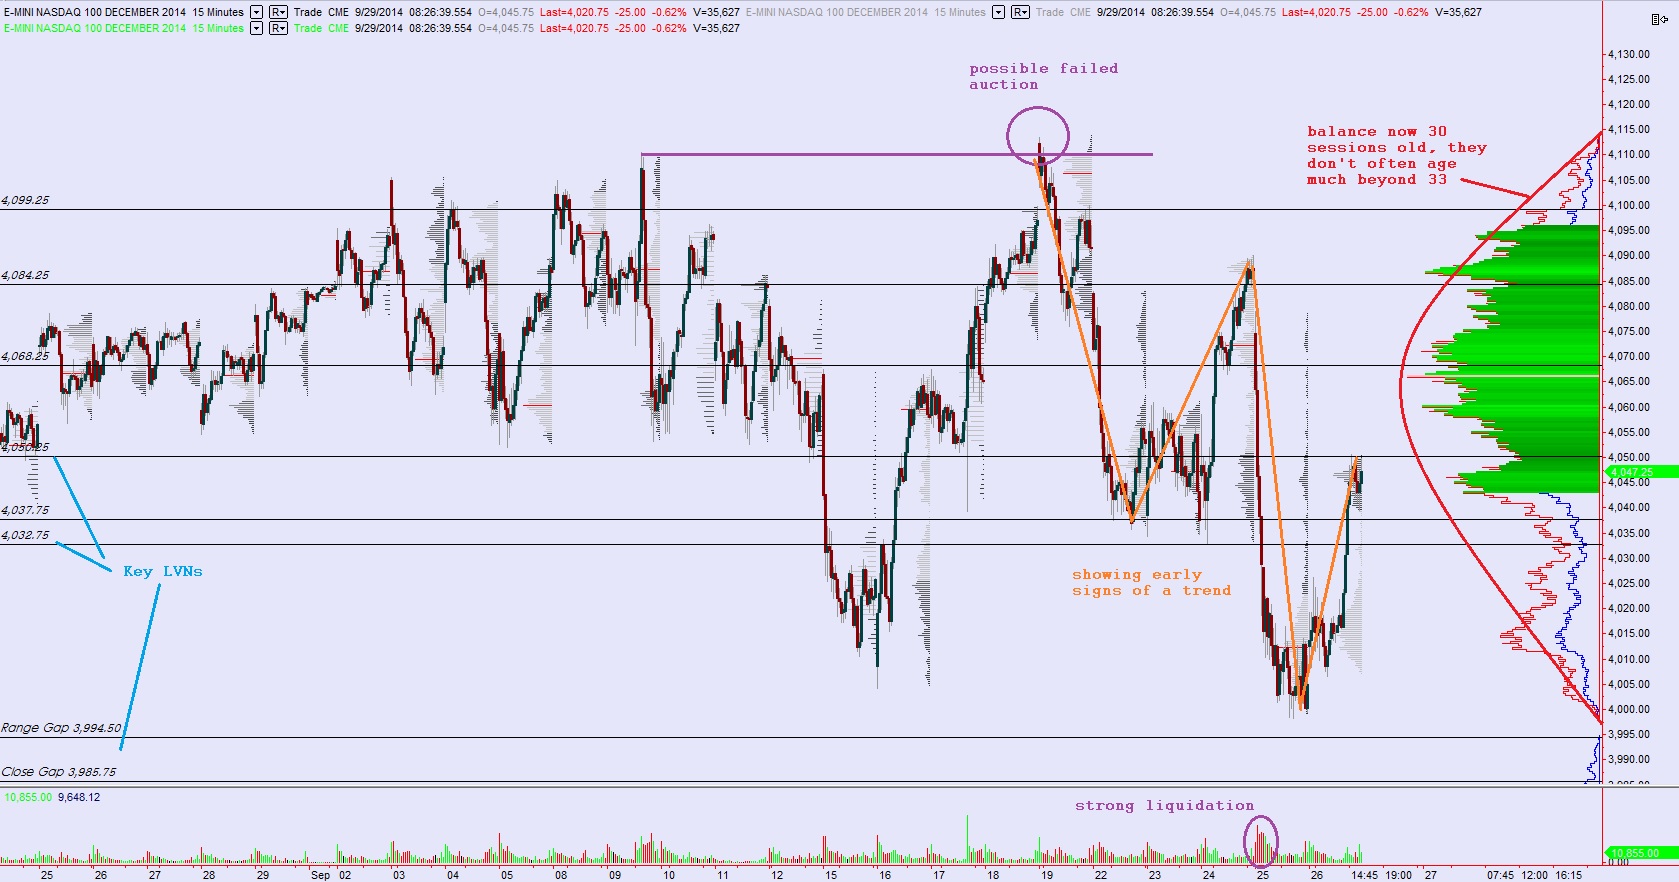
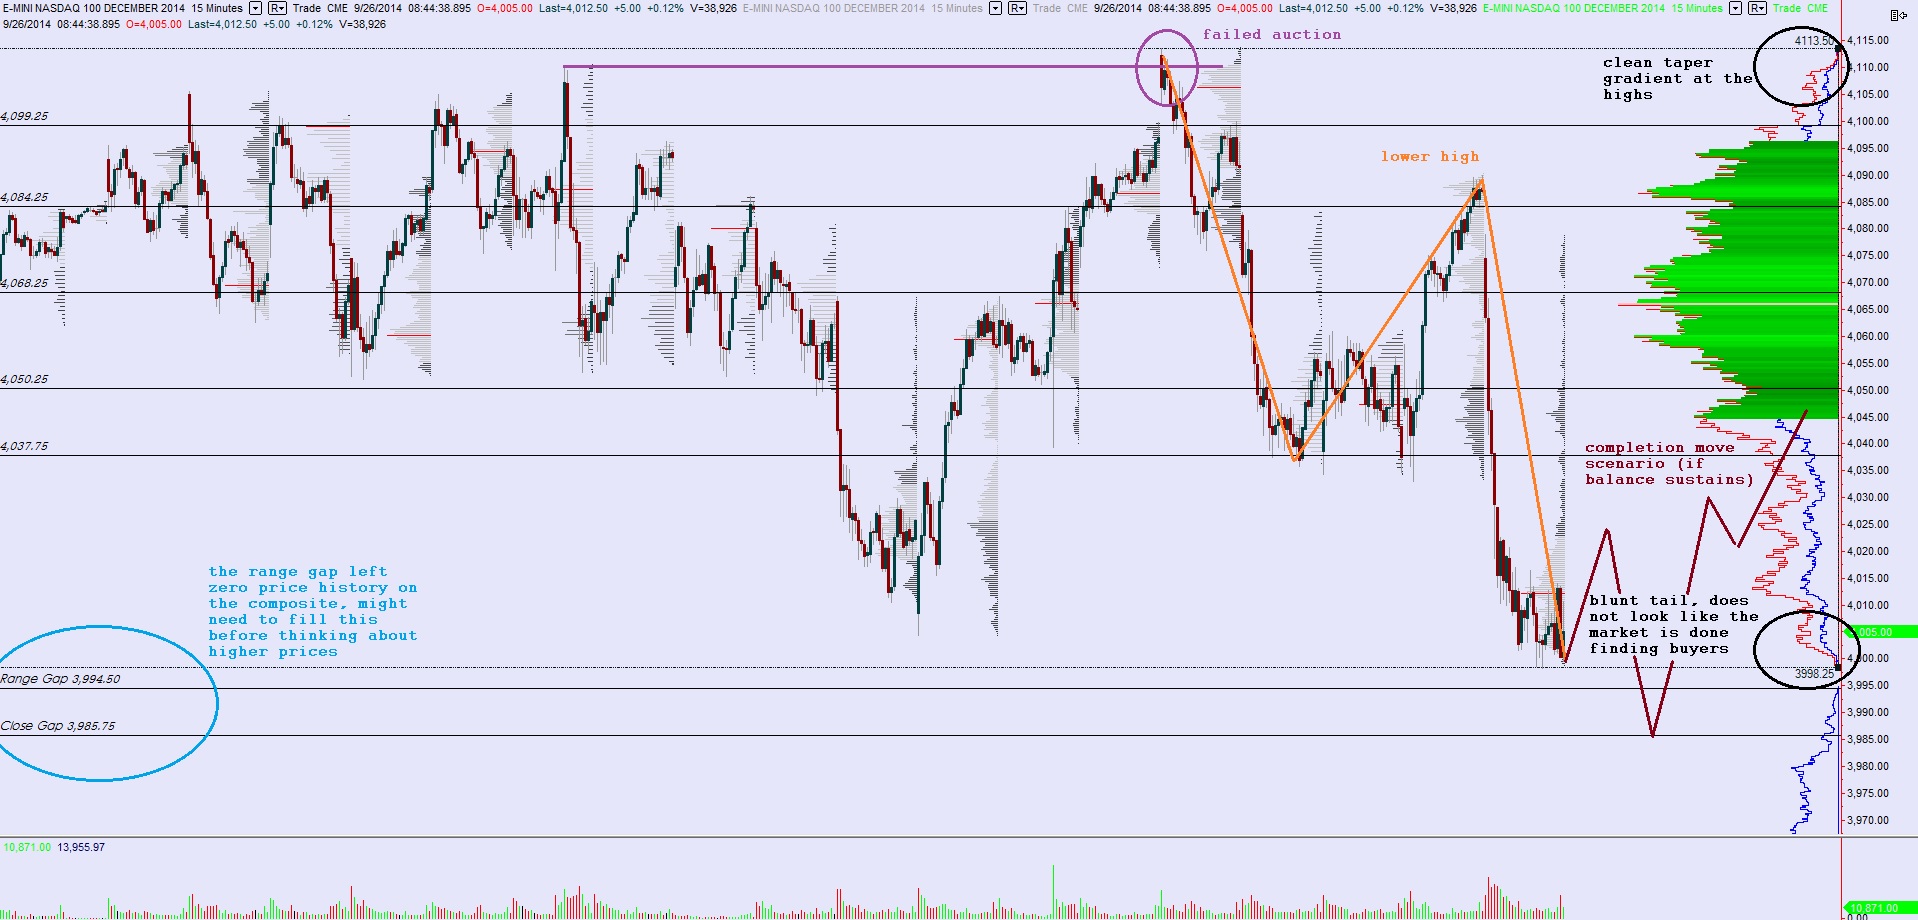
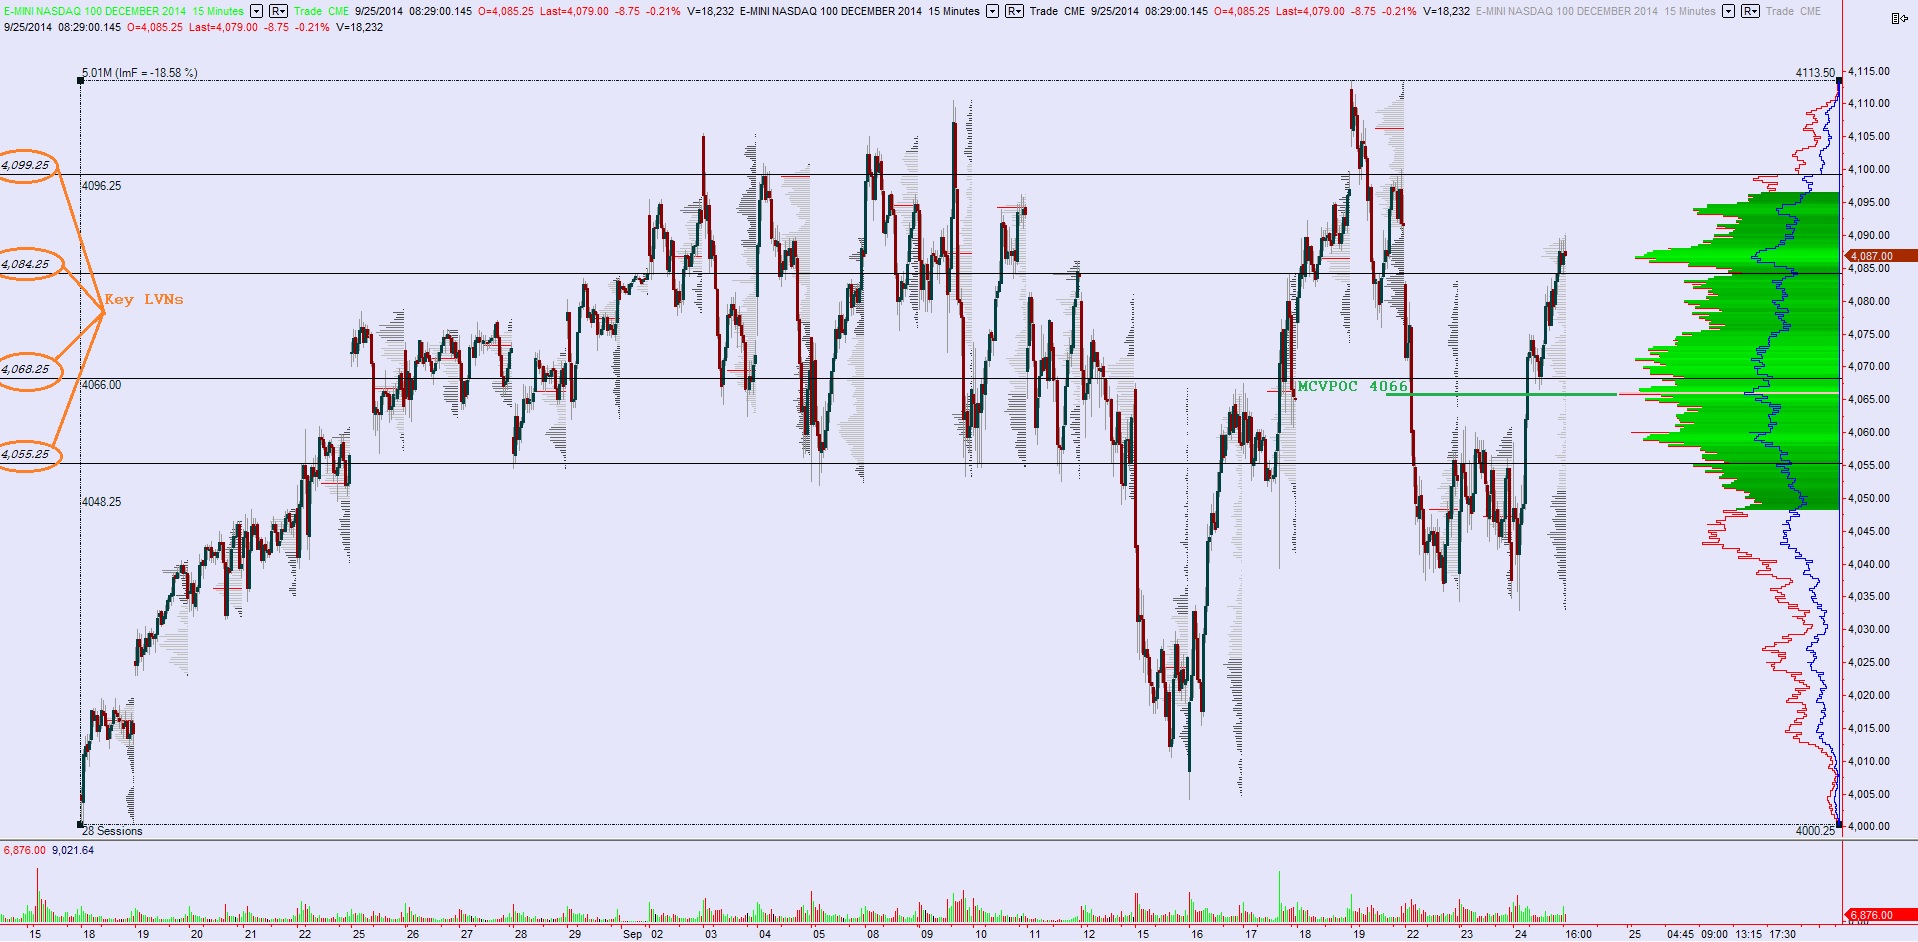
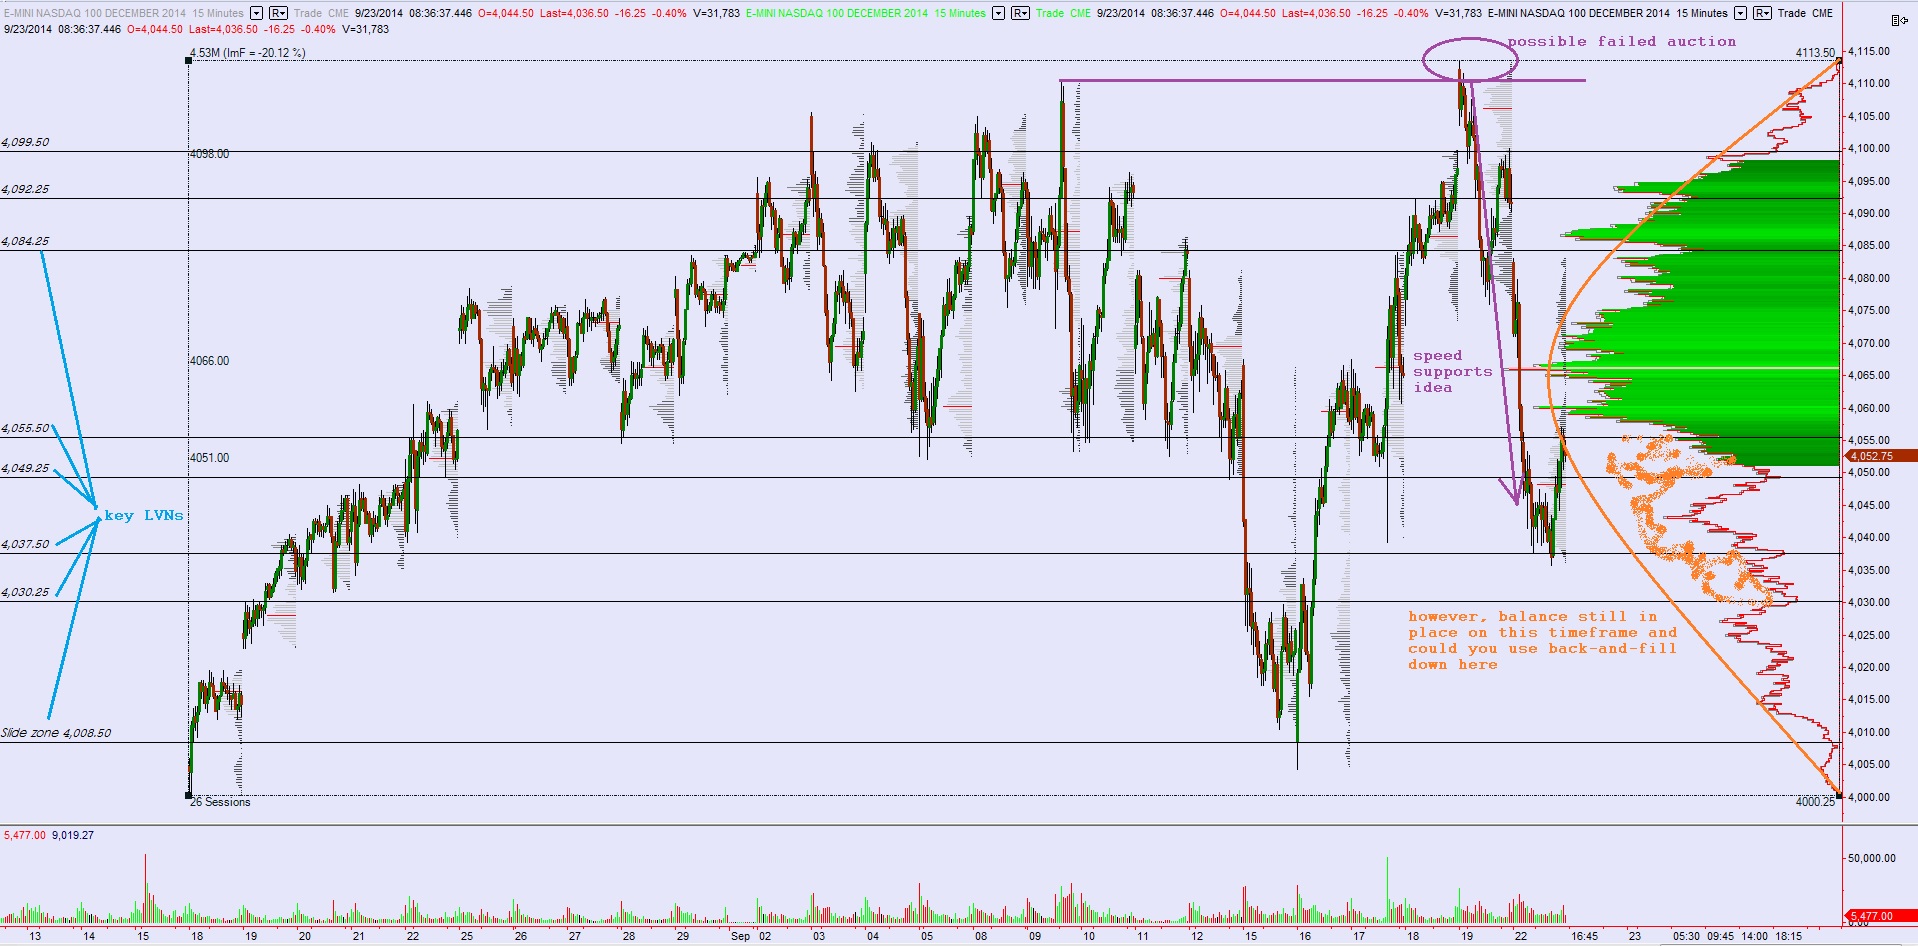
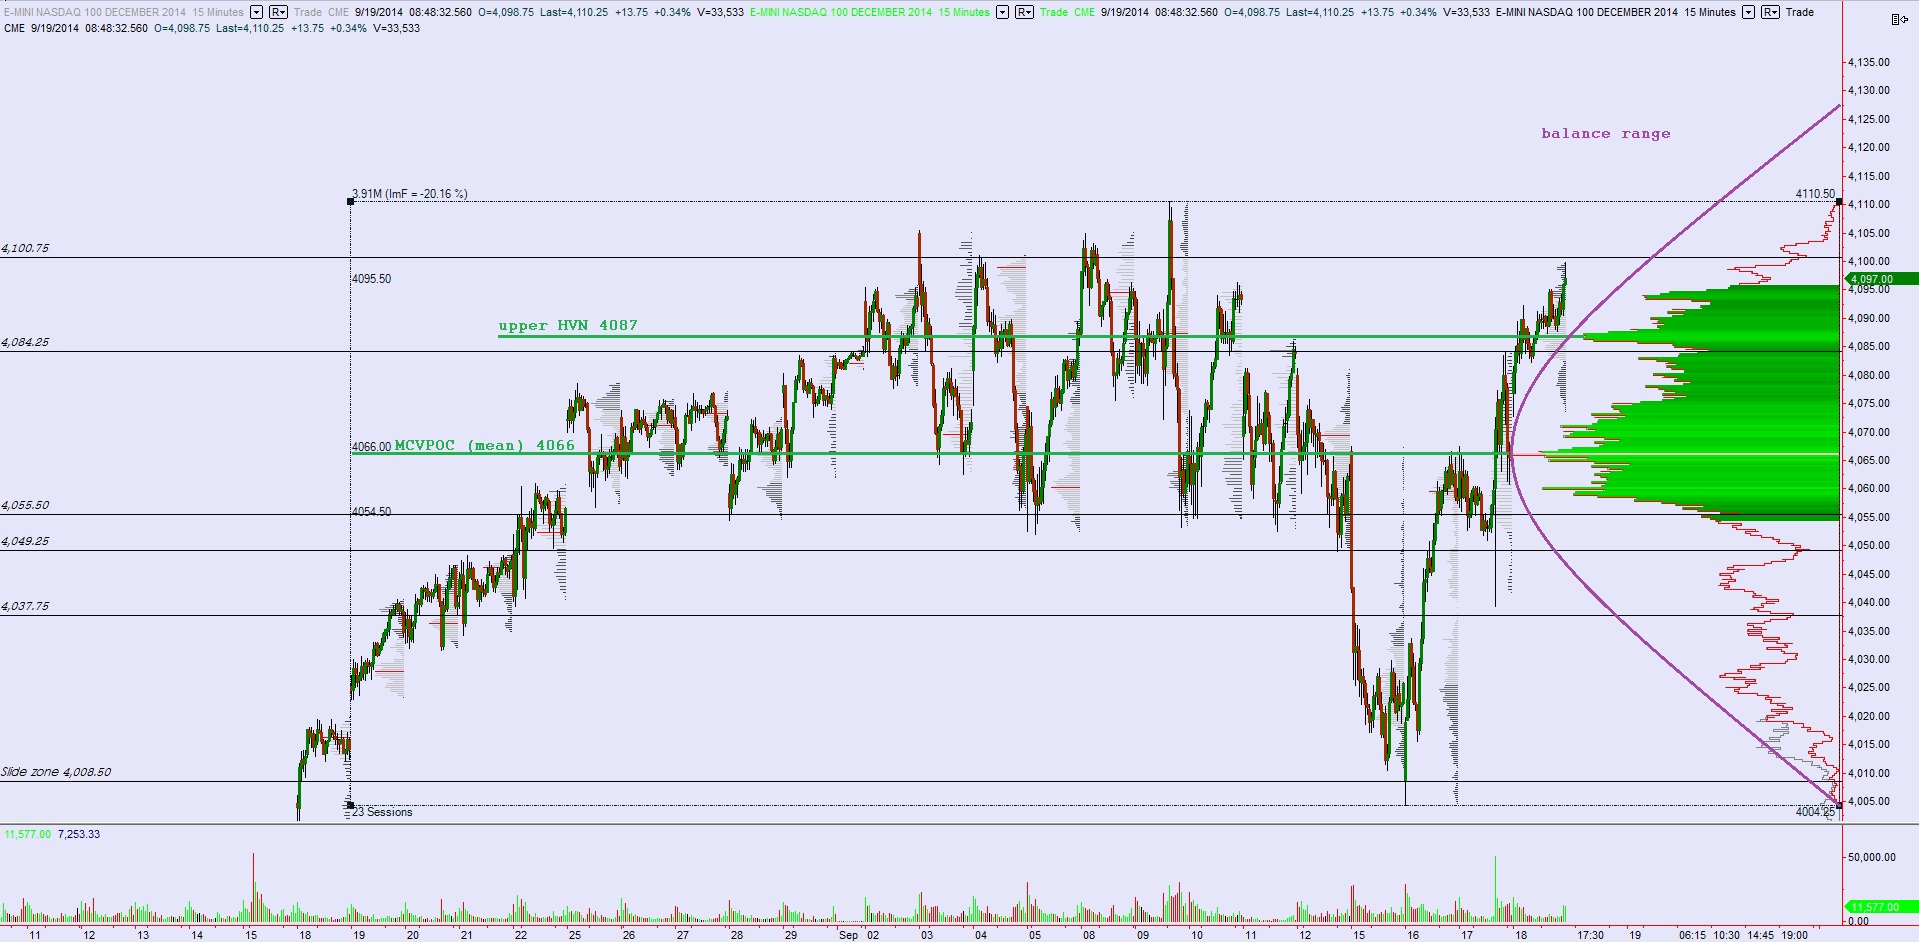
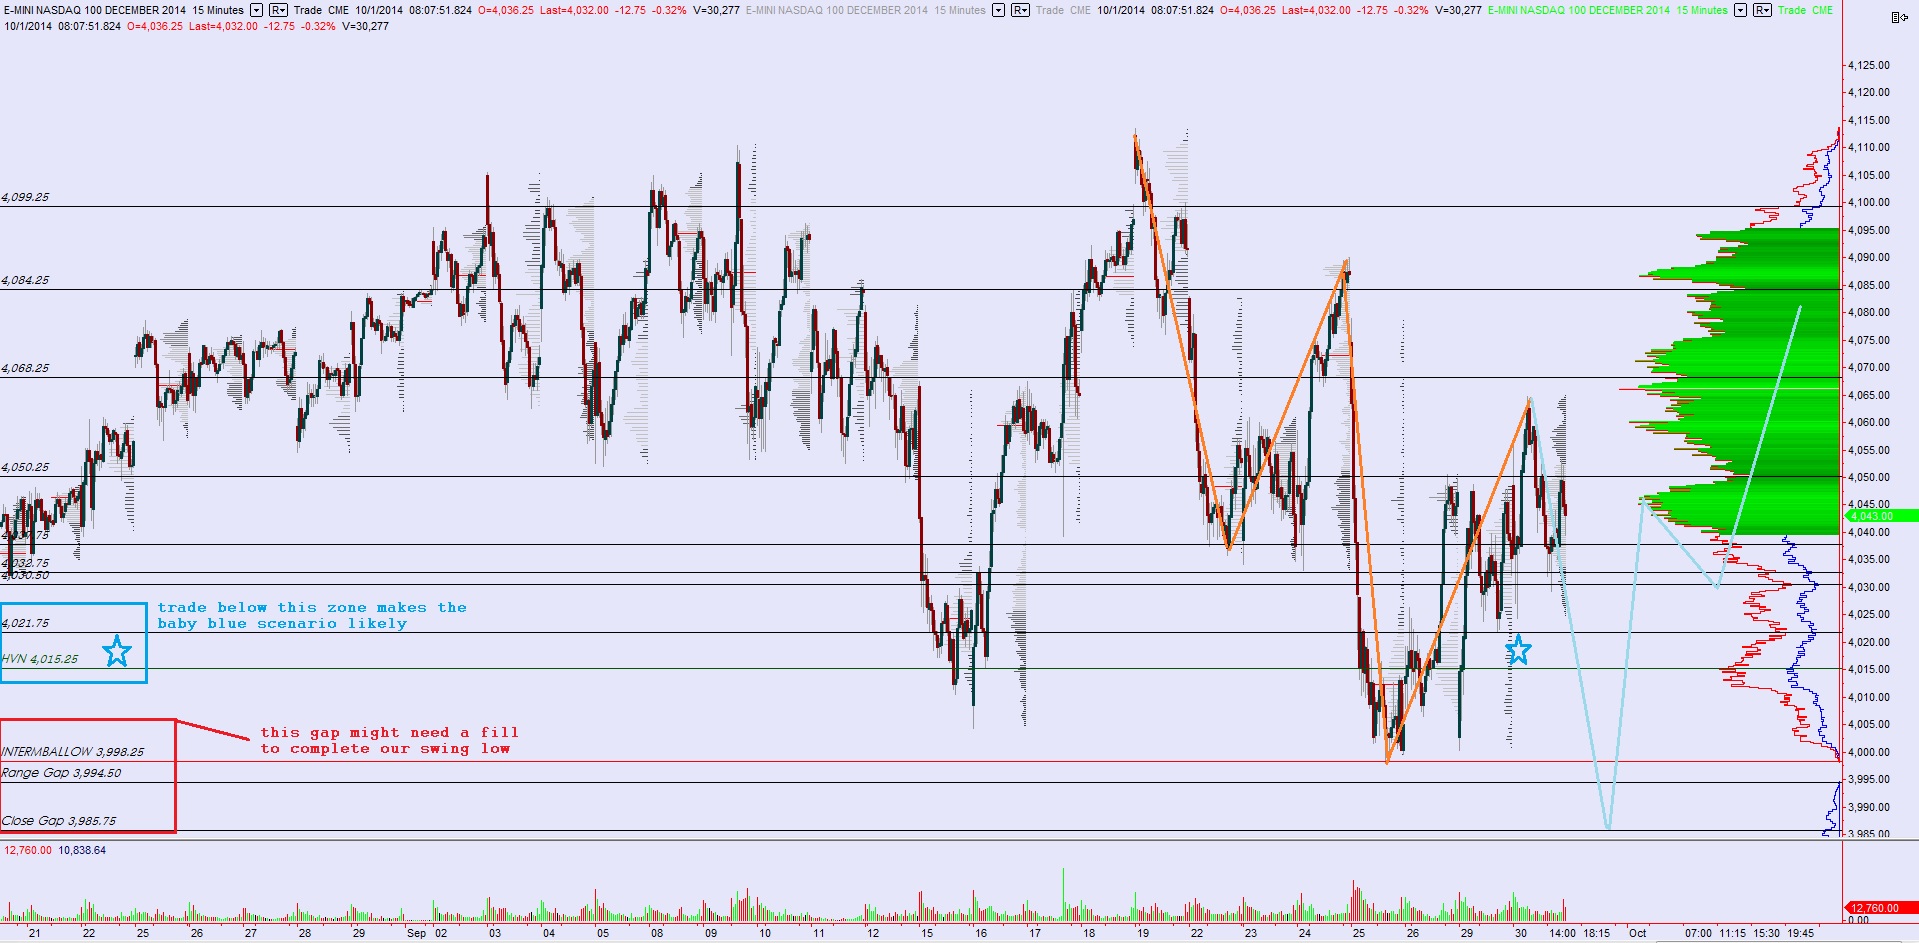
The intermediate term is balanced with a slight downward bias. This balance will be 33 sessions old today and we can see a pattern of lower highs and lows emerging. With the open gap below sellers have something to shoot for. Thus the intermediate term is neutral-to-slight-bearish:
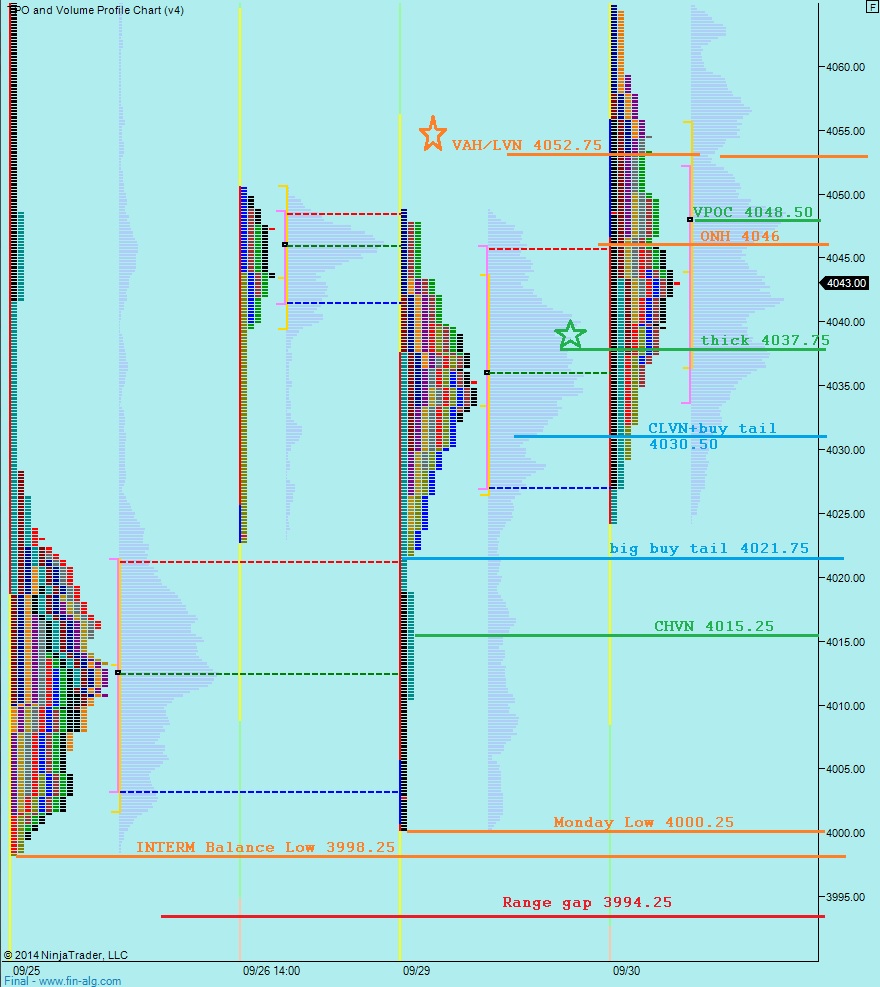
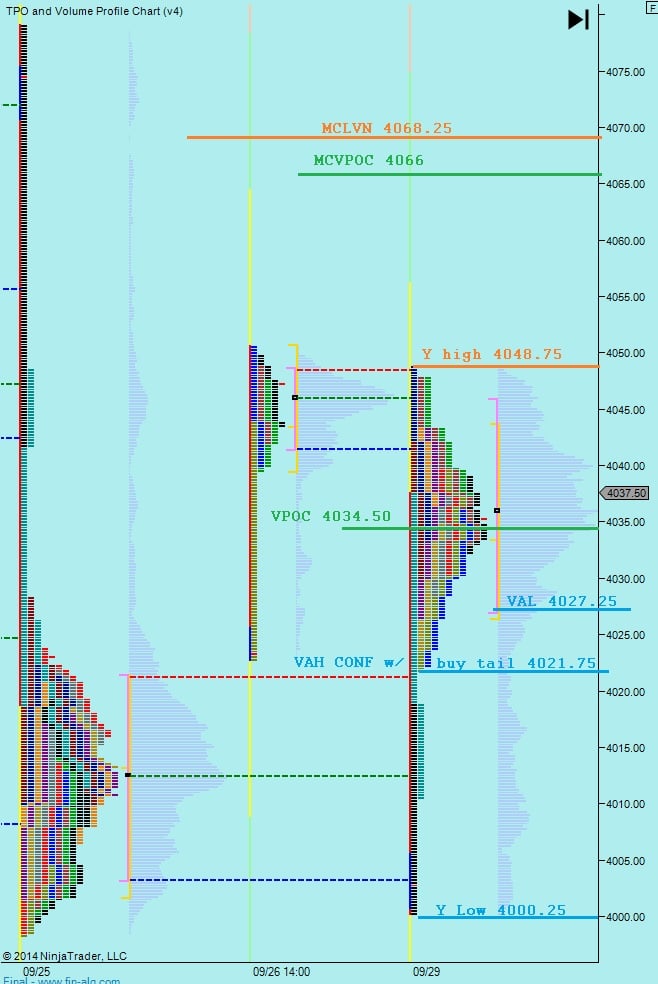
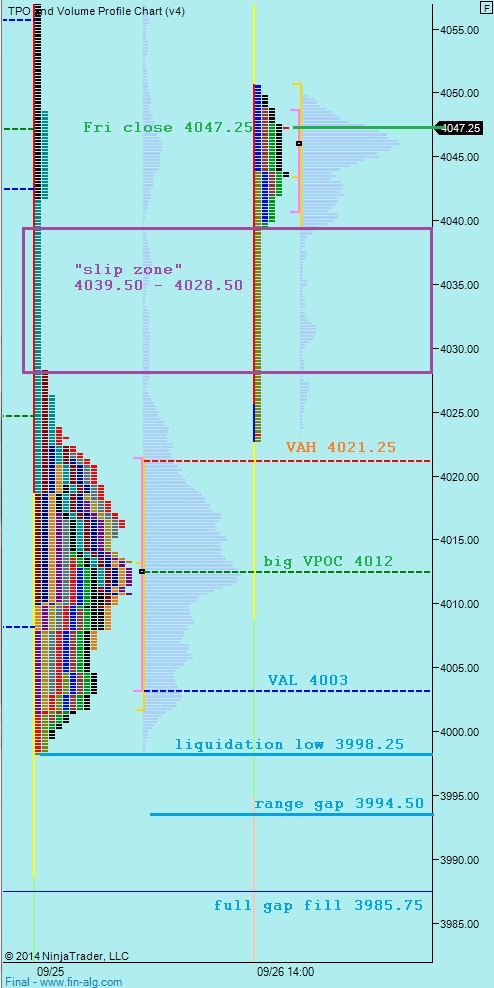
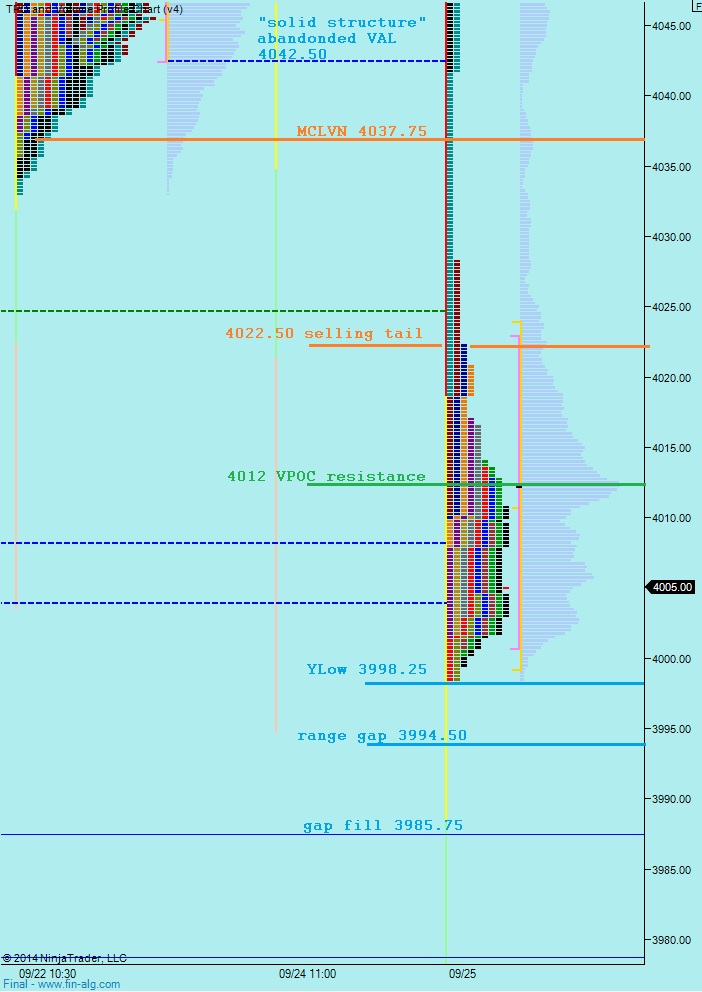
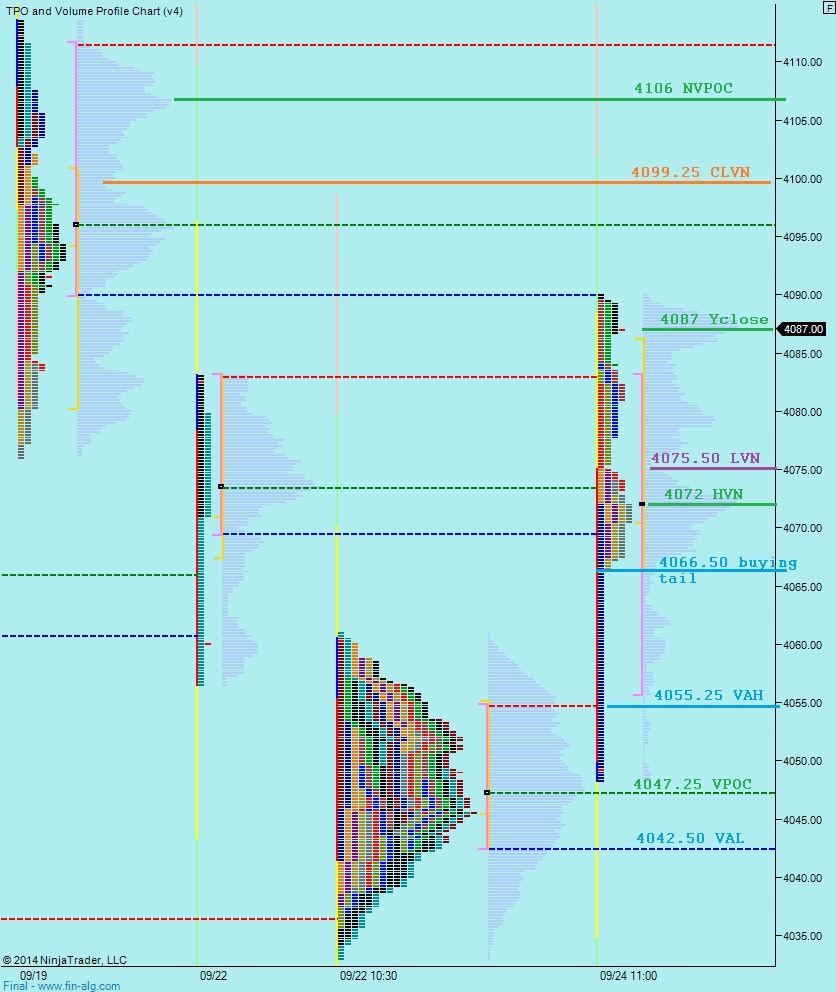
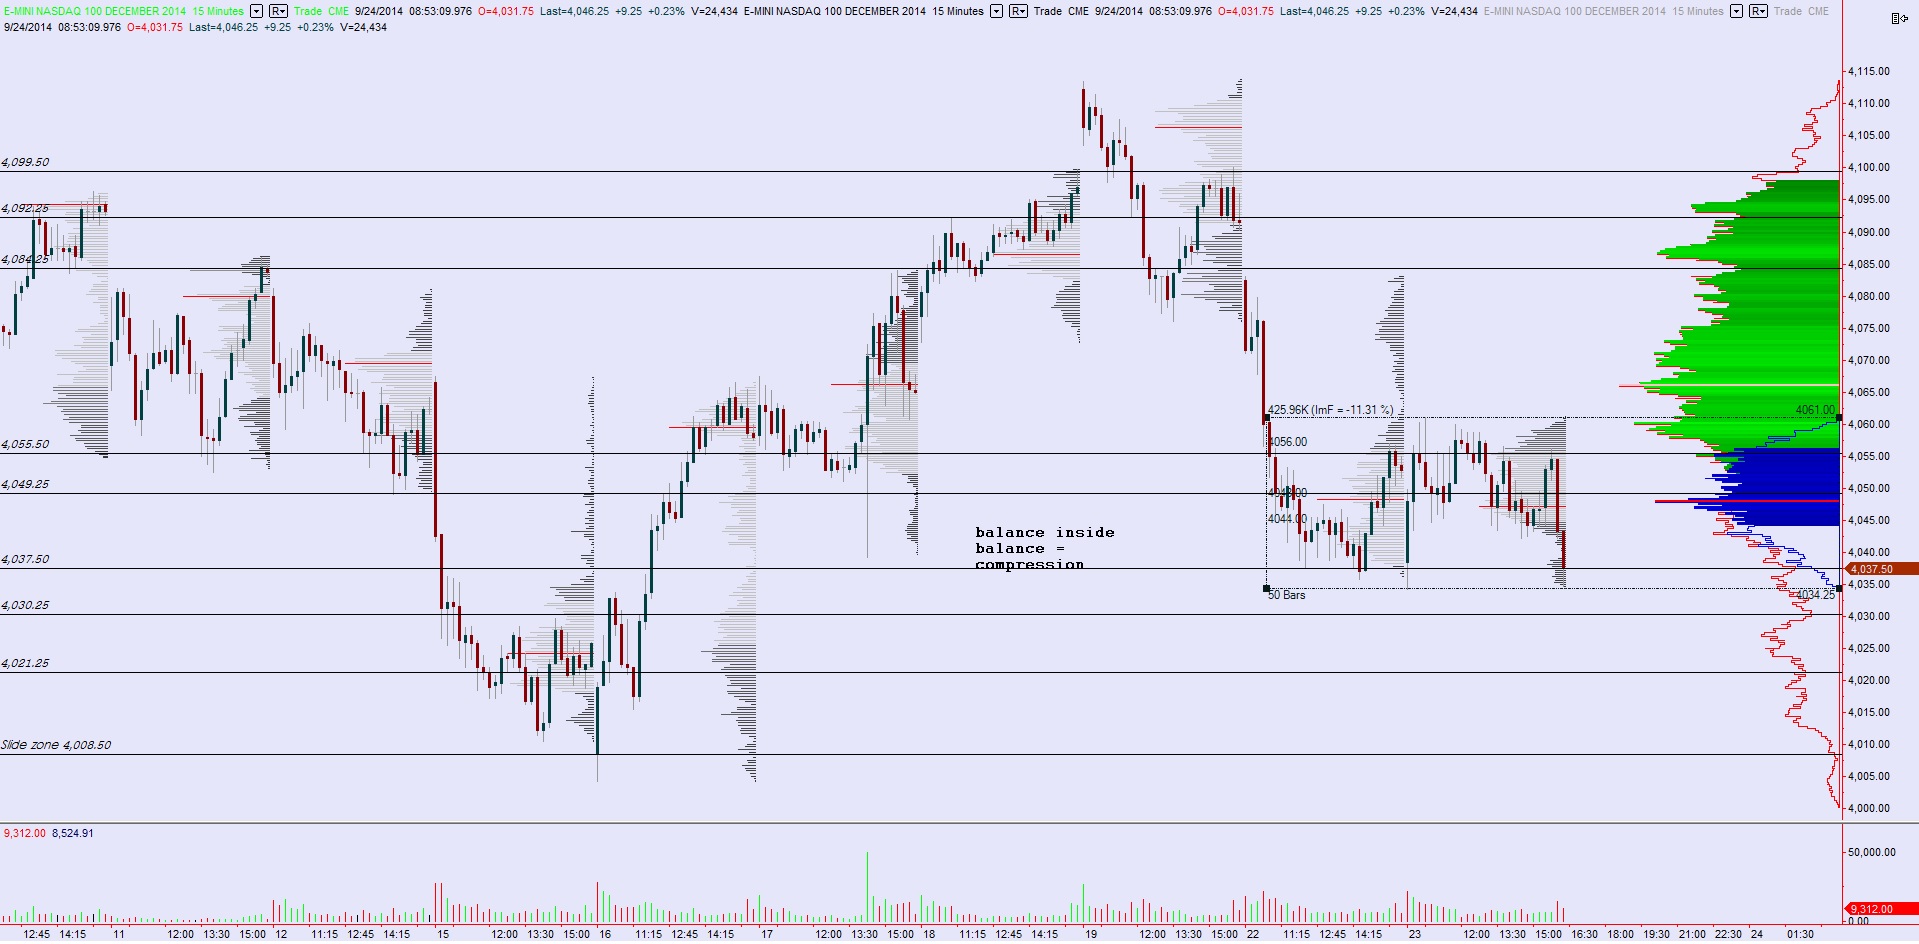
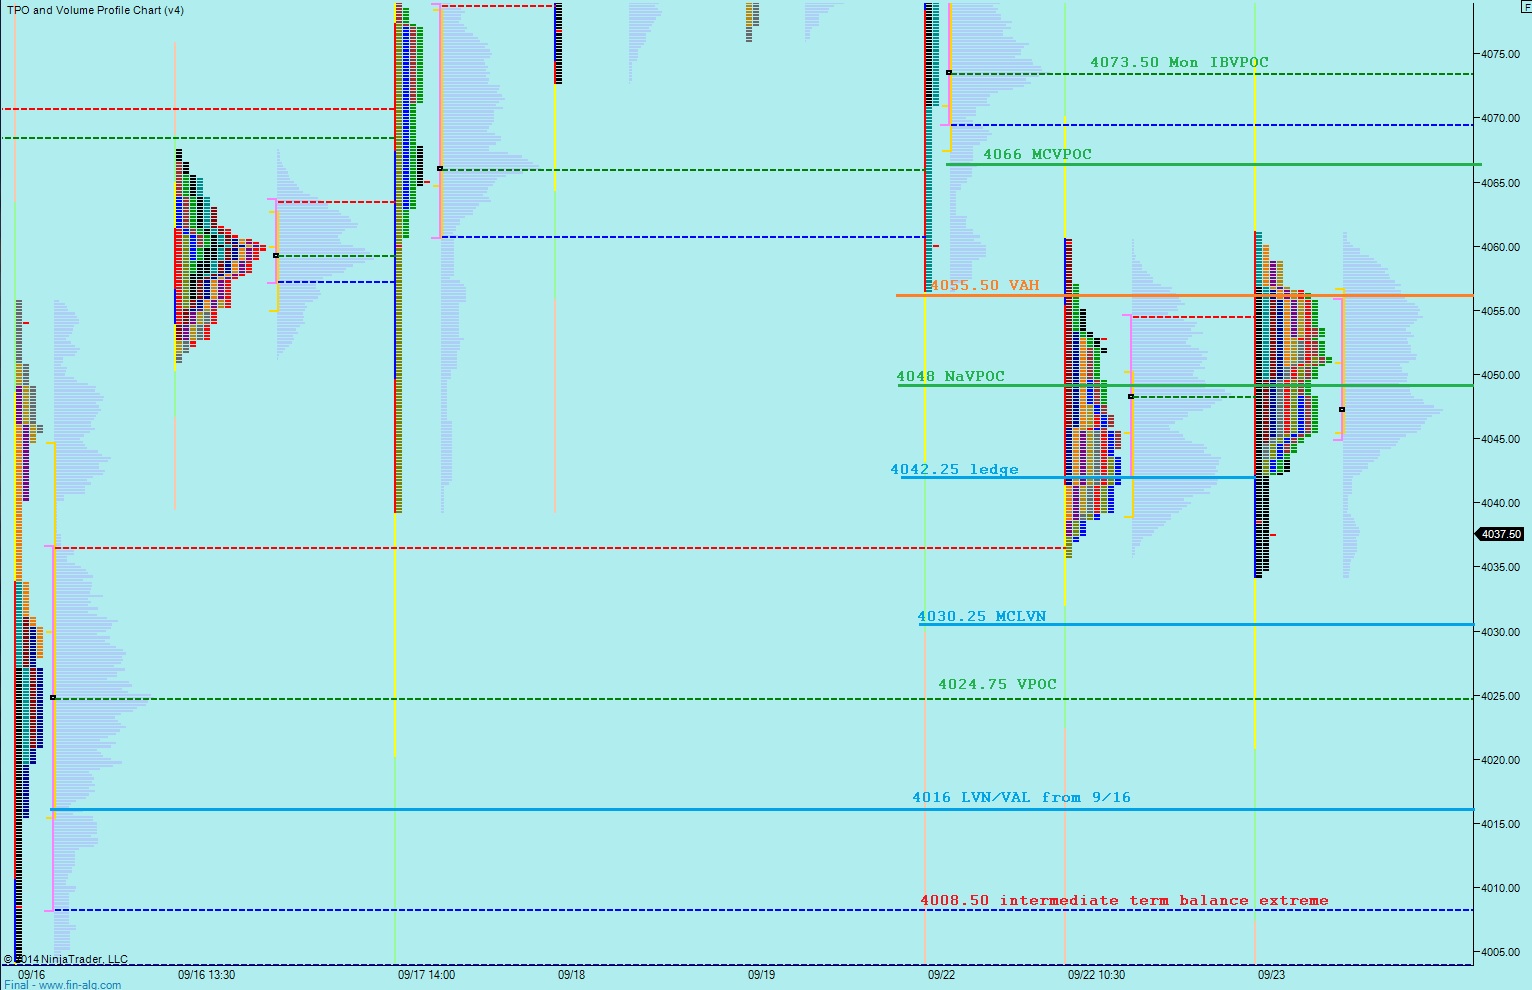
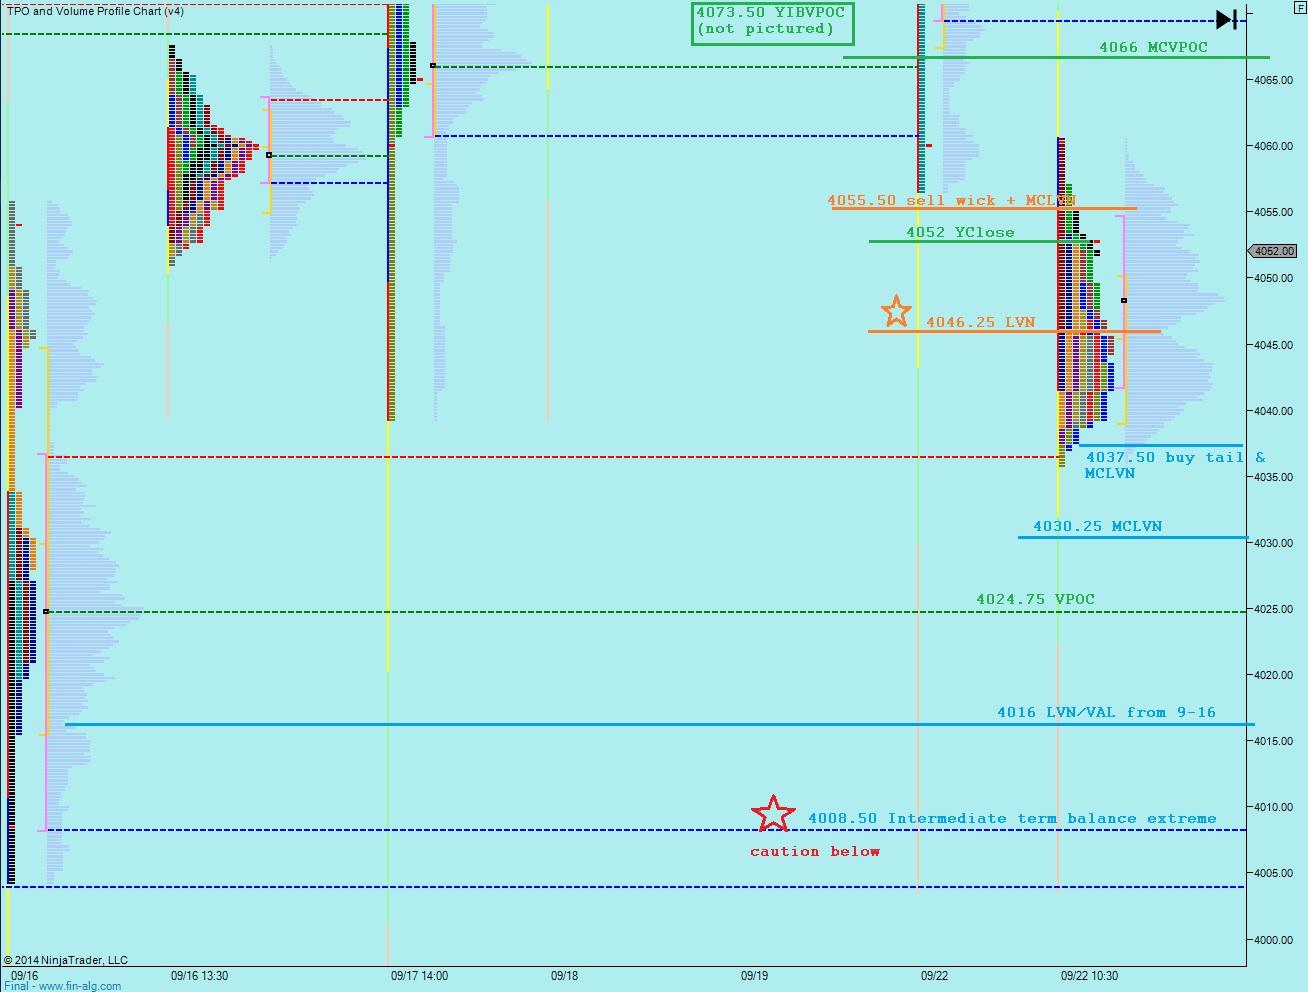
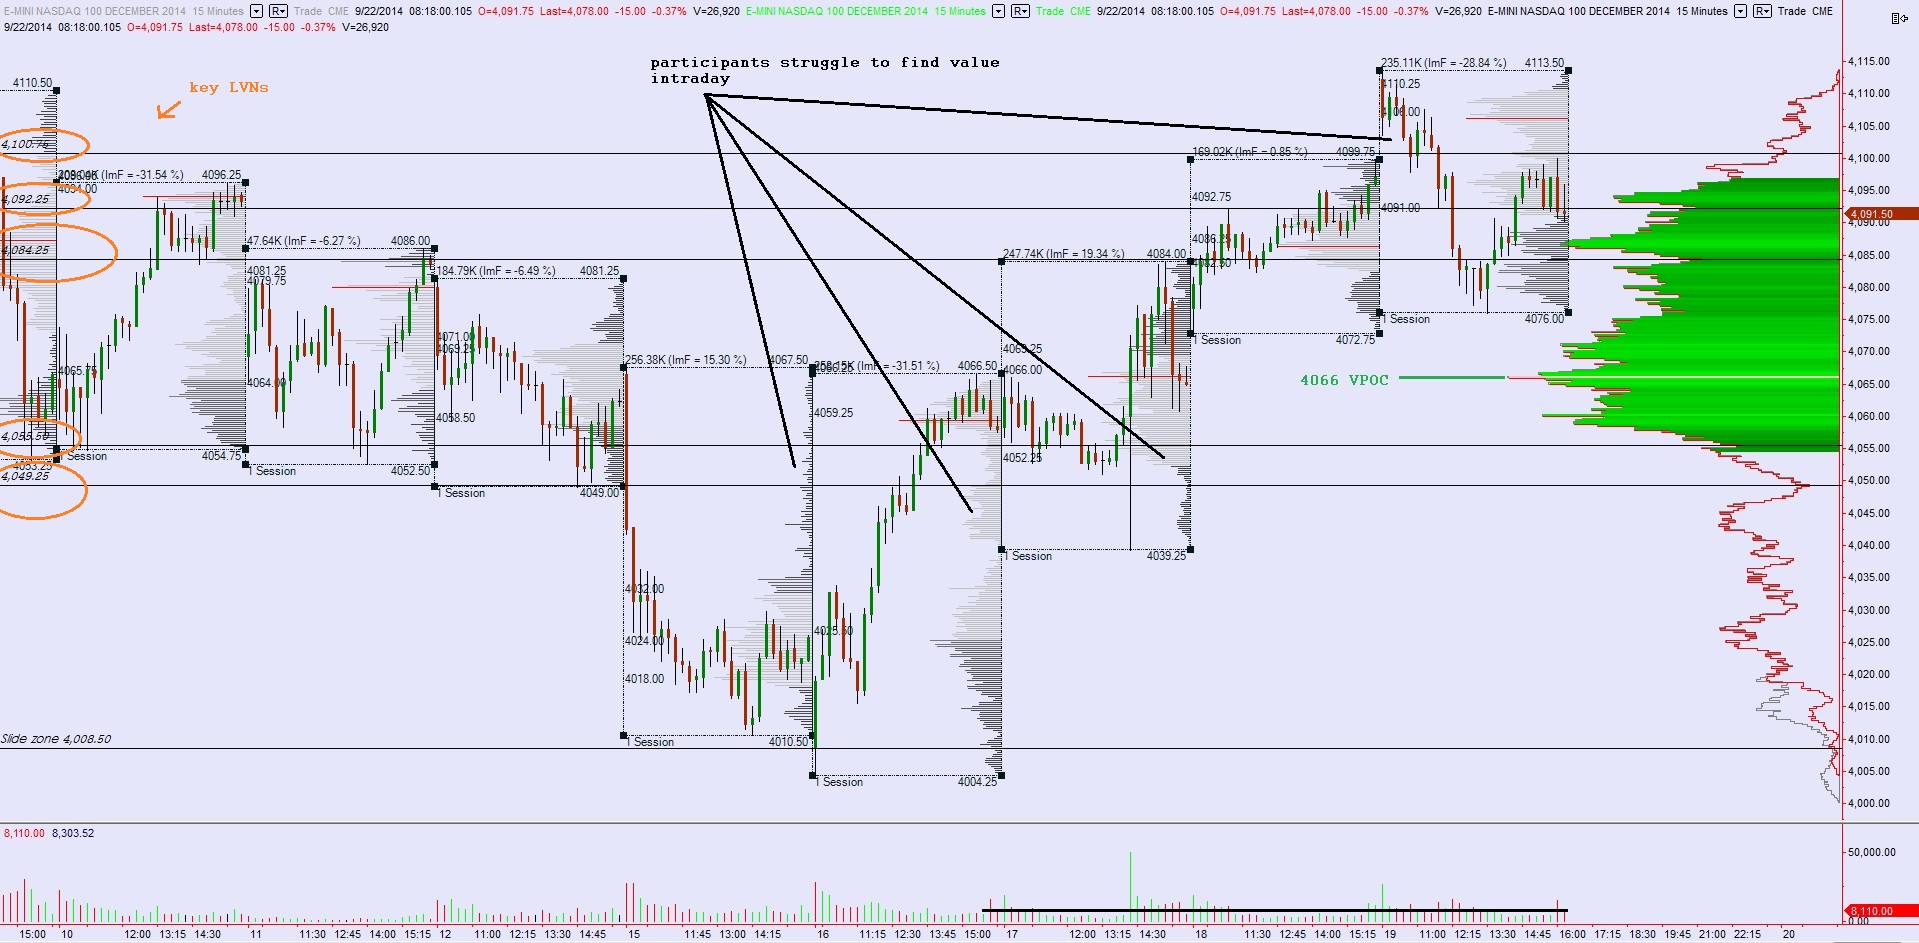
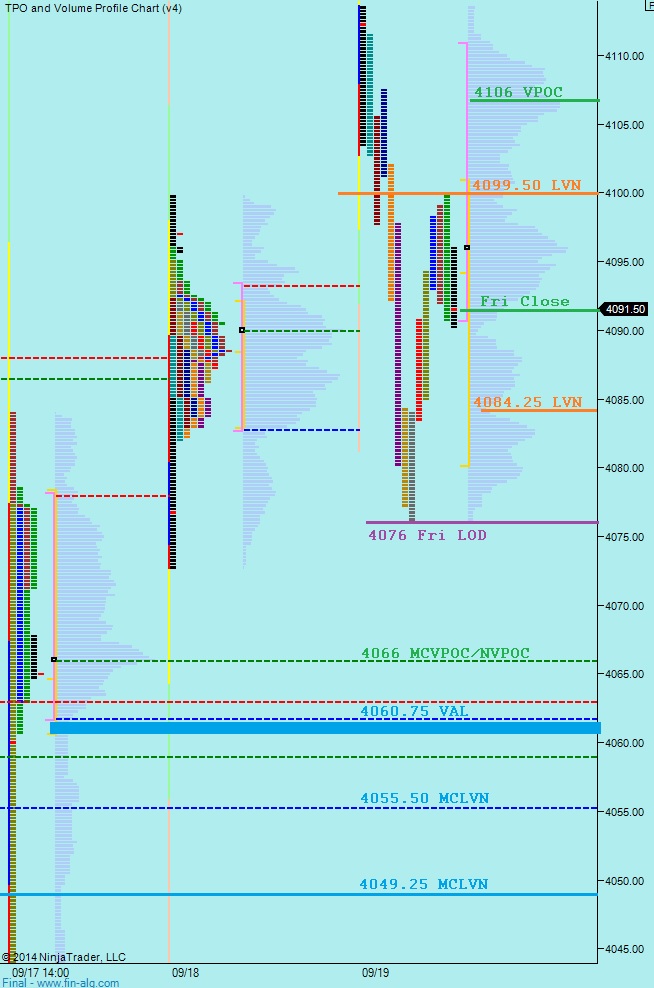
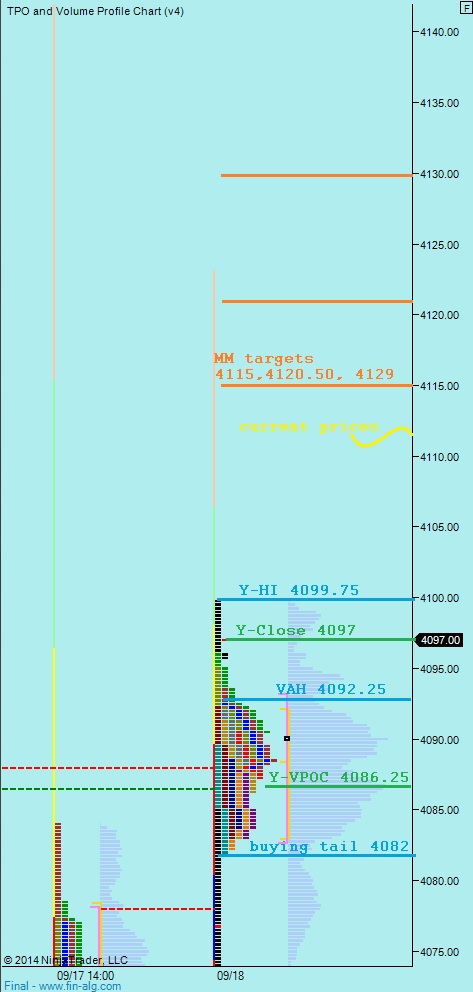
Finally, the short term came into overlapping balance yesterday verse Monday. The auction yesterday was very clean and methodical and balanced. As we are set to open near the low of the session, we will have a fairly early indication of whether prices are trying to head lower or instead accepting and continuing higher. I have highlighted the price levels I will be observing on the following market profile chart: