Sellers dominated the globex trading session overnight by sustaining a downtrend throughout trade. Sources suggest the unrest in Hong Kong may be weighing on investors’ minds as we start the week. However what matters most is the fast approaching month end. This month saw shifting tides across the macro spectrum and as that money sloshes around bigger waves occur.
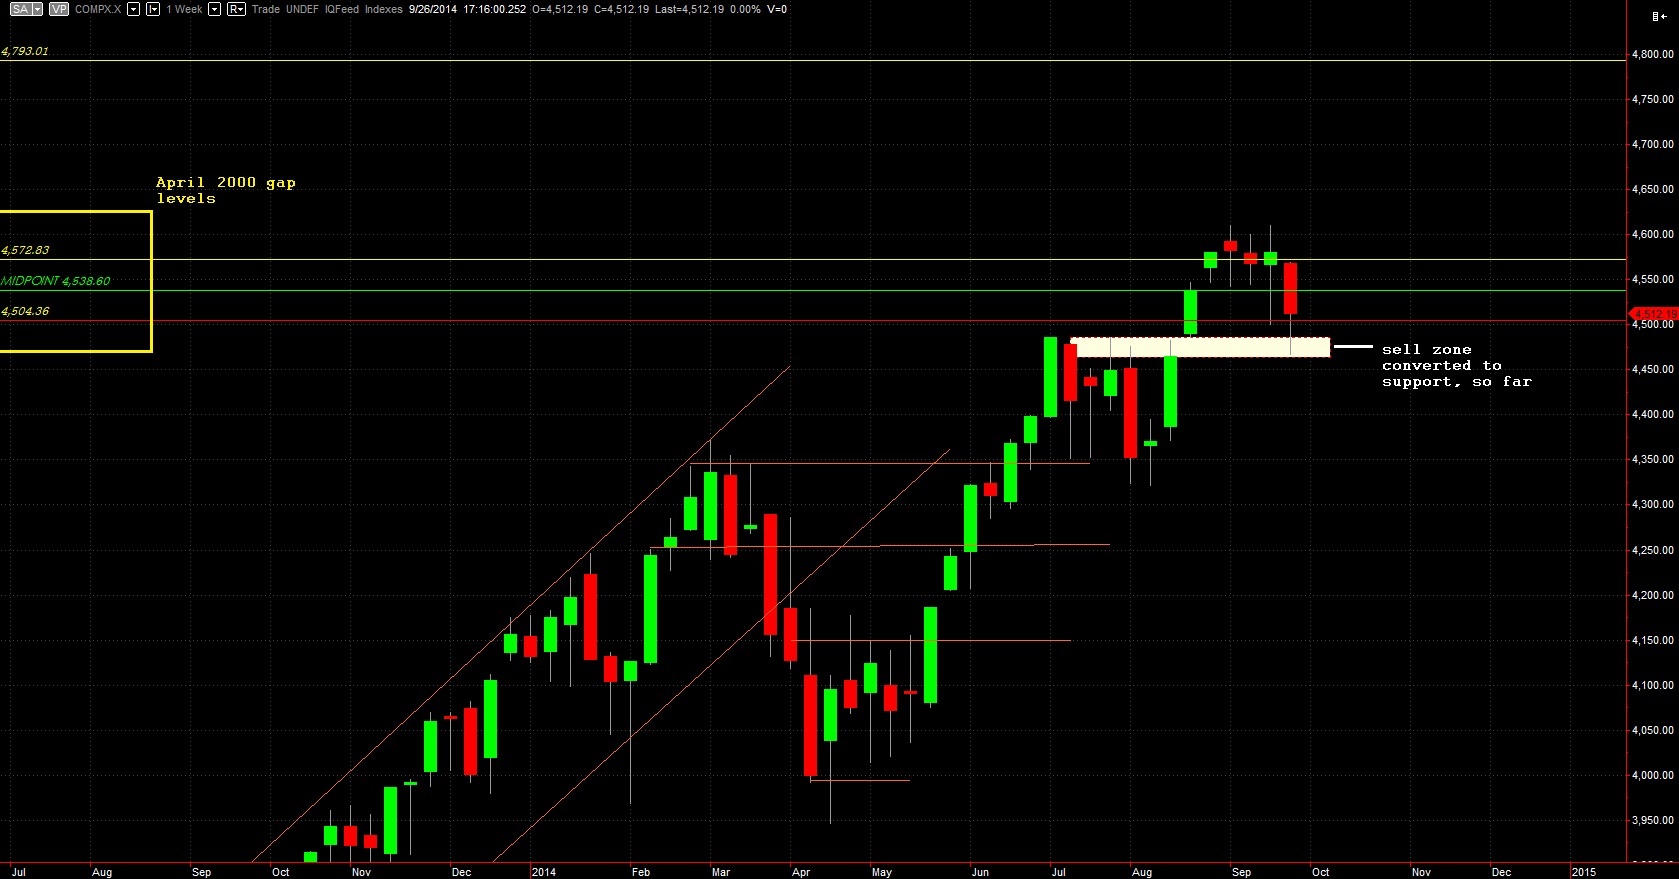
If you recall, we discussed a gap on the Nasdaq Composite chart which dated back to April 2000. When the dot com hysteria came tumbling down it included a quarterly gap down which never filled. When we came into the gap at the end of last August prices ripped through to the other side in a scant two weeks. Since then we printed three hammers with the wicks increasing in size as uncertainty grew. Then last week we fell back down through the bottom of the gap before finding buyers in a zone where sellers were initially defending. This is how an uptrend works, until it doesn’t. I have highlighted these long term observations below:
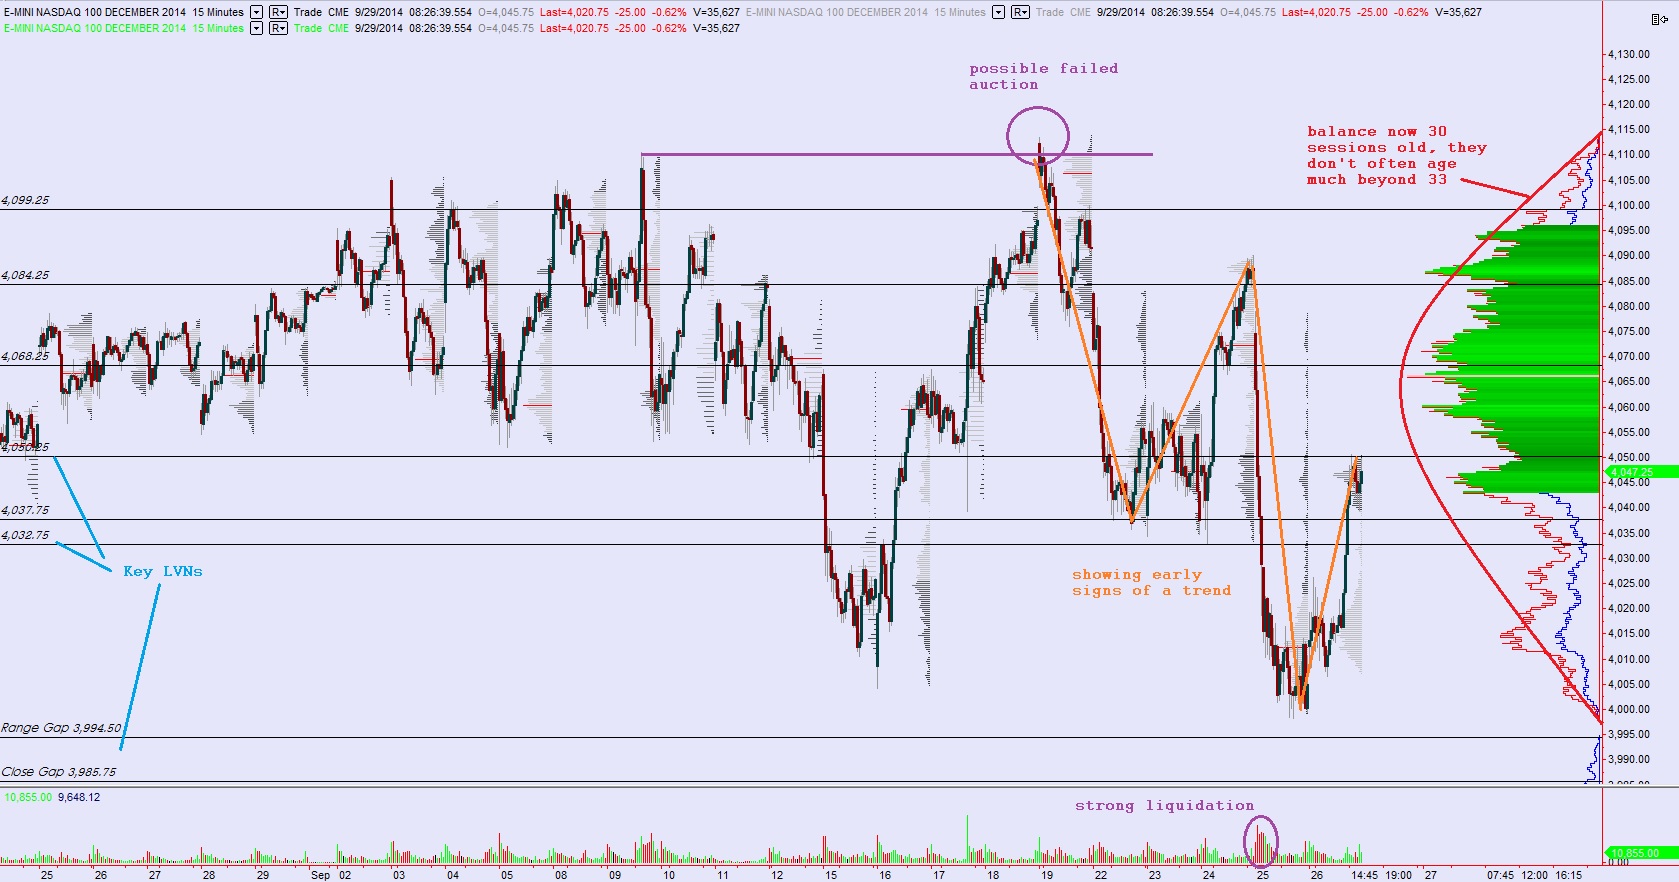
Intermediate term, we have been monitoring a balance which developed, showed sell side imbalance, moved lower and corrected itself back into symmetry, made new highs confirming the balance but also possibly a failed auction, and since then we are showing signs of a downtrend. If we make a new low, and especially if it entices more supply into the market, we could very easily transition into a seller controlled intermediate-term timeframe. See below:
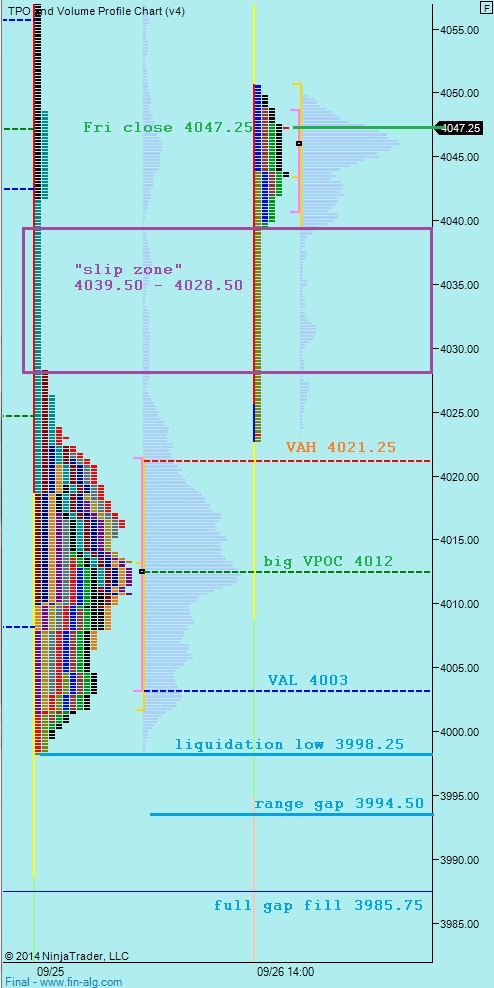
Finally, drawing our eyes in close to the short term auction, I had made some modifications to the profiles to show us a clear picture of the auction. Thursday was the most sell flow I can ever recall seeing since becoming intimately involved with the Nasdaq futures around March this year. It was 3 straight hours of relentless selling. When responsive buyers did emerge, printing two impressive 12.5 point and 10 point rotations, each was sold into. It took six more 10+ point rotations to stabilize the market. However, the market did stabilize on the short term, and the resulting print is an enormous long liquidation, b-shaped profile. Then Friday we popped out of the low balance and printed what amounts to a short squeeze P-shape. As we come into cash open, the overnight sellers have rejected the small upper value and put us back inside the lower balance zone. How we navigate this region early on will offer us objective clues into short term direction. I have highlighted the key price levels below:


Raul, brilliant analysis! Thank you for your expertise.
Raul – really appreciate the commentary, quality stuff
trade them well today gents, not a good environment to lose sight of risk
Primary hypothesis – test lower to VAL 4003 and find responsive buyers who target VPOC 4012 then a test of VAH 4021.25. where we chop before balancing out near 4012
Hypo 2 – same as hypo one, but buyers sustain above 4021.25 then possibility of acceleration through “slip zone” 4028.50 – 4039.50 for a gap fill up to 4047.25
Hypo 3 – increased risk of drive due to open out of Friday range, drive down, take out liquidation low 3998.25 and accomplish range gap 3994.50 where we find buyers who give way to full gap fill 3985.75 and target NVPOC 3967.25
hypo 4 – similar to hypo 3 but market dramatically slows between 3998.25 – 3994.50 and we see a sharp responsive buy (start corrective wave up)
/NQ_F nice acceleration into the “slip zone” from buyers, hypo 2 in effect
and that’s how hypo 2 played, bellissima
Raul – I thought of you this morn, as for the life of me, I could not get my god-blessed ZU calls to sell this morning… What should have been a great profit, now sits as a pile of chicken scratch…
plan to take delivery and work that pocket